 RSS Feed
 by Calculated Risk on 9/21/2015 12:31:00 PM
Monday, September 21, 2015
A Few Random Comments on August Existing Home Sales
I've been expecting that the seasonally adjusted pace for existing home sales would slow due to limited inventory and higher prices. Maybe this is the beginning of that slowdown.
However, it is important to remember that new home sales are more important for jobs and the economy than existing home sales. Since existing sales are existing stock, the only direct contribution to GDP is the broker's commission. There is usually some additional spending with an existing home purchase - new furniture, etc - but overall the economic impact is small compared to a new home sale.
So some slowing for existing home sales (if it continues) would not be a big deal for the economy.
Even though inventory was up a little month-to-month, Inventory is still very low (down 1.7% year-over-year in August). More inventory would probably mean smaller price increases and slightly higher sales, and less inventory means lower sales and somewhat larger price increases.
Note: I'm still hearing reports of rising inventory in some mid-to-higher priced areas. However many low priced areas still have little inventory.
Also, the NAR reported distressed sales declined a little further year-over-year:
Matching the lowest share since NAR began tracking in October 2008, distressed sales — foreclosures and short sales — remained at 7 percent in August for the second consecutive month; they were 8 percent a year ago. Five percent of August sales were foreclosures and 2 percent were short sales.The following graph shows existing home sales Not Seasonally Adjusted (NSA).
 Click on graph for larger image.
Sales NSA in August (red column) were higher than in August 2014, but below the level of August 2013 (NSA).
Earlier:
• Existing Home Sales in August: 5.31 million SAAR
Existing Home Sales in August: 5.31 million SAAR
by Calculated Risk on 9/21/2015 10:13:00 AM
From the NAR: Existing-Home Sales Stall in August, Prices Moderate
Total existing–home sales, which are completed transactions that include single–family homes, townhomes, condominiums and co–ops, fell 4.8 percent to a seasonally adjusted annual rate of 5.31 million in August from a slight downward revision of 5.58 million in July. Despite last month's decline, sales have risen year–over–year for 11 consecutive months and are 6.2 percent above a year ago (5.00 million). ...
Total housing inventory at the end of August rose 1.3 percent to 2.29 million existing homes available for sale, but is 1.7 percent lower than a year ago (2.33 million). Unsold inventory is at a 5.2–month supply at the current sales pace, up from 4.9 months in July.
 Click on graph for larger image.
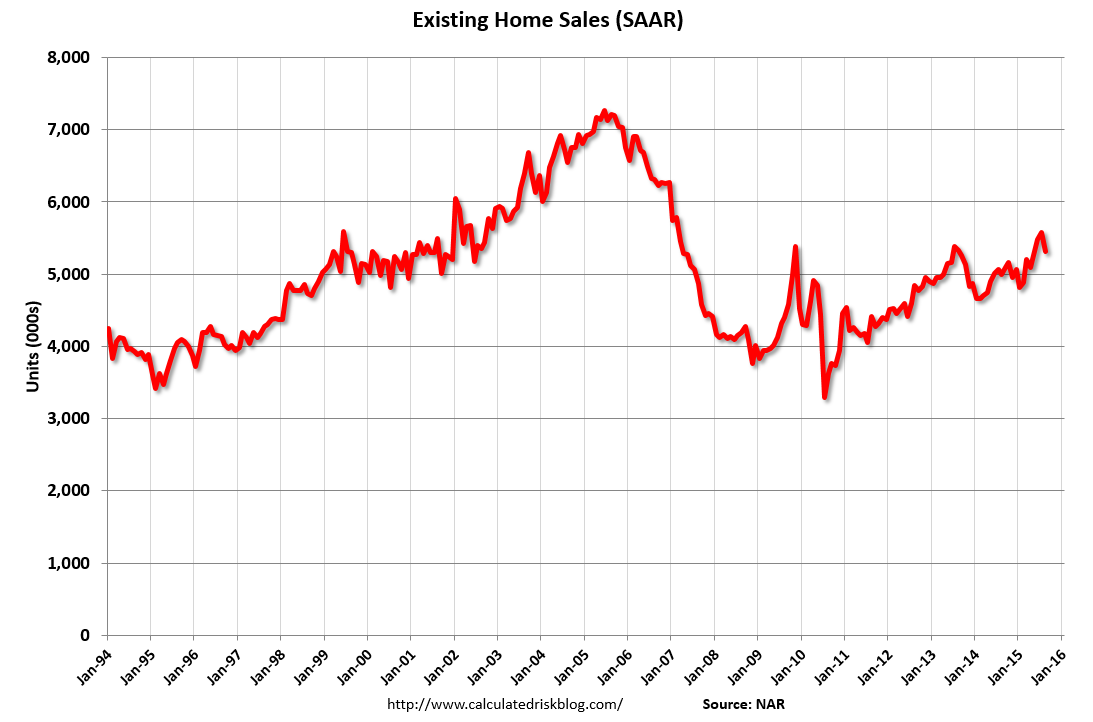
This graph shows existing home sales, on a Seasonally Adjusted Annual Rate (SAAR) basis since 1993.
Sales in August (5.31 million SAAR) were 4.8% lower than last month, and were 6.2% above the August 2014 rate.
The second graph shows nationwide inventory for existing homes.
 According to the NAR, inventory increased to 2.29 million in August from 2.26 million in July. Headline inventory is not seasonally adjusted, and inventory usually decreases to the seasonal lows in December and January, and peaks in mid-to-late summer.
The third graph shows the year-over-year (YoY) change in reported existing home inventory and months-of-supply. Since inventory is not seasonally adjusted, it really helps to look at the YoY change. Note: Months-of-supply is based on the seasonally adjusted sales and not seasonally adjusted inventory.
 Inventory decreased 1.7% year-over-year in August compared to August 2014.
 Months of supply was at 5.2 months in August.
This was below expectations of sales of 5.50 million. For existing home sales, a key number is inventory - and inventory is still low. I'll have more later ...
Sunday, September 20, 2015
Monday: Existing Home Sales
by Calculated Risk on 9/20/2015 09:23:00 PM
Weekend:
• Schedule for Week of September 20, 2015
Monday:
• Existing Home Sales for August from the National Association of Realtors (NAR). The consensus is for 5.50 million SAAR, down from 5.59 million in July. Economist Tom Lawler estimates the NAR will report sales of 5.54 million SAAR.
From CNBC: Pre-Market Data and Bloomberg futures: currently S&P futures are down 3 and DOW futures are mostly unchanged (fair value).
Oil prices were down slightly over the last week with WTI futures at $44.83 per barrel and Brent at $47.53 per barrel. A year ago, WTI was at $92, and Brent was at $97 - so prices are down over 50% year-over-year.
Here is a graph from Gasbuddy.com for nationwide gasoline prices. Nationally prices are at $2.29 per gallon (down over $1.00 per gallon from a year ago).
CoStar: Commercial Real Estate prices "indices post moderate gains" in July, up 12% year-over-year
by Calculated Risk on 9/20/2015 11:59:00 AM
Here is a price index for commercial real estate that I follow.
From CoStar: CCRSI: Composite Price Indices Post Moderate Gains in July
NATIONAL COMPOSITE PRICE INDICES POST MODERATE GAINS IN JULY. Both the equal- and value-weighted national composite price indices advanced in July 2015 as a combination of strong market fundamentals, low interest rates and improving market liquidity continued to support conditions for CRE price growth. However, the pace of price growth cooled slightly from that of the previous six months ending in June 2015.
...
MODERATION IN PRICE GROWTH MOST EVIDENT AT HIGH END OF THE MARKET. The moderation in the rate of price growth was especially evident at the high end of the market where pricing has already exceeded prior peak levels. CoStar’s value-weighted U.S. Composite Index, which is influenced by high-value trades, advanced 0.3% in July 2015 compared with a 1.1% average monthly pace from January 2015 through June 2015. The value-weighted U.S. Composite Index is already more than 13% above its prerecession peak level. The equal-weighted U.S. Composite Index increased 0.9% in July 2015, down slightly from the 1.1% average monthly pace from January 2015 to June 2015. It has now advanced to within 7.5% of its prerecession peak, supported by increased investor interest beyond core properties in primary markets.
emphasis added
 Click on graph for larger image.
This graph from CoStar shows the the value-weighted U.S. Composite Index and the equal-weighted U.S. Composite Index indexes.
The value-weighted index increased 0.3% in July and is up 12.9% year-over-year.
The equal-weighted index inceased 0.9% in July and up 11.7% year-over-year.
Note: These are repeat sales indexes - like Case-Shiller for residential - but this is based on far fewer pairs.
Saturday, September 19, 2015
Fed's Williams and Bullard on Rate Hikes
by Calculated Risk on 9/19/2015 05:45:00 PM
First San Francisco Fed President John Williams explains why he is willing to be patient on rate hikes: China, Rates, and the Outlook: May the (Economic) Force Be with You
Regarding monetary policy, we’re balancing a number of considerations, some of which argue for greater patience in raising rates and others that argue for acting sooner rather than later. Our decisions reflect a careful judgment about the relative risks and merits of those factors.Second, St. Louis Fed President James Bullard President explains why he supported a rate hike: St. Louis Fed's Bullard Discusses Normalization of U.S. Monetary Policy
I’ll start with the arguments for continued patience in removing monetary accommodation. First, we are constrained by the zero lower bound in monetary policy and this creates an asymmetry in our ability to respond to changing circumstances. That is, we can’t move rates much below zero if the economy slows or inflation declines even further. By contrast, if we delay, and growth or inflation pick up quickly, we can easily raise rates in response.
This concern is exemplified by downside risks from abroad. One such risk is the financial turmoil and economic slowdown in China, which I’ll get to shortly. More generally, economic conditions and policy overseas, from China to Europe to Brazil, have contributed to a substantial increase in the dollar’s value, which has held back U.S. growth and inflation over the past year. Further bad news from abroad could add to these effects.
That brings me to inflation, which has been under our target for over three years. This is not unique to the United States—inflation is very low in most of the world. Although we can ultimately control our own inflation rate, there’s no question that globally low inflation, and the policy responses this has provoked, have contributed to put downward pressure on inflation in the U.S. Although my forecast is that inflation will bounce back, this is only a forecast and there remains the danger that it could take longer than I expect.
Those are arguments on the side of the ledger arguing for more patience. On the other side is the insight of Milton Friedman, who famously taught us that monetary policy has long and variable lags. I use a car analogy to illustrate it. If you’re headed towards a red light, you take your foot off the gas so you can get ready to stop. If you don’t, you’re going to wind up slamming on the brakes and very possibly skidding into the intersection.
In addition, an earlier start to raising rates would allow us to engineer a smoother, more gradual process of policy normalization. That would give us space to fine-tune our responses to react to economic conditions; raising rates too late would force us into the position of a steep and abrupt hike, which doesn’t leave much room for maneuver. Not to mention, it could roil financial markets and slow the economy.
In considering the monetary policy choices, it’s important to remember that we’re in a very different place now than when we first instituted extremely accommodative policy. The economy has come a long way since the dark days of late 2009, when unemployment hit its 10 percent peak. Now we’re down to 5.1 percent and we’ve added over 12 million jobs, more than three million of them last year. Even better, most of those were full-time. It’s been a tough journey back, and monetary policy has played a crucial role in healing a once-ailing economy.
In the past, I have found the arguments for greater patience to clearly outweigh those for raising rates. The labor market was still far from full strength and the risk to the recovery’s momentum was very real. As the economy closed in on full employment, the other side of the ledger started gaining greater weight and the arguments have moved into closer balance.
Looking forward, I expect that we’ll reach our maximum employment mandate in the near future and inflation will gradually move back to our 2 percent goal. In that context, it will make sense to gradually move away from the extraordinary stimulus that got us here. We already took a step in that direction when we ended QE3. And given the progress we’ve made and continue to make on our goals, I view the next appropriate step as gradually raising interest rates, most likely starting sometime later this year. Of course, that view is not immutable and will respond to economic developments over time.
emphasis added
“The case for policy normalization is quite strong, since Committee objectives have essentially been met,” he said during his presentation titled, “A Long, Long Way to Go.”Bullard is not a voting member of the FOMC this year.
However, he noted, “Even during normalization, the Fed’s highly accommodative policy will be putting upward pressure on inflation, encouraging continued improvement in labor markets, and providing the best contribution to global growth that we can provide.”
Bullard noted that the FOMC wants unemployment at its long-run level and inflation at the target rate of 2 percent. “The Committee is about as close to meeting these objectives as it has ever been in the past 50 years,” he said.
To measure the distance of the economy from the FOMC’s goals, Bullard used a simple function that depends on the distance of inflation from the target rate of inflation and on the distance of the unemployment rate from its long-run average. This version puts equal weight on inflation and unemployment and is sometimes used to evaluate various policy options, Bullard explained. ...
While the objectives for unemployment and inflation have essentially been met based on those calculations, Bullard noted that monetary policy settings remain far from normal.
...
Even once the FOMC begins to normalize, Bullard emphasized, this will still mean a very accommodative policy stance. “Policy will remain exceptionally accommodative through the medium term no matter how the Committee proceeds,” he said. “This means there will continue to be upward pressure on inflation and downward pressure on unemployment.”
I thought it was likely that the FOMC would hike rates in September, mainly because several FOMC members said they'd hike rates if the economy evolved as expected (the revisions to the projections mostly suggest a better than expected economy!).
However, I think the risks are asymmetrical (better to hike later than too soon) and there is little risk from inflation, and that argues for a little more patience.
Schedule for Week of September 20, 2015
by Calculated Risk on 9/19/2015 08:15:00 AM
The key reports this week are August New Home sales on Thursday, the third estimate of Q2 GDP, also on Thursday, and August existing home sales on Monday.
There will be a focus on Fed Chair Dr. Yellen's speech on Thursday.
 10:00 AM: Existing Home Sales for August from the National Association of Realtors (NAR). The consensus is for 5.50 million SAAR, down from 5.59 million in July.
 Sales in July were at a 5.59 million SAAR. Economist Tom Lawler estimates the NAR will report sales of 5.54 million SAAR.
A key will be the reported year-over-year change in inventory of homes for sale.
9:00 AM: FHFA House Price Index for July 2015. This was originally a GSE only repeat sales, however there is also an expanded index. The consensus is for a 0.4% month-to-month increase for this index.
10:00 AM: Richmond Fed Survey of Manufacturing Activity for September.
7:00 AM: The Mortgage Bankers Association (MBA) will release the results for the mortgage purchase applications index.
During the day: The AIA's Architecture Billings Index for August (a leading indicator for commercial real estate).
8:30 AM: The initial weekly unemployment claims report will be released. The consensus is for 275 thousand initial claims, up from 264 thousand the previous week.
8:30 AM: Durable Goods Orders for August from the Census Bureau. The consensus is for a 2.2% decrease in durable goods orders.
8:30 AM ET: Chicago Fed National Activity Index for August. This is a composite index of other data.
 10:00 AM: New Home Sales for August from the Census Bureau.
 This graph shows New Home Sales since 1963. The dashed line is the July sales rate.
The consensus is for an increase in sales to 515 thousand Seasonally Adjusted Annual Rate (SAAR) in August from 507 thousand in July.
11:00 AM: the Kansas City Fed manufacturing survey for August.
5:00 PM: Speech by Fed Chair Janet Yellen, "Inflation Dynamics and Monetary Policy", At the University of Massachusetts Amherst, Amherst, Massachusetts
8:30 AM: Gross Domestic Product, 2nd quarter 2015 (third estimate). The consensus is that real GDP increased 3.7% annualized in Q2, the same as the second estimate.
10:00 AM: University of Michigan's Consumer sentiment index (final for September). The consensus is for a reading of 87.1, up from the preliminary reading of 85.7.
Friday, September 18, 2015
Mortgage Equity Withdrawal Slightly Negative in Q2 2015
by Calculated Risk on 9/18/2015 02:17:00 PM
Note: This is not Mortgage Equity Withdrawal (MEW) data from the Fed. The last MEW data from Fed economist Dr. Kennedy was for Q4 2008.
The following data is calculated from the Fed's Flow of Funds data (released today) and the BEA supplement data on single family structure investment. This is an aggregate number, and is a combination of homeowners extracting equity - hence the name "MEW", but there is still little (but increasing) MEW right now - and normal principal payments and debt cancellation (modifications, short sales, and foreclosures).
For Q2 2015, the Net Equity Extraction was minus $4 billion, or a negative 0.1% of Disposable Personal Income (DPI) - only slightly negative.
 Click on graph for larger image.
This graph shows the net equity extraction, or mortgage equity withdrawal (MEW), results, using the Flow of Funds (and BEA data) compared to the Kennedy-Greenspan method.
There might be a little actual MEW right now, however this data is heavily impacted by debt cancellation and foreclosures.
The Fed's Flow of Funds report showed that the amount of mortgage debt outstanding increased by $38 billion in Q2.
The Flow of Funds report also showed that Mortgage debt has declined by almost $1.3 trillion since the peak. This decline is mostly because of debt cancellation per foreclosures and short sales, and some from modifications. There has also been some reduction in mortgage debt as homeowners paid down their mortgages so they could refinance.
With residential investment increasing, and a slower rate of debt cancellation, it is possible that MEW will turn positive again soon.
For reference:
Dr. James Kennedy also has a simple method for calculating equity extraction: "A Simple Method for Estimating Gross Equity Extracted from Housing Wealth". Here is a companion spread sheet (the above uses my simple method).
For those interested in the last Kennedy data included in the graph, the spreadsheet from the Fed is available here.
Fed's Flow of Funds: Household Net Worth at Record High at end of Q2
by Calculated Risk on 9/18/2015 12:28:00 PM
The Federal Reserve released the Q2 2015 Flow of Funds report today: Flow of Funds.
According to the Fed, household net worth increased in Q2 compared to Q1:
The net worth of households and nonprofits rose to $85.7 trillion during the second quarter of 2015. The value of directly and indirectly held corporate equities increased $61 billion and the value of real estate rose $499 billion.Household net worth was at $85.7 trillion in Q2 2015, up from $85.0 billion in Q1. Net worth will probably decline in Q3 due to the decline in the stock market..
The Fed estimated that the value of household real estate increased to $21.5 trillion in Q2 2015. The value of household real estate is still $1.0 trillion below the peak in early 2006 (not adjusted for inflation).
 Click on graph for larger image.
The first graph shows Households and Nonprofit net worth as a percent of GDP. Household net worth, as a percent of GDP, is higher than the peak in 2006 (housing bubble), and above the stock bubble peak.
This includes real estate and financial assets (stocks, bonds, pension reserves, deposits, etc) net of liabilities (mostly mortgages). Note that this does NOT include public debt obligations.
This ratio was increasing gradually since the mid-70s, and then we saw the stock market and housing bubbles.
 This graph shows homeowner percent equity since 1952.
 Household percent equity (as measured by the Fed) collapsed when house prices fell sharply in 2007 and 2008.
In Q2 2015, household percent equity (of household real estate) was at 56.3% - up from Q1, and the highest since Q3 2006. This was because of an increase in house prices in Q2 (the Fed uses CoreLogic).
Note: about 30.3% of owner occupied households had no mortgage debt as of April 2010. So the approximately 50+ million households with mortgages have far less than 56.3% equity - and several million still have negative equity.
 The third graph shows household real estate assets and mortgage debt as a percent of GDP.
 Mortgage debt increased by $38 billion in Q2.
Mortgage debt has declined by $1.26 trillion from the peak. Studies suggest most of the decline in debt has been because of foreclosures (or short sales), but some of the decline is from homeowners paying down debt (sometimes so they can refinance at better rates).
The value of real estate, as a percent of GDP, was up in Q2, and somewhat above the average of the last 30 years (excluding bubble).
BLS: Twenty-Nine States had Unemployment Rate Decreases in August
by Calculated Risk on 9/18/2015 10:12:00 AM
From the BLS: Regional and State Employment and Unemployment Summary
Regional and state unemployment rates were little changed in August. Twenty-nine states had unemployment rate decreases from July, 10 states had increases, and 11 states and the District of Columbia had no change, the U.S. Bureau of Labor Statistics reported today.
...
Nebraska had the lowest jobless rate in August, 2.8 percent, followed by North Dakota, 2.9 percent. West Virginia had the highest rate, 7.6 percent.
 Click on graph for larger image.
This graph shows the current unemployment rate for each state (red), and the max during the recession (blue). All states are well below the maximum unemployment rate for the recession.
The size of the blue bar indicates the amount of improvement. The yellow squares are the lowest unemployment rate per state since 1976.
The states are ranked by the highest current unemployment rate. West Virginia, at 7.6%, had the highest state unemployment rate.
 The second graph shows the number of states (and D.C.) with unemployment rates at or above certain levels since January 2006. At the worst of the employment recession, there were 10 states with an unemployment rate at or above 11% (red).
Currently no state has an unemployment rate at or above 8% (light blue); Only one state (West Virginia) was at or above 7% (dark blue).
Thursday, September 17, 2015
Mortgage Rates Decline after FOMC Annoucement
by Calculated Risk on 9/17/2015 08:06:00 PM
From Matthew Graham at Mortgage News Daily: Mortgage Rates Drop Sharply After Fed Announcement
While the Fed Funds Rate doesn't directly dictate mortgage rates, the two tend to correlate over time. At its most basic level, the Fed rate dictates the cost of short term money, which has ripple effects that carry through to longer term financing costs, like those associated with things like 10yr Treasury notes and mortgage rates.Friday:
Not only did the Fed forego a rate hike, they were also noticeably more downbeat about inflation and global growth/stability. It's just as likely that these longer-term implications helped longer term rates (like mortgages) do as well as they did today.
All that having been said, the drop in rates merely brings them back in line with last week's best levels. Considering they only rose from there due to Anxiety over today's Fed meeting, it's not unfair to say that rates are still in the same narrow range that's been in effect for more than 2 months. ... several lenders inching back into the high 3's today for conventional 30yr fixed rate quotes ...
• At 10:00 AM ET, Regional and State Employment and Unemployment for August.
• At 12:00 PM, Q2 Flow of Funds Accounts of the United States from the Federal Reserve


