by Calculated Risk on 4/06/2013 10:23:00 AM
Saturday, April 06, 2013
Schedule for Week of April 7th
Note: I'll post a summary of last week soon.
The key report this week is the March retail sales report on Friday.
The FOMC minutes for the March meeting will be released on Wednesday.
Fed Chairman Ben Bernanke will speak on Monday and Friday (several regional Fed presidents will also speak this week).
7:15 PM ET, Speech by Fed Chairman Ben Bernanke, Stress-Testing Banks: What Have We Learned? , At the 2013 Financial Markets Conference, Atlanta, Georgia
7:30 AM ET: NFIB Small Business Optimism Index for March. The consensus is for a decrease to 90.6 from 90.8 in February.
 10:00 AM: Job Openings and Labor Turnover Survey for February from the BLS.
 This graph shows job openings (yellow line), hires (purple), Layoff, Discharges and other (red column), and Quits (light blue column) from the JOLTS.
Jobs openings increased in January to 3.693 million, up from 3.612 million in December. number of job openings (yellow) has generally been trending up, and openings are up 8% year-over-year compared to January 2012.
10:00 AM: Monthly Wholesale Trade: Sales and Inventories for February. The consensus is for a 0.5% increase in inventories.
7:00 AM: The Mortgage Bankers Association (MBA) will release the results for the mortgage purchase applications index.
2:00 PM: FOMC Minutes for Meeting of March 19-20, 2013
8:30 AM: The initial weekly unemployment claims report will be released. The consensus is for claims to decrease to 365 thousand from 385 thousand last week. The "sequester" budget cuts appear to be impacting weekly claims.
8:30 AM: Producer Price Index for March. The consensus is for a 0.2% decrease in producer prices (0.2% increase in core).
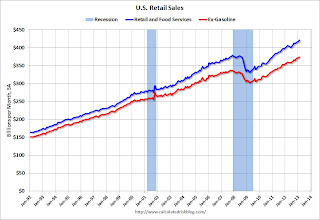 8:30 AM ET: Retail sales for March will be released.
This graph shows monthly retail sales and food service, seasonally adjusted (total and ex-gasoline) through February. Retail sales are up 27.2% from the bottom, and now 11.2% above the pre-recession peak (not inflation adjusted)
The consensus is for retail sales to be unchanged in March (following the large increases in January and February), and to increase 0.1% ex-autos.
9:55 AM: Reuter's/University of Michigan's Consumer sentiment index (preliminary for April). The consensus is for a reading of 79.0, up from 78.6.
10:00 AM: Manufacturing and Trade: Inventories and Sales (business inventories) report for February. The consensus is for a 0.4% increase in inventories.
12:30 PM: Speech by Fed Chairman Ben Bernanke, Creating Resilient Communities, At the 2013 Federal Reserve System Community Development Research Conference, Washington, D.C.
Friday, April 05, 2013
Bank Failure #5 in 2013: Gold Canyon Bank, Gold Canyon, Arizona
by Calculated Risk on 4/05/2013 08:35:00 PM
From the FDIC: First Scottsdale Bank, National Association, Scottsdale, Arizona, Assumes All of the Deposits of Gold Canyon Bank, Gold Canyon, Arizona
As of December 31, 2012, Gold Canyon Bank had approximately $45.2 million in total assets and $44.2 million in total deposits. ... The FDIC estimates that the cost to the Deposit Insurance Fund (DIF) will be $11.2 million. ... Gold Canyon Bank is the fifth FDIC-insured institution to fail in the nation this year, and the first in Arizona.Hmmm ... someone make a joke about Gold ...
Earlier on the employment report:
• March Employment Report: 88,000 Jobs, 7.6% Unemployment Rate
• Employment Report Comments and more Graphs
• All Employment Graphs
AAR: Rail Traffic "mixed" in March
by Calculated Risk on 4/05/2013 04:30:00 PM
From the Association of American Railroads (AAR): AAR Reports Mixed Rail Traffic for March, Declines for Week Ending March 30
Intermodal traffic in March 2013 totaled 933,208 containers and trailers, up 0.5 percent (4,859 units) compared with March 2012. That percentage increase represents the smallest year-over-year monthly gain for intermodal since August 2011.
Carloads originated in March 2013 totaled 1,117,427, down 0.5 percent (5,969 carloads) compared with the same month last year. While it was a decline, March had the lowest year-over-year monthly dip in carloads since January of 2012. Carloads excluding coal and grain were up 3.4 percent (19,965 carloads) in March 2013 over March 2012.
“U.S. rail traffic continues to mirror the overall economy: not great, not terrible, anticipating a better future,” said AAR Senior Vice President John T. Gray. “Petroleum and petroleum products continues to lead traffic gains, while coal and grain have seen better days. Intermodal volume in March was up just 0.5 percent over last year, but it was still the highest-volume March in history and built on even stronger gains earlier in the quarter.”
emphasis added
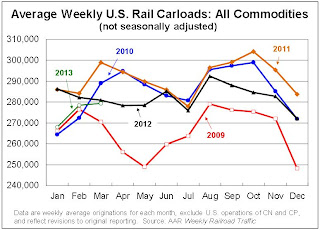 Click on graph for larger image.
This graph from the Rail Time Indicators report shows U.S. average weekly rail carloads (NSA). Green is 2013.
Commodities with the biggest carload increases in March included petroleum and petroleum products, up 54.3 percent or 19,295 carloads; crushed stone, gravel and sand, up 11.9 percent or 8,380 carloads; motor vehicles and parts, up 6.1 percent or 4,127 carloads; and coke, up 11.4 percent or 1,550 carloads. Commodities with carload declines last month included grain, down 20.1 percent or 16,971 carloads; coal, down 2 percent or 8,963 carloads; metallic ores, down 13.2 percent or 2,908 carloads; and chemicals, down 1.3 percent or 1,581 carloads.Note that building related commodities were up.
The second graph is for intermodal traffic (using intermodal or shipping containers):
 Graphs and excerpts reprinted with permission.
Intermodal traffic was weaker in March, but still on track for a record year in 2013:
After a stellar February, U.S. intermodal traffic came back to earth in March. U.S. railroads originated 933,208 containers and trailers in March 2013, up just 0.5% (4,859 units) over March 2012. (The comparable numbers were 10.5% and 93,231 units in February.) That’s the smallest year-over-year monthly increase since August 2011. On the other hand, March 2013’s weekly average of 233,302 containers and trailers is the highest average for any March in history.Earlier on the employment report:
• March Employment Report: 88,000 Jobs, 7.6% Unemployment Rate
• Employment Report Comments and more Graphs
• All Employment Graphs
Employment Report Comments and more Graphs
by Calculated Risk on 4/05/2013 01:57:00 PM
The 88 thousand payroll jobs added in March is from the establishment survey (a survey of businesses for payroll jobs), but the unemployment rate is from the household survey. To help understand the decline in the unemployment rate, here is some data from the household survey.
The "Population" is the Civilian Noninstitutional Population, or the number of people 16 and over who are "not inmates of institutions (for example, penal and mental facilities and homes for the aged) and who are not on active duty in the Armed Forces". This is increasing every month, and increased 167 thousand in March.
The Civilian Labor Force is based on the percentage of people who say they are either employed or unemployed. This yields the participation rate (the percentage of the civilian noninstitutional population that is in the labor force). The participation rate has declined recently due to both demographic reasons and the weak recovery from the financial crisis. Separating out the two reasons is difficult, see: Understanding the Decline in the Participation Rate and Further Discussion on Labor Force Participation Rate and Labor Force Participation Rate Update.
If the participation rate increases, then it would take more jobs to reduce the unemployment rate. If the participation rate continues to decline (or just flat lines for a couple of years), then it takes fewer jobs to reduce the unemployment rate.
According to the household survey, the economy lost 206 thousand jobs (the establishment survey is MUCH better for payroll jobs added), and there were 290 thousand fewer people unemployed - so the unemployment rate declined to the lowest level since December 2008. We'd prefer to see the unemployment rate decline because of more jobs, as opposed to less participation.
| Employment Status, Household Data (000s) | |||
|---|---|---|---|
| Feb | Mar | Change | |
| Population | 244,828 | 244,995 | 167 |
| Civilian Labor Force | 155,524 | 155,028 | -496 |
| Participation Rate | 63.52% | 63.28% | -0.24% |
| Employed | 143,492 | 143,286 | -206 |
| Unemployed | 12,032 | 11,742 | -290 |
| Unemployment Rate | 7.74% | 7.57% | -0.17% |
Employment-Population Ratio, 25 to 54 years old
 Click on graph for larger image.
Since the participation rate declined recently due to cyclical (recession) and demographic (aging population) reasons, an important graph is the employment-population ratio for the key working age group: 25 to 54 years old.
In the earlier period the employment-population ratio for this group was trending up as women joined the labor force. The ratio has been mostly moving sideways since the early '90s, with ups and downs related to the business cycle.
This ratio should probably move close to 80% as the economy recovers. The ratio was unchanged at 75.9% in March. The participation rate for this group declined slightly to 81.1%. The decline in the participation rate for this age group is probably mostly due to economic weakness, whereas most of the decline in the overall participation rate is probably due to demographics.
Percent Job Losses During Recessions

This graph shows the job losses from the start of the employment recession, in percentage terms - this time aligned at maximum job losses.
In the earlier post, the graph showed the job losses aligned at the start of the employment recession.
This financial crisis recession was much deeper than other post WWII recessions, and the recovery has been slower (the recovery from the 2001 recession was slow too). However, if we compare to other financial crisis recoveries, this recovery has actually been better than most.
Part Time for Economic Reasons
 From the BLS report:
The number of persons employed part time for economic reasons (sometimes referred to as involuntary part-time workers) fell by 350,000 over the month to 7.6 million. These individuals were working part time because their hours had been cut back or because they were unable to find a full-time job.The number of part time workers decline in March to 7.64 million from 7.99 million in February. This is the few part time for economic reasons since November 2008.
These workers are included in the alternate measure of labor underutilization (U-6) that declined to 13.8% in March. This is the lowest level for U-6 since December 2008.
Unemployed over 26 Weeks
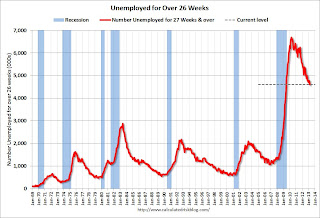 This graph shows the number of workers unemployed for 27 weeks or more.
 According to the BLS, there are 4.61 million workers who have been unemployed for more than 26 weeks and still want a job. This was down from 4.8 million in February. This is trending down, but is still very high. This is the fewest long term unemployed since June 2009. Long term unemployment remains one of the key labor problems in the US.
State and Local Government
 This graph shows total state and government payroll employment since January 2007. State and local governments lost jobs for four straight years. (Note: Scale doesn't start at zero to better show the change.)
 In March 2013, state and local governments added 7,000 jobs and state and local employment has increased 8,000 so far in 2013.
I think most of the state and local government layoffs are over. Of course the Federal government layoffs are ongoing with many more layoffs expected due to the sequestration spending cuts.
Overall this was a weak report, but there were a few positives including the upward revisions to the January and February reports, the decline in the long term unemployed, and the decline in part time workers to list a few.
Trade Deficit declined in February to $43 Billion
by Calculated Risk on 4/05/2013 10:55:00 AM
Note: I'll have more on the employment report soon.
The Department of Commerce reported:
[T]otal February exports of $186.0 billion and imports of $228.9 billion resulted in a goods and services deficit of $43.0 billion, down from $44.5 billion in January, revised. February exports were $1.6 billion more than January exports of $184.4 billion. February imports were $0.1 billion more than January imports of $228.9 billion.The trade deficit was below the consensus forecast of $44.8 billion.
The first graph shows the monthly U.S. exports and imports in dollars through January 2013.
 Click on graph for larger image.
Exports increased in February, and imports were essentially flat, so the deficit declined.
Exports are 12% above the pre-recession peak and up 3.2% compared to February 2012; imports are slightly below the pre-recession peak, and up 2% compared to February 2012.
The second graph shows the U.S. trade deficit, with and without petroleum, through February.
 The blue line is the total deficit, and the black line is the petroleum deficit, and the red line is the trade deficit ex-petroleum products.
The decrease in the trade deficit in February was mostly due to a decrease in the volume of petroleum imports.
Oil averaged $95.96 per barrel in February, up from $94.08 in January, but down from $103.63 in February 2012.
The trade deficit with China increased to $23.4 billion in February, up from $19.4 billion in February 2012. Most of the trade deficit is still due to oil and China.
The trade deficit with the euro area was $8.1 billion in January, up from $5.8 billion in February 2012. This is another sign of weakness in the euro area.
March Employment Report: 88,000 Jobs, 7.6% Unemployment Rate
by Calculated Risk on 4/05/2013 08:30:00 AM
From the BLS:
Nonfarm payroll employment edged up in March (+88,000), and the unemployment rate was little changed at 7.6 percent, the U.S. Bureau of Labor Statistics reported today. ...The headline number was well below expectations of 193,000 payroll jobs added. However employment for January and February were revised higher.
...
The change in total nonfarm payroll employment for January was revised from +119,000 to +148,000, and the change for February was revised from +236,000 to +268,000.
 Click on graph for larger image.
NOTE: This graph is ex-Census meaning the impact of the decennial Census temporary hires and layoffs is removed to show the underlying payroll changes.
The second graph shows the unemployment rate.
The unemployment rate decreased to 7.6% from 7.7% in February.
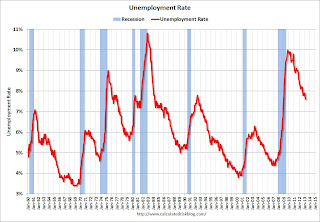 The unemployment rate is from the household report and the household report showed a sharp decline in the labor force - and that meant a lower unemployment rate.
The labor force (household survey) declined from 155.524 million to 155.028 million - a decline of 496 thousand.
The third graph shows the employment population ratio and the participation rate.
The Labor Force Participation Rate decreased to 63.3% in March (blue line). This is the percentage of the working age population in the labor force.
 The participation rate is well below the 66% to 67% rate that was normal over the last 20 years, although a significant portion of the recent decline is due to demographics.
The Employment-Population ratio was also declined to 58.5% in March (black line). I'll post the 25 to 54 age group employment-population ratio graph later.
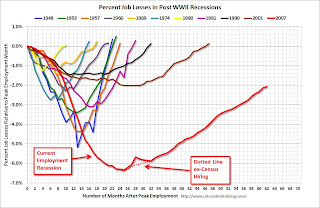 The fourth graph shows the job losses from the start of the employment recession, in percentage terms, compared to previous post WWII recessions. The dotted line is ex-Census hiring.
This shows the depth of the recent employment recession - worse than any other post-war recession - and the relatively slow recovery due to the lingering effects of the housing bust and financial crisis.
This was a disappointing employment report and worse than expectations. I'll have much more later ...
Thursday, April 04, 2013
Friday: Employment Report, Trade Deficit
by Calculated Risk on 4/04/2013 09:06:00 PM
First, from CNBC: Nikkei Surges Past 13,000 on BOJ Surprise
Japan's benchmark Nikkei index traded nearly 4 percent higher on Friday while the yen plunged to a three-and-a-half-year low against the greenback ... The BOJ's shock therapy program to meet its 2 percent inflation target includes doubling the monetary base and purchasing long-dated government bonds. It plans to inject $1.4 trillion into the economy in less than two years.And from the WSJ: Money Spigot Opens Wider
The Bank of Japan's new leaders delivered on their pledge to radically overhaul its strategy to revive Japan's economy, unveiling a package of easy-money policies Thursday so aggressive in scale and tactics that it surprised investors.Friday economic releases:
... "This is an entirely new dimension of monetary easing, both in terms of quantity and quality,'' the Bank of Japan's new governor, Haruhiko Kuroda, said Thursday. The BOJ said the programs would continue at least two years.
The strategy seeks to broadly change Japanese behavior and attitudes that have contributed to depressed spending, wages and prices over the past two decades.
"I will not use my fighting power in an incremental manner," Mr. Kuroda said at a news conference following the central bank's two-day meeting. "Our stance is to take all the policy measures imaginable at this point to achieve the 2% target in two years."
• 8:30 AM ET, the Employment Report for March will be released. The consensus is for an increase of 193,000 non-farm payroll jobs in March; the economy added 236,000 non-farm payroll jobs in February. The consensus is for the unemployment rate to be unchanged at 7.7% in March.
• Also at 8:30 AM, Trade Balance report for February from the Census Bureau. The consensus is for the U.S. trade deficit to increase to $44.8 billion in February from $44.4 billion in January.
• At 3:00 PM, Consumer Credit for February from the Federal Reserve. The consensus is for credit to increase $16.0 billion in February.
Fed's Yellen: Communication in Monetary Policy
by Calculated Risk on 4/04/2013 05:55:00 PM
Fed Vice Chair Janet Yellen gave an overview about the importance of communication in monetary policy today: Communication in Monetary Policy. Here are a few excerpts related to the eventual exit plan:
The Federal Reserve's ongoing asset purchases continually add to the accommodation that the Federal Reserve is providing to help strengthen the economy. An end to those purchases means that the FOMC has ceased augmenting that support, not that it is withdrawing accommodation. When and how to begin actually removing the significant accommodation provided by the Federal Reserve's large holdings of longer-term securities is a separate matter. In its March statement, the FOMC reaffirmed its expectation that a highly accommodative stance of monetary policy will remain appropriate for a considerable time after the current asset purchase program ends and the economic recovery has strengthened. Accordingly, there will likely be a substantial period after asset purchases conclude but before the FOMC starts removing accommodation by reducing asset holdings or raising the federal funds rate.Here are the "exit principles" that Yellen discussed from the June 2011 minutes: Exit Strategy Principles.
To guide expectations concerning the process of normalizing the size and composition of the Federal Reserve's balance sheet, at its June 2011 meeting, the FOMC laid out what it called "exit principles." [Note: see below for "exit principles"] In these principles, the FOMC indicated that asset sales would likely follow liftoff of the federal funds rate. It also noted that, in order to minimize the risk of market disruption, the pace of asset sales during this process could be adjusted up or down in response to changes in either the economic outlook or financial conditions. For example, changes in the pace or timing of asset sales might be warranted by concerns over market functioning or excessive volatility in bond markets. While normalization of the Federal Reserve's portfolio is still well in the future, the FOMC is committed to clear communication about the likely path of the balance sheet.
There will come a time when the FOMC begins the process of returning the federal funds rate to a more normal level. In their individual projections submitted for the March FOMC meeting, 13 of the 19 FOMC participants saw the first increase in the target for the federal funds rate as most likely to occur in 2015, and another expected it to occur in 2016. But the course of the economy is uncertain, and the Committee added the thresholds for unemployment and inflation, in part, to help guide the public if economic developments warrant liftoff sooner or later than expected. As the time of the first increase in the federal funds rate moves closer, in my view it will be increasingly important for the Committee to clearly communicate about how the federal funds rate target will be adjusted.
emphasis added
Employment Situation Preview
by Calculated Risk on 4/04/2013 02:13:00 PM
On Friday, at 8:30 AM ET, the BLS will release the employment report for March. The consensus is for an increase of 193,000 non-farm payroll jobs in March, and for the unemployment rate to be unchanged at 7.7%.
Here is a summary of recent data:
• The ADP employment report showed an increase of 158,000 private sector payroll jobs in March. This was below expectations of 205,000 private sector payroll jobs added. The ADP report hasn't been very useful in predicting the BLS report for any one month, although the methodology changed last year. In general this suggests employment growth below expectations.
• The ISM manufacturing employment index increased in March to 54.2%, up from 52.6% in February. A historical correlation between the ISM manufacturing employment index and the BLS employment report for manufacturing, suggests that private sector BLS reported payroll jobs for manufacturing increased by a few thousand in March.
The ISM non-manufacturing (service) employment index decreased in March to 53.3%, down from 57.2% in February. A historical correlation between the ISM non-manufacturing employment index and the BLS employment report for services, suggests that private sector BLS reported payroll jobs for services increased almost 150,000 in March.
Added together, the ISM reports suggests about 150,000 jobs added in March.
• Initial weekly unemployment claims averaged about 354,000 in March. This was about the same as in February.
For the BLS reference week (includes the 12th of the month), initial claims were at 341,000; down from 366,000 in February. The recent increase in claims (probably due to the sequestration budget cuts) was probably before the reference week (when the BLS conducts the employment surveys).
• The final February Reuters / University of Michigan consumer sentiment index increased to 78.6, up from the February reading of 77.6. This is frequently coincident with changes in the labor market and stock market, but also strongly related to gasoline prices and other factors. This might suggest a stronger employment report, but the level still suggests a weak labor market. Note: the preliminary index dipped suggests some weakness mid-month.
• The small business index from Intuit showed 10,000 payroll jobs added, the same as in February. This index remains disappointing.
• And on the unemployment rate from Gallup: Seasonally Unadjusted Unemployment Unchanged in March
Gallup's unadjusted unemployment rate for the U.S. workforce was 8.0% for the month of March, the same as in February, but a modest improvement from 8.4% in March 2012.Note: So far the Gallup numbers haven't been very useful in predicting the BLS unemployment rate.
Gallup's seasonally adjusted U.S. unemployment rate for March was 7.8%, a slight uptick from 7.6% in February, but down since March 2012.
• Conclusion: The employment related data was mixed in March. The ADP and ISM reports suggest a decrease in hiring, the small business index was weak, but weekly claims for the reference week were lower in March than in February when the BLS reported 236,000 payroll jobs were added. There is always some randomness to the employment report, but my guess is the BLS will report somewhat below the consensus of 193,000 jobs added in March.
Reis: Mall Vacancy Rate declines in Q1
by Calculated Risk on 4/04/2013 12:02:00 PM
Reis reported that the vacancy rate for regional malls declined to 8.3% in Q1, down from 8.6% in Q4 2012. This is down from a cycle peak of 9.4% in Q3 2011.
For Neighborhood and Community malls (strip malls), the vacancy rate declined slightly to 10.6% in Q1, down from 10.7% in Q4 2012. For strip malls, the vacancy rate peaked at 11.1% in Q3 2011.
Comments from Reis Senior Economist Ryan Severino:
[Strip Malls] Yet again, vacancy declined by only 10 bps during the first quarter. Although it is welcome that vacancy continues to decline on an almost quarterly basis, there is still no acceleration in vacancy compression. On a year‐over‐year basis, the vacancy rate declined by only 30 bps. Net absorption continues to outpace new construction, marginally pushing vacancy rates downward. With only 873,000 square feet delivered, even moderate demand for space would result in meaningful declines in the national vacancy rate. Yet despite the dearth of new completions, demand remains insufficient to make a meaningful dent in what is still an elevated vacancy rate.
...
[New construction] With retail sales struggling to recover and muted demand for space, new construction remained near record‐low levels during the quarter. 873,000 square feet were delivered during the first quarter, versus 1.231 million square feet during the fourth quarter. However, this is a slowdown compared to the 2.051 million square feet of retail space that were delivered during the first quarter of 2012. In fact, 873,000 square feet is the fourth‐lowest figure on record since Reis began tracking quarterly data in 1999. With demand for space remaining at abject levels, there exists virtually no incentive to develop new projects. 873,000 square feet is the equivalent of one or two medium‐sized properties.
...
[Regional] Once again, malls outperformed their neighborhood and community shopping center brethren. The national vacancy rate declined by another 30 basis points during the quarter. This is the sixth consecutive quarter with a vacancy decline. Asking rent growth accelerated versus last quarter, growing by another 0.4%. This was the eighth consecutive quarter of asking rent increases. The improvement in mall subsector picked up some pace during the first quarter. The thirty basis point compression in vacancy is the largest since the first quarter of 2003 and the 0.4% asking rent increase is the largest since the first quarter of 2008. However, as we have stated in quarters past, the recovery in the mall subsector is being driven by Dominant/Class A malls, which typically boast luxury retailers and cater to affluent consumers. This belies the fact that the remainder of the mall sector continues to struggle.
 Click on graph for larger image.
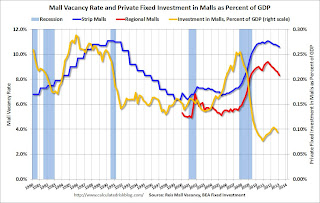
This graph shows the strip mall vacancy rate starting in 1980 (prior to 2000 the data is annual). The regional mall data starts in 2000. Back in the '80s, there was overbuilding in the mall sector even as the vacancy rate was rising. This was due to the very loose commercial lending that led to the S&L crisis.
In the mid-'00s, mall investment picked up as mall builders followed the "roof tops" of the residential boom (more loose lending). This led to the vacancy rate moving higher even before the recession started. Then there was a sharp increase in the vacancy rate during the recession and financial crisis.
The yellow line shows mall investment as a percent of GDP through Q4. This has increased from the bottom because this includes renovations and improvements. New mall investment has essentially stopped.
The good news is, as Severino noted, new square footage is near a record low, and with very little new supply, the vacancy rate will probably continue to decline slowly.
Mall vacancy data courtesy of Reis.


