 RSS Feed
 by Calculated Risk on 12/22/2011 08:30:00 AM
Thursday, December 22, 2011
Weekly Initial Unemployment Claims decline to 364,000
The DOL reports:
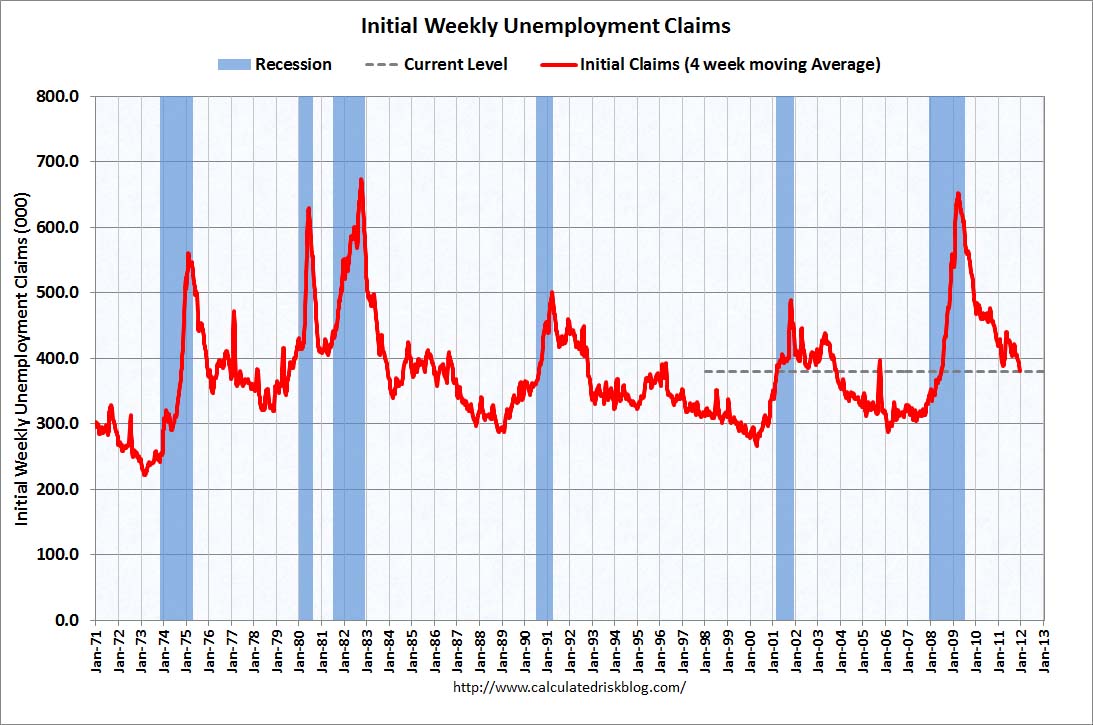
In the week ending December 17, the advance figure for seasonally adjusted initial claims was 364,000, a decrease of 4,000 from the previous week's revised figure of 368,000. The 4-week moving average was 380,250, a decrease of 8,000 from the previous week's revised average of 388,250.The following graph shows the 4-week moving average of weekly claims since January 2000.
 Click on graph for larger image.
The dashed line on the graph is the current 4-week average. The four-week average of weekly unemployment claims decreased this week to 380,250.
This is the lowest level for weekly claims - and the lowest level for the 4-week average - since early 2008.
And here is a long term graph of weekly claims:
 This survey was for the BLS reference week for the employment report, so this suggests an increase in payroll jobs in December (compared to November).
 This was below the consensus forecast of 380,000 initial claims.
Wednesday, December 21, 2011
ATA Trucking Index increased 0.3% in November
by Calculated Risk on 12/21/2011 10:11:00 PM
From ATA: ATA Truck Tonnage Index Edged 0.3% Higher in November
The American Trucking Associations’ advance seasonally adjusted (SA) For-Hire Truck Tonnage Index increased 0.3% in November after rising a revised 0.4% in October 2011. October’s increase was slightly less than the 0.5% gain ATA reported on November 22, 2011. The latest gain put the SA index at 116.6 (2000=100) in November, up from the October level of 116.3.
...
Compared with November 2010, SA tonnage was up 6.0%, the largest year-over-year gain since a 6.5% increase in June 2011.
...
“Over the last three months, tonnage is up 2.3% and stands at the highest level since January of this year.” [ATA Chief Economist Bob Costello said], “Two primary factors have helped truck tonnage in recent months. First, manufacturing output, which generates a significant amount of truck freight, has generally been increasing. Second, retail inventories are very lean, which is helping freight as well since retailers don’t have much excess stock and need to replenish when sales go up.”
 Click on graph for larger image.
Here is a long term graph that shows ATA's For-Hire Truck Tonnage index.
The dashed line is the current level of the index. This index has started increasing again after stalling earlier this year.
Earlier:
• Existing Home Sales in November: 4.42 million SAAR, 7.0 months of supply
• Existing Home Sales Revisions
• CoreLogic: Existing Home Shadow Inventory remains at 1.6 million units
• Existing Home Sales graphs
Lawler: The NAR “benchmark revision story” is not over!
by Calculated Risk on 12/21/2011 06:13:00 PM
NOTE: Large tables are here in excel.
From housing economist Tom Lawler on the NAR revisions:
Seasonally Adjusted Existing Home Sales Up 4% in November; Benchmark Revisions Reduce 2007-10 Sales by 14.3%; Regional Revisions Seem “Funny,” Suggest Issues with Past Data as Well
The National Association of Realtors estimated that US existing home sales ran at a seasonally adjusted annual rate of 4.42 million in November, a figure that reflected that NAR’s long-awaited “benchmark” downward revisions in sales for 2007 through 2010. November’s revised sales pace was up 4% on a SA basis from October’s pace, and was pretty close to my estimate incorporating revisions. The NAR also reported that its estimate of the inventory of existing homes for sale at the end of November was 2.580 million, an estimate that also reflected benchmark revisions (the NAR had previously noted that it was not revising its “months’ supply” measure, and as a result inventories would be revised down by the same % as sales). The November inventory estimate was down 5.8% from October (vs. my projection of a 5% drop); down 18.1% from a year ago; and the lowest inventory level since the spring of 2005.
November’s median existing home sales price in November was $164,200, down 3.5% from last November, while the median existing home sales price was $164,100, down 4.0% from a year ago. This YOY decline was just a tad smaller than I had projected. As previously reported, the NAR did not revise historical median sales prices (save for October 2011).
As I had expected, the NAR used data from the American Community Survey (and from the American Housing Survey) to “guesstimate” home sales, rather than using actual property records – in large part because the latter are either not available in many parts of the country, or the data quality are poor. The NAR did note, however, that “an increasing use of public records data may be appropriate in the future,” which is absolutely the case.
The NAR released revisions to annual sales, monthly seasonally adjusted sales, and monthly unadjusted sales. However, the annual revised sales reported don’t match the sum of unadjusted monthly sales, and because of rounding the sum of SF sales and condo sales does not match total sales in every year. As a result, I am going to report the “revised” sales as the sum of unadjusted sales estimates.
For the nation as a whole, existing home sales were as follows:
| Revised | Previous | % Change | |
|---|---|---|---|
| 2007 | 5,022,000 | 5,652,000 | -11.1% |
| 2008 | 4,124,000 | 4,913,000 | -16.1% |
| 2009 | 4,334,000 | 5,156,000 | -15.9% |
| 2010 | 4,182,000 | 4,907,000 | -14.8% |
At first glance these “national” numbers don’t appear that far off from other estimates based on property records, “grossing up” the totals to reflect geographic coverage.
However, the revisions in existing home sales by broad region suggest that something “looks funny,” and/or that data prior to 2006 in some regions need to be revised as well.
See Table 2 in Excel file
Huh? Sales in the Northeast were revised down by a TON more than any other region, while sales in the West were revised down by a TON less! That seems “sorta weird,” IF the reasons for the revisions were as the NAR suggested. The modest revisions in the West were especially surprising, given that property records data in California – which are comprehensive and of good quality – suggested that the NAR’s estimate of California existing home sales in, say, 2008 was off by more than 20%!
To be sure, there was evidence of NAR sales “over-estimates” in one major Northeast state – Massachusetts – with the “overstatements” date back to at least 2000. Here, e.g., is an excerpt from the September 23, 2009 LEHC report.
Three Measures of Home Sales in Massachusetts
Below is a chart showing annual data on various measures of home sales in Massachusetts. NAR is the National Association of Realtors estimate of existing home sales (single family plus condos/coops); MAR is the Massachusetts Association of Realtors tally of homes (single family plus condo/coop) sold by member realtors; and TWG is The Warren Group’s tally of new and existing homes sold (single family and condo/coop) based on deeds recorded in the state. TWG only includes “arms-length” transactions, and does NOT include a transaction where a lender takes over a foreclosed property – but it DOES include subsequent sales of REO to third parties.
 Click on graph for larger image.
Inquiring minds want to know (1) why is the NAR number so high? (and the answer may data back to the “benchmarking” process for 1999); (2) is it REALLY true (based on the NAR figures) that realtors only partake in 50% of Massachusetts home sales?; and (3) if sales through MLS have risen relative to total sales (as data in a number of states suggest over the last few years), have the NAR’s estimates of existing home sales been overstating actual sales? (The NAR’s estimate for total existing home sales is based on sales data from a sample of realtor associations/Boards/MLS.).
And on how to answer the home sales question on Mass ... let us pray.
So ... property records data had for over a decade suggested that the NAR’s estimate of existing home sales in Massachusetts, and that the NAR’s PREVIOUS benchmarking methodology, especially for condo sales, might be to blame. So maybe the sharp downward revision in Northeast sales is sorta appropriate – but the data also suggest needed downward revisions in past years as well.
And speaking of condos vs. SF, [in Table 3] are the benchmark revisions for existing SF and existing condo sales, both total and by region.
See Table 3 in excel file.
Holy smoke, condo sales in the Northeast were revised down by over 50% --- FIFTY PERCENT – in each of the last four years, while condo sales in the West were revised UP a boatload!
Now if the 2007 revisions were really reasonable by region, AND if data prior to 2006 by region were “just fine,” here is what 2006 vs. 2007 sales would look like by region.
See table 4.
So … the plunge in home sales in 2007 was not only heavily concentrated in the Northeast, but condo sales in the Northeast in 2007 fell by almost 58% from 2006, while condo sales in the West JUMPED by about 33%? I don’t THINK so!
Clearly, the methodology using ACS data for owner-occupied SF sales and combined ACS and AHS data for condo sales and investor/vacant home sales, produced massively different revisions by regions and by housing type that don’t “smell” right – especially for condo sales.
Of course, this doesn’t mean they are “off” per se; the old benchmarking methodology seemed especially “iffy” for SF and condo/co-op investor/vacant home sales, as does the current methodology.
So ... while the NATIONAL existing home sales estimates prior to 2007 don’t seem far off from national estimates based on grossed-up property records, the regional data seems to suggest that a time series using the “old” data prior to 2006 and the “revised” data from 2007 to 2011 has some “issues.”
What would be most useful would be for the NAR to release its revised existing home sales estimates BY STATE, so that folks could compare the NAR’s estimate for states where solid property records data exist TO the property records data for those states, as well as compare the “old” 2006 data to the “revised” 2007 data.
Clearly, the “benchmark revision story” is not over!
Earlier:
• Existing Home Sales in November: 4.42 million SAAR, 7.0 months of supply
• Existing Home Sales Revisions
• CoreLogic: Existing Home Shadow Inventory remains at 1.6 million units
• Existing Home Sales graphs
Impact of NAR Revisions on GDP
by Calculated Risk on 12/21/2011 03:48:00 PM
The NAR mentioned today:
For the total period of 2007 through 2010, sales and inventory were downwardly revised by 14.3 percent. The revisions are expected to have a minor impact on future revisions to Gross Domestic Product.Several readers have asked about the impact on GDP. The answer is very little.
When a previously occupied home is sold, nothing is "produced" except some commissions and fees. So the only significant contribution to GDP is the brokers' commissions. Since the BEA uses the NAR existing home sales report to estimate brokers' commissions, commissions will be revised down for 2007 through 2011. Brokers' commissions are a component of Residential Investment.
The following table shows an estimate of these downward revisions. As an example, brokers' commissions in 2007 will be revised down to $76.9 billion from $86.6 billion, and Residential Investment and GDP will be revised down by the same amount (my estimate)
But real GDP annualized growth will mostly be unchanged for the last several years. Since GDP growth is the change from one period to the next, the most impact will come to years with the largest changes in the NAR revisions (from 2006 to 2007). It is possible 2007 will be revised down slightly. There will be no change to real GDP growth in 2011.
| Impact of NAR revisions on GDP (Billions) | ||||||
|---|---|---|---|---|---|---|
| 2006 | 2007 | 2008 | 2009 | 2010 | 2011 | |
| NAR Downward Revision | 0 | -11.1% | -15.5% | -16.0% | -14.6% | -14.4% |
| Brokers' commissions on sale of structures | 101.5 | 86.6 | 66.9 | 58.6 | 55.2 | |
| Revised, Brokers' commissions | 101.5 | 76.9 | 56.5 | 49.2 | 47.1 | |
| Residential Investment | 761.9 | 628.7 | 472.4 | 354.7 | 338.1 | |
| Revised, Residential Investment | 761.9 | 619.1 | 462.0 | 345.3 | 330.0 | |
| Gross domestic product | 13,377.2 | 14,028.7 | 14,291.5 | 13,939 | 14,526.5 | |
| Revised, GDP | 13,377.2 | 14,019.1 | 14,281.1 | 13,929.6 | 14,518.4 | |
| GDP Real Growth Rate | 2.7% | 1.9% | -0.3% | -3.5% | 3.0% | |
| Revised, GDP Real Growth Rate | 2.7% | 1.8% | -0.3% | -3.5% | 3.0% | |
Earlier:
• Existing Home Sales in November: 4.42 million SAAR, 7.0 months of supply
• Existing Home Sales Revisions
• CoreLogic: Existing Home Shadow Inventory remains at 1.6 million units
• Existing Home Sales graphs
AIA: Architecture Billings Index increased in November
by Calculated Risk on 12/21/2011 01:52:00 PM
Note: This index is a leading indicator for new Commercial Real Estate (CRE) investment.
From AIA: Architecture Billings Climbs into Positive Territory for First Time in Four Months
Continuing the positive momentum of a nearly three point bump in October, the Architecture Billings Index (ABI) reached its first positive mark since August. As a leading economic indicator of construction activity, the ABI reflects the approximate nine to twelve month lag time between architecture billings and construction spending. The American Institute of Architects (AIA) reported the November ABI score was 52.0, following a score of 49.4 in October. This score reflects an overall increase in demand for design services (any score above 50 indicates an increase in billings). The new projects inquiry index was 65.0, up dramatically from a reading of 57.3 the previous month.
“This is a heartening development for the design and construction industry that only a few years ago accounted for nearly ten percent of overall GDP but has fallen to slightly less than six percent,” said AIA Chief Economist, Kermit Baker, PhD, Hon. AIA. “Hopefully, this uptick in billings is a sign that a recovery phase is in the works. However, given the volatility that we’ve seen nationally and internationally recently, we’ll need to see several more months of positive readings before we’ll have much confidence that the U.S. construction recession is ending.”
 Click on graph for larger image.
This graph shows the Architecture Billings Index since 1996. The index increased to 52.0 in November from 49.4 in October. Anything above 50 indicates expansion in demand for architects' services.
Note: This includes commercial and industrial facilities like hotels and office buildings, multi-family residential, as well as schools, hospitals and other institutions.
According to the AIA, there is an "approximate nine to twelve month lag time between architecture billings and construction spending" on non-residential construction. So this suggests further declines in CRE investment in 2012, but perhaps stabilizing later in 2012 - if this doesn't take another dip.
Earlier:
• Existing Home Sales in November: 4.42 million SAAR, 7.0 months of supply
• Existing Home Sales Revisions
• CoreLogic: Existing Home Shadow Inventory remains at 1.6 million units
• Existing Home Sales graphs
Existing Home Sales Revisions
by Calculated Risk on 12/21/2011 11:30:00 AM
The NAR released the benchmark revisions today. From the NAR:
Also released today are benchmark revisions to historic existing-home sales. The 2010 benchmark shows there were 4,190,000 existing-home sales last year, a 14.6 percent revision from the previously projected 4,908,000 sales. For the total period of 2007 through 2010, sales and inventory were downwardly revised by 14.3 percent. The revisions are expected to have a minor impact on future revisions to Gross Domestic Product.The impact on GDP is from a reduction in the estimate for Brokers' commissions on sale of structures. That reduction will be minor.
Here are a couple of graphs to illustrate the revisions:
 Click on graph for larger image in graph gallery.
The first graph shows the revised sales rate (seasonally adjusted annual rate), and the pre-revision sales rate in blue.
The NAR has characterized this as "drift", but this shows a fairly sharp downward revision to 2007 data.
 The second graph shows the revision to inventory.
Inventory has been revised down sharply for years 2007 through 2011. As expected, with the downward revision, inventory is now at late 2005 levels.
The next graph shows inventory by month since 2004. In 2004 (black line), inventory was fairly flat and declined at the end of the year. In 2005 (dark blue line), inventory kept rising all year - and that was a clear sign that the housing bubble was ending.
 With the revisions, inventory in 2011 (dark red) is below the level of November 2005.
The following graph shows existing home sales Not Seasonally Adjusted (NSA).
Of course this doesn't include "shadow inventory". In an earlier release this morning, CoreLogic estimated the shadow inventory as 1.6 million units.
CoreLogic ... reported today that the current residential shadow inventory as of October 2011 remained at 1.6 million units, representing a supply of 5 months.
 The red columns are for 2011.
 Earlier:
• Existing Home Sales in November: 4.42 million SAAR, 7.0 months of supply
• Existing Home Sales graphs
Existing Home Sales in November: 4.42 million SAAR, 7.0 months of supply
by Calculated Risk on 12/21/2011 10:00:00 AM
Note: this includes the downward revisions for years 2007 through 2011.
The NAR reports: Existing-Home Sales Continue to Climb in November
Total existing-home sales, which are completed transactions that include single-family, townhomes, condominiums and co-ops, increased 4.0 percent to a seasonally adjusted annual rate of 4.42 million in November from 4.25 million in October, and are 12.2 percent above the 3.94 million-unit pace in November 2010.
...
Total housing inventory at the end of November fell 5.8 percent to 2.58 million existing homes available for sale, which represents a 7.0-month supply4 at the current sales pace, down from a 7.7-month supply in October.
...
Also released today are benchmark revisions to historic existing-home sales. The 2010 benchmark shows there were 4,190,000 existing-home sales last year, a 14.6 percent revision from the previously projected 4,908,000 sales. For the total period of 2007 through 2010, sales and inventory were downwardly revised by 14.3 percent. The revisions are expected to have a minor impact on future revisions to Gross Domestic Product.
 Click on graph for larger image in graph gallery.
This graph shows existing home sales, on a Seasonally Adjusted Annual Rate (SAAR) basis since 1993.
Sales in November 2011 (4.42 million SAAR) were 4.0% higher than last month, and were 12.2% above the November 2010 rate.
 The second graph shows nationwide inventory for existing homes.
According to the NAR, inventory decreased to 2.58 million in November from 2.74 million in October (revised). This is the lowest level of inventory since July 2005.
The last graph shows the year-over-year (YoY) change in reported existing home inventory and months-of-supply. Since inventory is not seasonally adjusted, it really helps to look at the YoY change. Note: Months-of-supply is based on the seasonally adjusted sales and not seasonally adjusted inventory.
 Inventory decreased 18.1% year-over-year in November from November 2010. This is the ninth consecutive month with a YoY decrease in inventory.
Months of supply decreased to 7.0 months in November, down from 7.7 months in October. This is still a little higher than normal. These sales numbers were right at the Tom Lawler's estimate of 4.4 million.
I'll have much more on the revisions later.
CoreLogic: Existing Home Shadow Inventory remains at 1.6 million units
by Calculated Risk on 12/21/2011 08:20:00 AM
From CoreLogic: CoreLogic® Reports Shadow Inventory as of October 2011 Still at January 2009 Levels
CoreLogic ... reported today that the current residential shadow inventory as of October 2011 remained at 1.6 million units, representing a supply of 5 months. This was down from October 2010, when shadow inventory stood at 1.9 million units, or 7-months’ supply, but approximately the same level as reported in July 2011. Currently, the flow of new seriously delinquent loans into the shadow inventory has been offset by the roughly equal flow of distressed (short and real estate owned) sales.
CoreLogic estimates the current stock of properties in the shadow inventory, also known as pending supply, by calculating the number of distressed properties not currently listed on multiple listing services (MLSs) that are seriously delinquent (90 days or more), in foreclosure and real estate owned (REO) by lenders.
...
Of the 1.6 million properties currently in the shadow inventory, 770,000 units are seriously delinquent (2.5-months’ supply), 430,000 are in some stage of foreclosure (1.4-months’ supply) and 370,000 are already in REO (1.2-months’ supply).
...
The shadow inventory is approximately four times higher than its low point (380,000 properties) at the peak of the housing bubble in mid-2006.
...
“The shadow inventory overhang is a large impediment to the improvement in the housing market because it puts downward pressure on home prices, which hurts home sales and building activity while encouraging strategic defaults,” said Mark Fleming, chief economist for CoreLogic.
 Click on graph for larger image.
This graph from CoreLogic shows the breakdown of "shadow inventory" by category. For this report, CoreLogic estimates the number of 90+ day delinquencies, foreclosures and REOs not currently listed for sale. Obviously if a house is listed for sale, it is already included in the "visible supply" and cannot be counted as shadow inventory.
So the key number in this report is that as of October, there were 1.6 million homes seriously delinquent, in the foreclosure process or REO that are not currently listed for sale.
Note: The unlisted REO still seems a little high since total REO has dropped sharply over the last couple of quarters.
MBA: Mortgage Purchase Application Index decreases, Mortgage rates at low for year
by Calculated Risk on 12/21/2011 07:23:00 AM
From the MBA: Mortgage Rates Drop to Another 2011 Low in Latest MBA Weekly Survey
The Refinance Index decreased 1.6 percent from the previous week. The seasonally adjusted Purchase Index decreased 4.9 percent from one week earlier.The following graph shows the MBA Purchase Index and four week moving average since 1990.
...
The average contract interest rate for 30-year fixed-rate mortgages with conforming loan balances ($417,500 or less) decreased to 4.08 percent, the lowest rate this year, from 4.12 percent ...
The average contract interest rate for 30-year fixed-rate mortgages with jumbo loan balances (greater than $417,500) decreased to 4.44 percent, the lowest rate this year, from 4.47 percent ...
 Click on graph for larger image.
The purchase index decreased last week, and the 4-week average decreased slightly. This index has mostly been sideways for the last 2 years - and at about the same level as in 1997.
The MBA index was one of the indicators that suggested the NAR was overestimating existing home sales for the last several years.
Tuesday, December 20, 2011
Europe Update
by Calculated Risk on 12/20/2011 09:41:00 PM
• From the NY Times: Successful Spanish Debt Auction.
The E.C.B.’s new [long-term repo operation] facility [makes] it possible for banks to borrow from the central bank to fund purchases of government bonds. ... The E.C.B. will announce the results of its three-year liquidity injection on Wednesday morning, and there is wide uncertainty over the degree of demand. In a Reuters poll, traders estimated banks would ask in aggregate for as little as €50 billion to as much as €450 billion.It is likely the banks are using the ECB's 3 year long-term repo operation to buy debt. Some analyst have called this a "backdoor eurobond".
The Spanish 2 year yield is down to 3.35% - the lowest level since August, and the 10 year yield is down sharply to 5.31% - the lowest since October.
The Italian 2 year yield is down to 4.97% - the lowest level since October, and the 10 year yield is down to 6.61%.
• From the WSJ: Greece Nears Deal With Private Creditors
Greece is close to an agreement with its private-sector creditors to restructure the country's debt, Finance Minister Evangelos Venizelos said. ...Mr. Venizelos said separate negotiations on the new €130 billion bailout would begin on Jan. 16, when European and International Monetary Fund officials return to Athens to hash out details of the new program.There are the next two hurdles for Greece.
• From the WaPo: IMF calls Irish rescue ‘fragile’
Exports, critical to the small country’s success, are declining. And the weight of outstanding bank debt is making it hard for Ireland to meet the financial targets laid out under the joint IMF-European Union rescue program ... “We have not ruled out success at this point,” Craig Beaumont, the IMF’s mission chief for Ireland, said in a conference call. But “additional support would reinforce the program and improve the prospects.”That has to be the quote of the day: "We have not ruled out success ..."
Earlier:
• Housing Starts increase in November
• Multi-family Starts and Completions, Record Low Total Completions in 2011
• A comment on Existing Home Sales revisions


