by Calculated Risk on 12/20/2011 10:37:00 AM
Tuesday, December 20, 2011
Multi-family Starts and Completions, Record Low Total Completions in 2011
Since it usually takes over a year on average to complete multi-family projects - and multi-family starts were at a record low last year - builders are on track to complete a record low, or near record low, number of multi-family units this year.
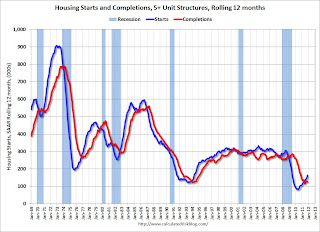
The following graph shows the lag between multi-family starts and completions using a 12 month rolling total.
The blue line is for multifamily starts and the red line is for multifamily completions. Since multifamily starts collapsed in 2009, completions collapsed in 2010.
 Click on graph for larger image.
The rolling 12 month total for starts (blue line) has been increasing all year. It now appears multi-family starts will be around 170 thousand units in 2011, up from 104 thousand units in 2010. That is a 60%+ increase in multi-family starts - but from a very low level.
Completions (red line) appear to have bottomed. This is probably because builders have rushed some projects to completion because of the strong demand for rental units.
It is important to emphasize that even with a strong increase in multi-family construction, it is 1) from a very low level, and 2) multi-family is a small part of residential investment (RI). But this is a very bright spot for construction.
The previous record low for multi-family completions was 127.1 thousand in 1993. It will be close this year, however total completions will be at a record low - and the U.S. will add the fewest net housing units to the housing stock since the Census Bureau started tracking completions in the '60s.
Below is a table of net housing units added to the housing stock since 1990. Note: Demolitions / scrappage estimated.
This means there will be a record low number of housing units added to the housing stock this year (good news with all the excess inventory), and that the overhang of excess inventory probably declined significantly this year.
| Housing Units added to Stock (000s) | ||||||
|---|---|---|---|---|---|---|
| 1 to 4 Units | 5+ Units | Manufactured Homes | Sub-Total | Demolitions / Scrappage | Total added to Stock | |
| 1990 | 1010.8 | 297.3 | 188.3 | 1496.4 | 200 | 1296.4 |
| 1991 | 874.4 | 216.6 | 170.9 | 1261.9 | 200 | 1061.9 |
| 1992 | 999.7 | 158 | 210.5 | 1368.2 | 200 | 1168.2 |
| 1993 | 1065.7 | 127.1 | 254.3 | 1447.1 | 200 | 1247.1 |
| 1994 | 1192.1 | 154.9 | 303.9 | 1650.9 | 200 | 1450.9 |
| 1995 | 1100.2 | 212.4 | 339.9 | 1652.5 | 200 | 1452.5 |
| 1996 | 1161.6 | 251.3 | 363.3 | 1776.2 | 200 | 1576.2 |
| 1997 | 1153.4 | 247.1 | 353.7 | 1754.2 | 200 | 1554.2 |
| 1998 | 1200.3 | 273.9 | 373.1 | 1847.3 | 200 | 1647.3 |
| 1999 | 1305.6 | 299.3 | 348.1 | 1953 | 200 | 1753 |
| 2000 | 1269.1 | 304.7 | 250.4 | 1824.2 | 200 | 1624.2 |
| 2001 | 1289.8 | 281 | 193.1 | 1763.9 | 200 | 1563.9 |
| 2002 | 1360.1 | 288.2 | 168.5 | 1816.8 | 200 | 1616.8 |
| 2003 | 1417.8 | 260.8 | 130.8 | 1809.4 | 200 | 1609.4 |
| 2004 | 1555 | 286.9 | 130.7 | 1972.6 | 200 | 1772.6 |
| 2005 | 1673.4 | 258 | 146.8 | 2078.2 | 200 | 1878.2 |
| 2006 | 1695.3 | 284.2 | 117.3 | 2096.8 | 200 | 1896.8 |
| 2007 | 1249.8 | 253 | 95.7 | 1598.5 | 200 | 1398.5 |
| 2008 | 842.5 | 277.2 | 81.9 | 1201.6 | 200 | 1001.6 |
| 2009 | 534.6 | 259.8 | 49.8 | 844.2 | 150 | 694.2 |
| 2010 | 505.2 | 146.5 | 50 | 701.7 | 150 | 551.7 |
| 2011 (est) | 430 | 126 | 46 | 602 | 150 | 452 |
Earlier:
• Housing Starts increase in November


