 RSS Feed
 by Calculated Risk on 5/25/2010 10:12:00 PM
Tuesday, May 25, 2010
Summary of Housing News
Just a summary of the housing news ...
Tomorrow the New Home sales report will be released, and since new homes are reported when the contract is signed, April was most likely the peak month for tax credit related buying.
For existing home sales, the sales are reported when the transaction is closed, and buyers have until June 30th to close - so reported sales will probably increase further. On existing home sales, please see Inventory increases Year-over-Year and Existing Home Sales increase in April
On house prices, see: Case-Shiller House Prices "Weakening" and First American CoreLogic: House Prices Decline 0.3% in March
And the MBA released the Q1 National Delinquency Survey last week showing record delinquencies:
1) Press Release from the MBA: Delinquencies, Foreclosure Starts Fall in Latest MBA National Delinquency Survey
2) Comments from MBA conference call.
3) Two key graphs: Mortgage Delinquencies by Period and by State
Best to all
CBO: Stimulus raised GDP 1.7% to 4.2% in Q1
by Calculated Risk on 5/25/2010 06:30:00 PM
From the Congressional Budget Office: Estimated Impact of the American Recovery and Reinvestment Act on Employment and Economic Output from January 2010 Through March 2010
CBO estimates that in the first quarter of calendar yearHere is the CBO's estimate of the impact on GDP by quarter:
2010, ARRA’s policies:Raised the level of real (inflation-adjusted) gross domestic product (GDP) by between 1.7 percent and 4.2 percent, Lowered the unemployment rate by between 0.7 percentage points and 1.5 percentage points, Increased the number of people employed by between 1.2 million and 2.8 million, and Increased the number of full-time-equivalent jobs by 1.8 million to 4.1 million compared with what those amounts would have been otherwise.
The effects of ARRA on output and employment are expected to increase further during calendar year 2010 but then diminish in 2011 and fade away by the end of 2012.
| Change Attributable to ARRA, GDP change (percent) | |||
|---|---|---|---|
| Low Estimate | High Estimate | ||
| 2009 | Q1 | 0.1 | 0.1 |
| 2009 | Q2 | 0.9 | 1.5 |
| 2009 | Q3 | 1.3 | 2.7 |
| 2009 | Q4 | 1.5 | 3.5 |
| 2010 | Q1 | 1.7 | 4.2 |
| 2010 | Q2 | 1.7 | 4.6 |
| 2010 | Q3 | 1.4 | 4.2 |
| 2010 | Q4 | 1.1 | 3.6 |
Note: the impact on GDP growth (the headline number reported each quarter by the BEA), is the change in spending from one quarter to the next. The ARRA impact on GDP peaks in Q2 2010 and is lower in Q3 2010 by both estimates. This change will show up as a drag on GDP growth in Q3.
This is part of the reason I expect a slowdown in growth in the 2nd half of 2010. Other factors include: the inventory correction appears over, I expect households to save more (a drag on consumption growth), and I expect further weakness in housing.
Market Update
by Calculated Risk on 5/25/2010 04:00:00 PM
The euro recovered to 1.23 dollars and I had to put away my Dow 10K hat ...
The S&P 500 actually finished up slightly.
This graph is from Doug Short of dshort.com (financial planner): "Four Bad Bears".
Note that the Great Depression crash is based on the DOW; the three others are for the S&P 500.
Real Case-Shiller National House Prices
by Calculated Risk on 5/25/2010 11:40:00 AM
S&P/Case-Shiller also released the Q1 2010 National Index this morning.
By request, here is a graph that shows the national index in both nominal and real terms (adjusted with CPI less shelter). Click on graph for larger image in new window.
In nominal terms (blue), the National Index declined 1.3% in Q1, and is 2.1% off the recent bottom in Q1 2009.
Note: Case-Shiller reported the national index declined 3.2% in Q1 (Not Seasonally Adjusted, NSA) - however I'm using the SA data.
In real terms (red), the National Index declined 1.9% in Q1, and is now at the lowest level since Q4 2000.
Case-Shiller House Prices "Weakening"
by Calculated Risk on 5/25/2010 09:00:00 AM
IMPORTANT: These graphs are Seasonally Adjusted (SA). S&P has cautioned that the seasonal adjustment is probably being distorted by irregular factors. These distortions could include distressed sales and the various government programs.
S&P/Case-Shiller released the monthly Home Price Indices for March (actually a 3 month average), and the Q1 2010 National Index.
The monthly data includes prices for 20 individual cities, and two composite indices (10 cities and 20 cities).
From S&P: The First Quarter of 2010 Indicates Some Weakening in Home Prices
Data through March 2009, released today by Standard & Poor’s for its S&P/Case-Shiller Home Price Indices ... show that the U.S. National Home Price Index fell 3.2% in the first quarter of 2010, but remains above its year-earlier level. In March, 13 of the 20 MSAs covered by S&P/Case-Shiller Home Price Indices and both monthly composites were down although the two composites and 10 MSAs showed year-over-year gains.
Housing prices rebounded from crisis lows, but recently have seen renewed weakness as tax incentives are ending and foreclosures are climbing.
 Click on graph for larger image in new window.
 The first graph shows the nominal not seasonally adjusted Composite 10 and Composite 20 indices (the Composite 20 was started in January 2000).
The Composite 10 index is off 29.8% from the peak, and up slightly in March (SA).
The Composite 20 index is off 29.3% from the peak, and down slightly in March (SA).
 The second graph shows the Year over year change in both indices.
The Composite 10 is up 3.2% compared to March 2009.
The Composite 20 is up 2.4% compared to March 2009.
This is the second month with YoY price increases in a row.
The third graph shows the price declines from the peak for each city included in S&P/Case-Shiller indices.
 Prices decreased (SA) in 11 of the 20 Case-Shiller cities in March (SA).
 Prices in Las Vegas are off 56% from the peak, and prices in Dallas only off 5.8% from the peak.
Case Shiller is reporting on the NSA data (13 cities down), and I'm using the SA data. I'm not sure why Case-Shiller is saying prices are weakening because the tax incentive is ending. This is Q1 and March 2010 data - and the tax incentive pulled forward demand and probably supported prices. Just wait until later this year ...
Morning Market News
by Calculated Risk on 5/25/2010 08:12:00 AM
From the NY Times: Concerns Over North Korea Shake Markets and Euro
From the WSJ: Europe's Banks Hit by Rising Loan Costs
On Monday, the London interbank offered rate, or Libor—the rate at which banks lend money to each other, and thus a vital sign of their mutual trust—rose to its highest level for the three-month dollar rate since last July. While the current Libor, at just above 0.5%, is far below the sky-high levels of 4.81875% reached at the height of the financial crisis in 2008, it is still a significant jump from 0.25% as recently as March.The three month Libor has moved even higher, and is now at 0.54.
But Libor's jump is more pronounced at European banks. On Monday, German state-controlled lender WestLB AG said it cost 0.565% to borrow dollars for three months, up from 0.38% a month earlier. U.S.
The TED spread is up to 38.61 (from 34.47). This is the difference between the interbank rate for three month loans and the three month Treasury. The peak was 463 on Oct 10th -the spread is still low, but has been steadily rising.
The European markets are off sharply. The German DAX off 2.76%, the FTSE 100 off 2.5%.
From CNBC: Pre-Market Data shows the S&P 500 off about 25 or over 2.0%. Dow futures are off almost 200 points.
The Euro is down to 1.22 dollars.
Monday, May 24, 2010
Futures Off Tonight
by Calculated Risk on 5/24/2010 11:56:00 PM
The U.S. futures are off tonight:
From CNBC: Pre-Market Data shows the S&P 500 off about 19 or almost 2.0%. Dow futures are off about 150 points.
Get your Dow 10K hats ready ... I've heard the Libor is "going nutty" (no link).
CBOT mini-sized Dow
And the Asian markets are off about 2% ... and a graph of the Asian markets.
The Euro is back down to 1.23 dollars. Some other sources for exchange rates and NetDania.
And a couple of stories ...
From Micheal Pettis at Bloomberg: China Falls Victim to Greek Deficit Contagion
And from the Financial Times: Obama adviser calls for new ‘mini-stimulus’
The Obama administration made a strong plea to Congress on Monday to grit its teeth and pass a new set of spending measures ... in order to help dig the economy “out of a deep valley”. ... Lawrence Summers ... urged Congress to pass up to $200bn (£138.9bn) in spending measures ... last year’s $787bn stimulus is wearing off.Could be an interesting day ...
except with permission
Best to all.
DOT: Vehicle Miles Driven increase in March
by Calculated Risk on 5/24/2010 09:05:00 PM
Note: On existing home sales, please see Inventory increases Year-over-Year and Existing Home Sales increase in April
The Department of Transportation (DOT) reported earlier today that vehicle miles driven in March were up from March 2009:
Travel on all roads and streets changed by +2.3% (5.8 billion vehicle miles) for March 2010 as compared with March 2009. Travel for the month is estimated to be 254.8 billion vehicle miles.So miles driven are still down for the year compared to 2009.
Cumulative Travel for 2010 changed by -0.7% (-4.8 billion vehicle miles).
Also miles driven in March were still 1.7% below March 2007.
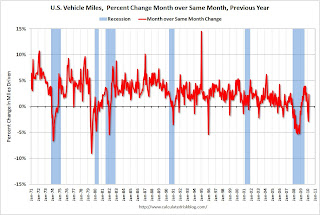 Click on graph for larger image in new window.
This graph shows the percent change from the same month of the previous year as reported by the DOT.
As the DOT noted, miles driven in March 2010 were up 2.3% compared to March 2009.
The YoY decline in February was blamed on the snow, and there might have been some extra driving in March once the weather improved. On a rolling 12 month basis, miles driven are still 2.1% below the peak - and only 0.5% above the recent low - suggesting a sluggish recovery.
FHA Commissioner: Housing on "Life support", "very sick system"
by Calculated Risk on 5/24/2010 05:55:00 PM
“This is a market purely on life support, sustained by the federal government. Having FHA do this much volume is a sign of a very sick system.”
Federal Housing Commissioner David Stevens at Mortgage Bankers Association Government Housing Conference (see Bloomberg, the FHA was involved in more transactions in Q1 than Fannie and Freddie combined)
No kidding ...
Market Update
by Calculated Risk on 5/24/2010 04:04:00 PM
Note: On existing home sales, please see Inventory increases Year-over-Year and Existing Home Sales increase in April
The market sell-off continues with the Dow down 127. The S&P 500 off 14 (1.3%).
This graph is from Doug Short of dshort.com (financial planner): "Four Bad Bears".
Note that the Great Depression crash is based on the DOW; the three others are for the S&P 500.
The Euro is down to 1.2383 dollars (off slightly).
The TED spread increased to 35.96 from 34.47. This is still fairly low, but has been increasing steadily. Note: This is the difference between the interbank rate for three month loans and the three month Treasury. The peak was 463 on Oct 10th and a normal spread is below 50 bps.
The three month dollar Libor edged up to 0.51.


