 RSS Feed
 by Calculated Risk on 4/22/2010 03:57:00 PM
Thursday, April 22, 2010
FHFA House Price Index Declines in February
The two house price indexes I usually use are from S&P Case-Shiller and First American Corelogic LoanPerformance (the one the Fed uses). The FHFA index is also a repeat sales index, but only includes GSE loans - and it has other issues too.
The LoanPerformance and Case-Shiller indexes for February will be released soon, but here is the FHFA index (and a graph of all three).
From Federal Housing Finance Agency (FHFA): U.S. Monthly House Price Index Declines 0.2 Percent from January to February
U.S. house prices fell 0.2 percent on a seasonally adjusted basis from January to February, according to the Federal Housing Finance Agency’s monthly House Price Index. The previously reported 0.6 percent decline in January was unchanged. For the 12 months ending in February, U.S. prices fell 3.4 percent. The U.S. index is 13.3 percent below its April 2007 peak.
The FHFA monthly index is calculated using purchase prices of houses backing mortgages that have been sold to or guaranteed by Fannie Mae or Freddie Mac.
 Click on graph for larger image in new window.
This graph shows the three indexes (note that LoanPeformance is NSA, Case-Shiller and FHFA are seasonally adjusted). FHFA is set to 100 in Jan 2000. The insert shows the movement of the three indexes since Jan 2008.
The FHFA index didn't match what we were seeing during the housing bubble, and I just wanted to point out why I focus on the other indexes now.
Hotel Occupancy increases 5.5% compared to same week in 2009
by Calculated Risk on 4/22/2010 01:15:00 PM
From HotelNewsNow.com: STR: Upper-upscale tops weekly numbers
Overall the U.S. industry’s occupancy increased 5.5 percent to 60.4 percent, ADR was up 1.4 percent to US$98.67, and RevPAR was up 7.0 percent to US$59.62.The following graph shows the occupancy rate for 2009 (the worst year since the Depression for hotel occupancy), 2010 and the median for 2000 through 2007.
 Click on graph for larger image in new window.
Notes: the scale doesn't start at zero, and holidays don't always line up.
The graph shows the distinct seasonal pattern for the occupancy rate; higher in the summer because of leisure/vacation travel, and lower on certain holidays.
The occupancy rate in 2010 has been ahead of 2009 for 8 of the last 9 weeks, and Average Daily Rate (ADR) is also up slightly. This is a little bit of good news for hotels, although the occupancy rate is still well below the normal level.
Data Source: Smith Travel Research, Courtesy of HotelNewsNow.com
More on Existing Home Sales and Inventory
by Calculated Risk on 4/22/2010 11:19:00 AM
Earlier the NAR released the existing home sales data for March; here are a couple more graphs ...
The first graph shows the year-over-year change in reported existing home inventory and months-of-supply. Click on graph for larger image in new window.
There was a rapid increase in inventory in the 2nd half of 2005 (that helped me call the peak of the bubble). Then the increase in inventory steadily slowed.
The YoY inventory has been decreasing for the last 20 months. However the YoY decline is getting smaller - only 1.8% in March.
This slow decline in the inventory is especially concerning with the large reported inventory and 8.0 months of supply in March - well above normal. Of course months of supply will decline over the next few months because of the increase in sales due to the tax credit, but this will be something to watch this summer and later this year. The second graph shows NSA monthly existing home sales for 2005 through 2010 (see Red columns for 2010).
Sales (NSA) in March 2010 were 19.6% higher than in March 2009, and also higher than in March 2008.
We will probably see an increase in sales in May and June - perhaps to the levels of 2006 or 2007 - because of the tax credit, however I expect to see existing home sales below last year in the 2nd half of this year.
Existing Home Sales increase in March
by Calculated Risk on 4/22/2010 10:00:00 AM
The NAR reports: Existing-Home Sales Rise
Existing-home sales, which are completed transactions that include single-family, townhomes, condominiums and co-ops, rose 6.8 percent to a seasonally adjusted annual rate of 5.35 million units in March from 5.01 million in February, and are 16.1 percent above the 4.61 million-unit level in March 2009.
...
Total housing inventory at the end of March rose 1.5 percent to 3.58 million existing homes available for sale, which represents an 8.0-month supply at the current sales pace, down from an 8.5-month supply in February.
 Click on graph for larger image in new window.
This graph shows existing home sales, on a Seasonally Adjusted Annual Rate (SAAR) basis since 1993.
Sales in March 2010 (5.35 million SAAR) were 6.8% higher than last month, and were 16.1% higher than March 2009 (4.61 million SAAR).
Sales surged last November when many first-time homebuyers rushed to beat the initial expiration of the tax credit. There will probably be another increase in May and June this year, although that will be probably be smaller than the November increase. Note: existing home sales are counted at closing, so even though contracts must be signed in April to qualify for the tax credit, buyers have until June 30th to close.
 The second graph shows nationwide inventory for existing homes.
According to the NAR, inventory increased to 3.58 million in March from 3.53 million in February. The all time record high was 4.57 million homes for sale in July 2008.
Inventory is not seasonally adjusted and there is a clear seasonal pattern - inventory should increase further in the spring. This was the 20th consecutive month of reported year-over-year decline in inventory, but the decline was only 1.8% from March 2009.
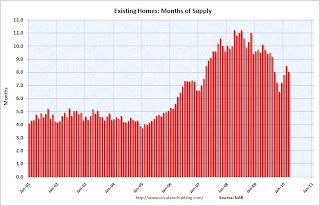 The last graph shows the 'months of supply' metric.
Months of supply decreased to 8.0 months in March.
A normal market has under 6 months of supply, so this is high - and probably excludes some substantial shadow inventory.
I'll have more later ...
Weekly Initial Unemployment Claims at 456,000
by Calculated Risk on 4/22/2010 08:30:00 AM
The DOL reports on weekly unemployment insurance claims:
In the week ending April 17, the advance figure for seasonally adjusted initial claims was 456,000, a decrease of 24,000 from the previous week's revised figure of 480,000. The 4-week moving average was 460,250, an increase of 2,750 from the previous week's revised average of 457,500.
...
The advance number for seasonally adjusted insured unemployment during the week ending April 10 was 4,646,000, a decrease of 40,000 from the preceding week's revised level of 4,686,000.
 Click on graph for larger image in new window.
This graph shows the 4-week moving average of weekly claims since 1971.
The four-week average of weekly unemployment claims increased this week by 2,750 to 460,250.
The dashed line on the graph is the current 4-week average. The current level of 456,000 (and 4-week average of 460,250) is still high, and suggests continuing weakness in the jobs market.
The 4-week average fell to this level in December 2009 following the worst of the recession, and has essentially moved sideways for four months.
Wednesday, April 21, 2010
On Existing Home Sales
by Calculated Risk on 4/21/2010 08:35:00 PM
Existing home sales for March will be released tomorrow and the consensus is for the NAR to report 5.25 million sales on a seasonally adjusted annual rate (SAAR) basis. That is probably close (I'll take the under). The NAR reported a 5.02 million sales rate in February.
1) The Federal tax credit expires at the end of April for buyers to sign a contract. Since existing home sales are reported when the transaction is closed (by the end of June to qualify for the tax credit), the tax credit probably had little impact on March sales. The boost to reported existing home sales from the tax credit will probably come mostly in May and June.
2) New home sales are counted when the contract is signed, so the boost should come earlier (March and April). The Census Bureau will report March new home sales on Friday.
3) The MBA mortgage purchase index is showing only a small pickup in purchase applications - so it appears the boost to sales from the tax credit will be much smaller than last year.
4) The level of existing home inventory is probably the most interesting detail in the NAR report tomorrow. Unfortunately there appears to be some discrepancy between local inventory levels and the number the NAR reports. However, on a year-over-year basis, inventories have been declining for the last 19 months. It is possible that the inventory level in March will be above March 2009 (3.65 million in March 2009). So that is something to watch for ...
Greece, Portugal Spread to Bunds Widen
by Calculated Risk on 4/21/2010 03:58:00 PM
Just an update ...
From Bloomberg: Portugal Spread to Bunds Widest in 13 Months on Greek Contagion
The yield on Portugal’s 10-year bond jumped 11 basis points to 4.80 percent ... That left the difference in yield, or spread, with bunds 11 basis points wider at 166 basis points, after earlier reaching 172 basis points, the most since March 10, 2009.
Greek 10-year bonds dropped ... sending the yield up 20 basis points to 8.17 percent. The yield premium over bunds jumped 25 basis points to 503 basis points after climbing to more than 522 basis points, the most since at least March 1998, when Bloomberg began compiling the generic prices.
Distressed Sales: Sacramento as an Example, March Update
by Calculated Risk on 4/21/2010 12:13:00 PM
The Sacramento Association of REALTORS® is breaking out monthly resales by equity sales (conventional resales), and distressed sales (Short sales and REO sales), and I'm following this series as an example to see mix changes in a distressed area.
Starting last month First American Corelogic has started releasing a distressed sales report - and that shows the trend in short sales and REOs nationally. Click on graph for larger image in new window.
Here is the March data.
The Sacramento Association started breaking out REO sales in 2008, but they have only broken out short sales since June 2009. Almost 65% of all resales (single family homes and condos) were distressed sales in March.
Note: This data is not seasonally adjusted, although the increase in sales in March is slightly above normal because of the tax credit. The second graph shows the percent of REO, short sales and conventional sales. The percent of short sales is near the high set in December. This will probably continue to increase this year (2010 is the year of the short sale!).
Also total sales in March were off 3.4% compared to March 2009; the tenth month in a row with declining YoY sales - even with a surge from tax credit buying this year!
On financing, nearly 60 percent were either all cash (27.1%) or FHA loans (31.5%), suggesting most of the activity in distressed former bubble areas like Sacramento is first time home buyers using government-insured FHA loans, and investors paying cash.
Architecture Billings Index shows contraction in March
by Calculated Risk on 4/21/2010 08:57:00 AM
Note: This index is a leading indicator for Commercial Real Estate (CRE) investment.
The WSJ reports that the American Institute of Architects’ Architecture Billings Index increased to 46.1 in March from 44.8 in February. Any reading below 50 indicates contraction.
"This is certainly an encouraging sign that we could be moving closer to a recovery phase, even though we continue to hear about mixed conditions across the country," said Kermit Baker, chief economist at the American Institute of ArchitectsThe ABI press release is not online yet.
 Click on graph for larger image in new window.
This graph shows the Architecture Billings Index since 1996. The index has remained below 50, indicating falling demand, since January 2008.
The second graph compares the Architecture Billings Index with the year-over-year change in non-residential structure investment.
 Historically, according to the AIA, there is an "approximate nine to twelve month lag time between architecture billings and construction spending" on non-residential construction. This suggests further significant declines in CRE investment through all of 2010, and probably longer.
Note: Nonresidential construction includes commercial and industrial facilities like hotels and office buildings, as well as schools, hospitals and other institutions.
And more on CRE: Fitch: U.S. CMBS Loan Defaults to Exceed 11% by End of 2010
Loan defaults will continue to escalate for U.S. CMBS, with an additional 4.4% likely in 2010 and the overall rate to exceed 11% among Fitch-rated deals by the end of the year, according to Fitch Ratings.
... For the first time in five years, multifamily was not the property type with the most new defaults, with that distinction going to retail (32.3%) last year. Following retail was multifamily (22.1%), office (20.2%) and hotel (17.8%). Fitch projects sizeable default increases for each property type, with rates likely to increase at accelerated rates for office and hotel loans.
'Office defaults spiked in the fourth quarter last year, with further rental and net operating income declines likely through next year before a rebound takes place,' said Senior Director Richard Carlson.
MBA: Mortgage Purchase Applications Increase "Modestly"
by Calculated Risk on 4/21/2010 08:07:00 AM
The MBA reports: Mortgage Applications Increase in Latest MBA Weekly Survey
The Market Composite Index, a measure of mortgage loan application volume, increased 13.6 percent on a seasonally adjusted basis from one week earlier. ...
“Treasury rates fell last week causing a decline in mortgage rates. As a result, refinance applications picked up over the week, as some borrowers took advantage of this recent rate volatility to lock in a low fixed-rate loan,” said Michael Fratantoni, MBA’s Vice President of Research and Economics. “Purchase applications continued to increase coming out of the Easter holiday, as we approach the end of the homebuyer tax credit, and are up modestly over last month.”
The Refinance Index increased 15.8 percent from the previous week and the seasonally adjusted Purchase Index increased 10.1 percent from one week earlier. ...
The refinance share of mortgage activity increased to 60.0 percent of total applications from 58.9 percent the previous week. ...
The average contract interest rate for 30-year fixed-rate mortgages decreased to 5.04 percent from 5.17 percent, with points increasing to 0.98 from 0.91 (including the origination fee) for 80 percent loan-to-value (LTV) ratio loans.
 Click on graph for larger image in new window.
This graph shows the MBA Purchase Index and four week moving average since 1990.
So far the increase in activity because of the expiration of the tax credit has been "modest". I expect any increase this year to be less than the increase last year ...


