 RSS Feed
 by Calculated Risk on 4/22/2010 10:00:00 AM
Thursday, April 22, 2010
Existing Home Sales increase in March
The NAR reports: Existing-Home Sales Rise
Existing-home sales, which are completed transactions that include single-family, townhomes, condominiums and co-ops, rose 6.8 percent to a seasonally adjusted annual rate of 5.35 million units in March from 5.01 million in February, and are 16.1 percent above the 4.61 million-unit level in March 2009.
...
Total housing inventory at the end of March rose 1.5 percent to 3.58 million existing homes available for sale, which represents an 8.0-month supply at the current sales pace, down from an 8.5-month supply in February.
 Click on graph for larger image in new window.
This graph shows existing home sales, on a Seasonally Adjusted Annual Rate (SAAR) basis since 1993.
Sales in March 2010 (5.35 million SAAR) were 6.8% higher than last month, and were 16.1% higher than March 2009 (4.61 million SAAR).
Sales surged last November when many first-time homebuyers rushed to beat the initial expiration of the tax credit. There will probably be another increase in May and June this year, although that will be probably be smaller than the November increase. Note: existing home sales are counted at closing, so even though contracts must be signed in April to qualify for the tax credit, buyers have until June 30th to close.
 The second graph shows nationwide inventory for existing homes.
According to the NAR, inventory increased to 3.58 million in March from 3.53 million in February. The all time record high was 4.57 million homes for sale in July 2008.
Inventory is not seasonally adjusted and there is a clear seasonal pattern - inventory should increase further in the spring. This was the 20th consecutive month of reported year-over-year decline in inventory, but the decline was only 1.8% from March 2009.
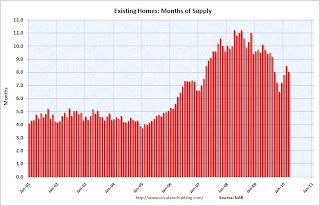 The last graph shows the 'months of supply' metric.
Months of supply decreased to 8.0 months in March.
A normal market has under 6 months of supply, so this is high - and probably excludes some substantial shadow inventory.
I'll have more later ...


