by Calculated Risk on 4/30/2009 11:46:00 PM
Thursday, April 30, 2009
Chrysler Bankruptcy Issues
For those interested in the legal issues surrounding the Chrysler bankruptcy, here are a couple of posts from attorney Steven Jakubowski.
First, an overview of situation and Chrysler balance sheet:
Part I: Assessing The Financial Carnage
Second, a discussion of some of the legal issues:
Part II: Testing The Limits Of Section 363 Sales
Jakubowski concludes:
So, who will win? Really, only the true speculator and/or holder of Chrysler credit default swaps will (and perhaps Fiat if they--unlike their predecessors--can make it work), as my first post on the financial carnage at Chrysler demonstrates. My guess is that after much briefing, discovery, and expedited litigation over the next 60 days, Judge Gonzalez will show enough angst to worry both sides that they stand to lose, thus resulting in a compromise that settles the matter and allows the transaction to go forward. But with all Chrysler plants and operations now idled pending a final sale, the pressure to get the deal consummated and return people to work will be so overwhelming that it's hard to imagine Judge Gonzalez not approving the transaction in some form that's acceptable to everyone (except perhaps the dissenting lenders).
New Homes Demolished in Victorville, CA
by Calculated Risk on 4/30/2009 08:49:00 PM
Hat tip to several - thanks! Note: Victorville is east of Los Angeles at the southern edge of the Mojave desert.
Report: Stress Test Results Delayed
by Calculated Risk on 4/30/2009 08:34:00 PM
From Bloomberg: U.S. Stress Test Results Delayed as Early Conclusions Debated
The Federal Reserve will postpone the release of stress tests on the biggest U.S. banks while executives debate preliminary findings with examiners ... The results, originally scheduled for publication on May 4, now may not be revealed until toward the end of next week ... A new release date may be announced as soon as tomorrow, they said.Note that President Obama announced today that GMAC would be receiving government aide (as part of Chrysler deal, GMAC will takeover all financing of Chrysler vehicles). GMAC is one of the 19 banks undergoing stress tests.
CNBC: Stress Test Results for Each Bank May be Released
by Calculated Risk on 4/30/2009 05:54:00 PM
From CNBC: US May Release Stress Test Results for Specific Banks
U.S. officials are leaning toward announcing the "stress test" results of individual banks next week instead of just summary results ...Transparency is important. It seems the basic principle should be: Banks that require public support should disclose the details of the stress tests to the public.
The plan on exactly how to release the results "is not very far along," the source said, adding that regulators are looking to disclose a lot of supervisory information about banks that is usually kept confidential.
If a bank does not want to disclose details of the stress test - no problem, they are a private enterprise. But shouldn't they immediately return any TARP money and stop using any special Fed/FDIC/Treasury liquidity programs?
April Economic Summary in Graphs
by Calculated Risk on 4/30/2009 04:00:00 PM
Here is a collection of real estate and economic graphs for data released in April ...
 New Home Sales in March
The first graph shows monthly new home sales (NSA - Not Seasonally Adjusted).
Note the Red columns for 2009. This is the lowest sales for March since the Census Bureau started tracking sales in 1963. (NSA, 34 thousand new homes were sold in March 2009; the previous low was 36 thousand in March 1982).
From: New Home Sales: 356 Thousand SAAR in March
 Housing Starts in March
Total housing starts were at 510 thousand (SAAR) in March, just above the revised record low of 488 thousand in January (the lowest level since the Census Bureau began tracking housing starts in 1959).
Single-family starts were at 358 thousand in March; just above the revised record low in January (356 thousand).
From: Housing Starts: Near Record Low
 Construction Spending in February
This graph shows private residential and nonresidential construction spending since 1993. Note: nominal dollars, not inflation adjusted.
"Residential construction was at a seasonally adjusted annual rate of $275.1 billion in February, 4.3 percent below the revised January estimate of $287.4 billion. Nonresidential construction was at a seasonally adjusted annual rate of $390.7 billion in February, 0.3 percent above the revised January estimate of $389.5 billion."
From: Construction Spending Declines in February
 March Employment Report
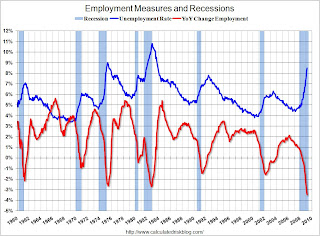
This graph shows the unemployment rate and the year over year change in employment vs. recessions.
Nonfarm payrolls decreased by 663,000 in March. January job losses were revised to
741,000. The economy has lost almost 3.3 million jobs over the last 5 months, and over 5 million jobs during the 15 consecutive months of job losses.
The unemployment rate rose to 8.5 percent; the highest level since 1983.
From: Employment Report: 663K Jobs Lost, 8.5% Unemployment Rate
 March Retail Sales
This graph shows the year-over-year change in nominal and real retail sales since 1993.
On a monthly basis, retail sales decreased 1.1% from February to March (seasonally adjusted), but sales are off 10.7% from March 2008 (retail and food services decreased 9.4%). Automobile and parts sales declined 2.3% in March (compared to February), but excluding autos, all other sales declined -0.9%.
From: Retail Sales Decline in March
 LA Port Traffic in March
This graph shows the loaded inbound and outbound traffic at the port of Los Angeles in TEUs (TEUs: 20-foot equivalent units or 20-foot-long cargo container). Although containers tell us nothing about value, container traffic does give us an idea of the volume of goods being exported and imported.
Inbound traffic was 6% below last March and 35% above last month.
Outbound traffic was 9.8% below March 2008, and 25% above February.
From: LA Port Import Traffic Rebounds
 U.S. Imports and Exports Through February
The first graph shows the monthly U.S. exports and imports in dollars through February 2009. The recent rapid decline in foreign trade continued in February. Note that a large portion of the recent decline in imports was related to the fall in oil prices, however the decline in February was mostly non-oil related.
From: U.S. Trade Deficit: Lowest Since 1999
 March Capacity Utilization
This is some serious cliff diving. Also - since capacity utilization is at a record low (the series starts in 1967), there is little reason for investment in new production facitilies.
The Federal Reserve reported that "industrial production fell 1.5 percent in March after a similar decrease in February. For the first quarter as a whole, output dropped at an annual rate of 20.0 percent, the largest quarterly decrease of the current contraction. At 97.4 percent of its 2002 average, output in March fell to its lowest level since December 1998 and was nearly 13 percent below its year-earlier level.
From: Industrial Production Declines Sharply in March
 NAHB Builder Confidence Index in April
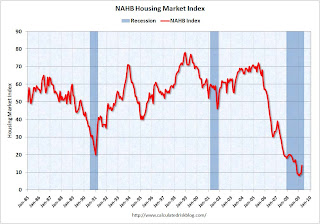
This graph shows the builder confidence index from the National Association of Home Builders (NAHB).
The housing market index (HMI) increased to 14 in April from 9 in March. The record low was 8 set in January.
The increase in April follows five consecutive months at either 8 or 9.
From: NAHB: Builder Confidence Increases in April
 Architecture Billings Index for March
"After a series of historic lows, the Architecture Billings Index (ABI) was up more than eight points in March. As a leading economic indicator of construction activity, the ABI reflects the approximate nine to twelve month lag time between architecture billings and construction spending. The American Institute of Architects (AIA) reported the March ABI rating was 43.7, up from the 35.3 mark in February. This was the first time since September 2008 that the index was above 40..."
From: Architecture Billings Index Increases in March
 Vehicle Miles driven in February
This graph shows the annual change in the rolling 12 month average of U.S. vehicles miles driven. Note: the rolling 12 month average is used to remove noise and seasonality.
By this measure, vehicle miles driven are off 3.6% Year-over-year (YoY); the decline in miles driven is worse than during the early '70s and 1979-1980 oil crisis.
From: DOT: U.S. Vehicle Miles Off 0.9% in February
 Existing Home Sales in March
 This graph shows existing home sales, on a Seasonally Adjusted Annual Rate (SAAR) basis since 1993.
Sales in March 2009 (4.57 million SAAR) were 3.0% lower than last month, and were 7.1% lower than March 2008 (4.92 million SAAR).
It's important to note that about 45% of these sales were foreclosure resales or short sales. Although these are real transactions, this means activity (ex-distressed sales) is under 3 million units SAAR.
From: Existing Home Sales Decline in March
 Existing Home Inventory March
This graph shows nationwide inventory for existing homes. According to the NAR, inventory decreased to 3.74 million in March. The all time record was 4.57 million homes for sale in July 2008. This is not seasonally adjusted.
Typically inventory increases slightly in March, and then really increases over the next few months of the year until peaking in the summer. This decrease in inventory was small, and the next few months will be key for inventory.
Also, most REOs (bank owned properties) are included in the inventory because they are listed - but not all. Recently there have been stories about a substantial number of unlisted REOs - this is possible, but not confirmed.
From: Existing Home Sales Decline in March
 Case Shiller House Prices for February
This graph shows the nominal Composite 10 and Composite 20 indices (the Composite 20 was started in January 2000).
The Composite 10 index is off 31.6% from the peak, and off 2.1% in February.
The Composite 20 index is off 30.7% from the peak, and off 2.2% in February.
From: Case-Shiller: House Prices Fall Sharply in February
 Homeownership Rate for Q1
The homeownership rate decreased to 67.3% and is now back to the levels of Q2 2000.
Note: graph starts at 60% to better show the change.
The homeownership rate increased because of demographics and changes in mortgage lending. The increase due to demographics (older population) will probably stick, so I expect the rate to decline to the 66% to 67% range - and not all the way back to 64% to 65%.
From: Q1 2009: Homeownership Rate at 2000 Levels
 Homeownership Vacancy Rate Q1
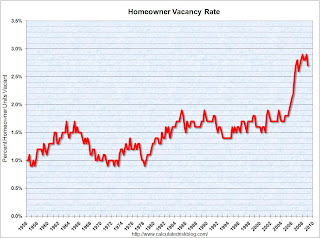
The homeowner vacancy rate was 2.7% in Q1 2009.
A normal rate for recent years appears to be about 1.7%. There is some noise in the series, quarter to quarter, so perhaps the vacancy rate has stabilized in the 2.7% to 2.9% range.
This leaves the homeowner vacancy rate about 1.0% above normal ...
From: Q1 2009: Homeownership Rate at 2000 Levels
 Rental Vacancy Rate for Q1
The rental vacancy rate was steady at 10.1% in Q1 2009.
It's hard to define a "normal" rental vacancy rate based on the historical series, but we can probably expect the rate to trend back towards 8%.
From: Q1 2009: Homeownership Rate at 2000 Levels
 Unemployment Claims
This graph shows weekly claims and continued claims since 1971.
The four week moving average is at 637,250, off 21,500 from the peak 3 weeks ago.
Continued claims are now at 6.27 million - the all time record.
From: Unemployment Claims: Record Continued Claims
 Restaurant Performance Index for March
"The outlook for the restaurant industry improved in March, as the National Restaurant Association’s comprehensive index of restaurant activity rose for the third consecutive month. The Association’s Restaurant Performance Index (RPI) – a monthly composite index that tracks the health of and outlook for the U.S. restaurant industry – stood at 97.7 in March, up 0.2 percent from February and 1.3 percent during the last three months."
From: Restaurant Performance Index Increases Slightly
 New Home Sales: March
This graph shows New Home Sales vs. recessions for the last 45 years. New Home sales have fallen off a cliff.
Sales of new one-family houses in March 2009 were at a seasonally adjusted annual rate of 356,000, according to estimates released jointly today by the U.S. Census Bureau and the Department of Housing and Urban Development.From: New Home Sales: 356 Thousand SAAR in March
This is 0.6 percent (±19.0%)* below the revised February rate of 358,000 and is 30.6 percent (±10.7%) below the March 2008 estimate of 513,000.
 New Home Months of Supply: March
There were 10.7 months of supply in March - significantly below the all time record of 12.5 months of supply set in January.
"The seasonally adjusted estimate of new houses for sale at the end of March was 311,000. This represents a supply of 10.7 months at the current sales rate."
From: New Home Sales: 356 Thousand SAAR in March
Hotel Occupancy Off 8.4 Percent
by Calculated Risk on 4/30/2009 02:05:00 PM
From HotelNewsNow.com: STR reports U.S. data for week ending 25 April
In year-over-year measurements, the industry’s occupancy fell 8.4 percent to end the week at 59.4 percent. Average daily rate dropped 6.1 percent to finish the week at US$100.44. Revenue per available room [RevPAR] for the week decreased 14.1 percent to finish at US$59.67.
 Click on graph for larger image in new window.
This graph shows the YoY change in the occupancy rate (3 week trailing average).
The three week average is off 9.6% from the same period in 2008.
The average daily rate is down 6.1%, so RevPAR is off 14.1% from the same week last year.
The Q1 advance GDP report showed a 44.2% annualized in decline in non-residential structure investment, and I expect lodging investment to decline even more over the next 18 to 24 months. Why build more hotels with RevPAR off 14% YoY?
Chrysler Bankruptcy Announcement at Noon ET
by Calculated Risk on 4/30/2009 11:40:00 AM
From CNBC: Chrysler To File for Bankruptcy, Sources Tell CNBC
Chrysler will file for bankruptcy ... two administration officials said Thursday.Here is the CNBC feed.
...
A statement from President Barack Obama and members of his autos task force on Chrysler's situation and the auto industry is scheduled for 12 Noon EST.
...
The stance will likely set the tone for similar discussions with bondholders of General Motors which is now on the clock to restructure its operations by the end of May.
Restaurant Performance Index Increases Slightly
by Calculated Risk on 4/30/2009 11:06:00 AM
Note: Any reading below 100 shows contraction. So the improvement in the index to 97.7 means the business is still contracting, but contracting at a slower pace.
From the National Restaurant Association (NRA): Restaurant Industry Outlook Improved as the Restaurant Performance Index Rose for the Third Consecutive Month
The outlook for the restaurant industry improved in March, as the National Restaurant Association’s comprehensive index of restaurant activity rose for the third consecutive month. The Association’s Restaurant Performance Index (RPI) – a monthly composite index that tracks the health of and outlook for the U.S. restaurant industry – stood at 97.7 in March, up 0.2 percent from February and 1.3 percent during the last three months.
“Although the RPI remained below 100 for the 17th consecutive month, which signals contraction, there are clear signs of improvement,” said Hudson Riehle, senior vice president of Research and Information Services for the Association. “Restaurant operators reported a positive six-month economic outlook for the first time in 18 months, and capital spending plans rose to a 9-month high.”
...
Restaurant operators also reported negative customer traffic levels for the 19th consecutive month in March.
...
Capital spending activity in the restaurant industry held relatively steady in recent months.
emphasis added
 Click on graph for larger image in new window.
Unfortunately the data for this index only goes back to 2002.
The index values above 100 indicate a period of expansion; index values below 100 indicate a period of contraction.
Based on this indicator, the restaurant industry has been contracting since November 2007.
Q1: Office, Mall and Lodging Investment
by Calculated Risk on 4/30/2009 09:27:00 AM
Here are some graphs of office, mall and lodging investment through Q1 2009 based on the underlying detail data released this morning by the BEA ... Click on graph for larger image in new window.
This graph shows investment in lodging (based on data from the BEA) as a percent of GDP. The recent boom in lodging investment has been stunning. Lodging investment peaked at 0.33% of GDP in Q3 2008 and is now declining sharply (0.28% in Q1 2009).
I expect lodging investment to continue to decline through at least 2010, to perhaps one-third of the peak.
Note: prior to 1997, the BEA included Lodging in a category with a few other buildings. This earlier data was normalized using 1997 data, and is an approximation. Investment in multimerchandise shopping structures (malls) peaked in Q4 2007 and is continuing to decline. As projects are completed, mall investment should fall much further.
As David Simon, Chief Executive Officer or Simon Property Group, the largest U.S. shopping mall owner said earlier this year:
"The new development business is dead for a decade. Maybe it’s eight years. Maybe it’s not completely dead. Maybe I’m over-dramatizing it for effect."
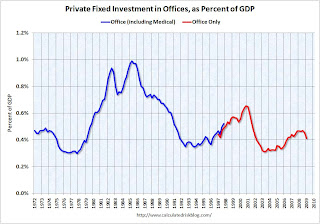
 The third graph shows office investment as a percent of GDP since 1972. Office investment peaked in Q3 2008, and with the office vacancy rate rising sharply, office investment will probably decline at least through 2010.
Note: In 1997, the Bureau of Economic Analysis changed the office category. In the earlier years, offices included medical offices. After '97, medical offices were not included (The BEA presented the data both ways in '97).
The non-residential structures investment bust is here and will continue for some time.
Unemployment Claims: Record Continued Claims
by Calculated Risk on 4/30/2009 08:45:00 AM
The DOL reports on weekly unemployment insurance claims:
In the week ending April 25, the advance figure for seasonally adjusted initial claims was 631,000, a decrease of 14,000 from the previous week's revised figure of 645,000. The 4-week moving average was 637,250, a decrease of 10,750 from the previous week's revised average of 648,000.
...
The advance number for seasonally adjusted insured unemployment during the week ending April 18 was 6,271,000, an increase of 133,000 from the preceding week's revised level of 6,138,000. The 4-week moving average was 6,076,000, an increase of 131,500 from the preceding week's revised average of 5,944,500.
 Click on graph for larger image in new window.
The first graph shows weekly claims and continued claims since 1971.
The four week moving average is at 637,250, off 21,500 from the peak 3 weeks ago.
Continued claims are now at 6.27 million - the all time record.
Next week I'll add the chart that normalizes the data by covered employment.
This is another very weak report, however the decline in the four-week average of weekly claims suggests there is a reasonable chance that the peak in weekly claims has happened for this cycle.


