by Calculated Risk on 4/30/2009 09:27:00 AM
Thursday, April 30, 2009
Q1: Office, Mall and Lodging Investment
Here are some graphs of office, mall and lodging investment through Q1 2009 based on the underlying detail data released this morning by the BEA ... Click on graph for larger image in new window.
This graph shows investment in lodging (based on data from the BEA) as a percent of GDP. The recent boom in lodging investment has been stunning. Lodging investment peaked at 0.33% of GDP in Q3 2008 and is now declining sharply (0.28% in Q1 2009).
I expect lodging investment to continue to decline through at least 2010, to perhaps one-third of the peak.
Note: prior to 1997, the BEA included Lodging in a category with a few other buildings. This earlier data was normalized using 1997 data, and is an approximation. Investment in multimerchandise shopping structures (malls) peaked in Q4 2007 and is continuing to decline. As projects are completed, mall investment should fall much further.
As David Simon, Chief Executive Officer or Simon Property Group, the largest U.S. shopping mall owner said earlier this year:
"The new development business is dead for a decade. Maybe it’s eight years. Maybe it’s not completely dead. Maybe I’m over-dramatizing it for effect."
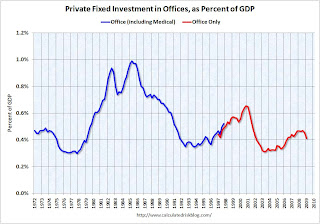
 The third graph shows office investment as a percent of GDP since 1972. Office investment peaked in Q3 2008, and with the office vacancy rate rising sharply, office investment will probably decline at least through 2010.
Note: In 1997, the Bureau of Economic Analysis changed the office category. In the earlier years, offices included medical offices. After '97, medical offices were not included (The BEA presented the data both ways in '97).
The non-residential structures investment bust is here and will continue for some time.


