 RSS Feed
 by Calculated Risk on 4/28/2014 10:00:00 AM
Monday, April 28, 2014
NAR: Pending Home Sales Index increases 3.4% in March, down 7.9% year-over-year
From the NAR: Pending Home Sales Increase in March
The Pending Home Sales Index, a forward-looking indicator based on contract signings, rose 3.4 percent to 97.4 from an upwardly revised 94.2 in February, but is 7.9 percent below March 2013 when it was 105.7.Mr Yun's once again lowered his forecast for 2014, and is now down to 4.9 million "Existing-home sales are expected to total just over 4.9 million this year, below the nearly 5.1 million in 2013." This is down from his earlier forecast of 5.1 million existing home sales this year. I'll once again take the under on his current forecast - but I think that it would be a positive sign if sales were under 5 million in 2014 as long as distressed sales continue to decline and conventional sales increase.
...
The PHSI in the Northeast increased 1.4 percent to 78.8 in March, but is 5.9 percent below a year ago. In the Midwest the index slipped 0.8 percent to 94.5 in March, and is 10.1 percent below March 2013. Pending home sales in the South rose 5.6 percent to an index of 112.7 in March, but are 5.3 percent below a year ago. The index in the West increased 5.7 percent in March to 91.0, but is 11.1 percent below March 2013.
Note: Contract signings usually lead sales by about 45 to 60 days, so this would usually be for closed sales in April and May.
Black Knight (formerly LPS): House Price Index up 0.7% in February, Up 7.6% year-over-year
by Calculated Risk on 4/28/2014 09:10:00 AM
Notes: I follow several house price indexes (Case-Shiller, CoreLogic, Black Knight (formerly LPS), Zillow, FHFA, FNC and more). The timing of different house prices indexes can be a little confusing. Black Knight uses the current month closings only (not a three month average like Case-Shiller or a weighted average like CoreLogic), excludes short sales and REOs, and is not seasonally adjusted.
From LPS: U.S. Home Prices Up 0.7 Percent for the Month; Up 7.6 Percent Year-Over-Year
Today, the Data and Analytics division of Black Knight Financial Services (formerly the LPS Data & Analytics division) released its latest Home Price Index (HPI) report, based on February 2014 residential real estate transactions. ... The Black Knight HPI represents the price of non-distressed sales by taking into account price discounts for REO and short sales.The year-over-year increase was less in February (7.6% YoY increase) than in January (8.0%), December (8.4%), November (8.5%) and October (8.8%), so this suggests price increases might be slowing.
The LPS HPI is off 13.5% from the peak in June 2006.
Note: The press release has data for the 20 largest states, and 40 MSAs. Prices increased in 19 of the 20 largest states in February and were unchanged in Ohio.
LPS shows prices off 43.7% from the peak in Las Vegas, off 36.7% in Orlando, and 34.1% off from the peak in Riverside-San Bernardino, CA (Inland Empire). Prices are at new highs in Colorado and Texas (Denver, Austin, Dallas, Houston and San Antonio metros). Prices are also at new highs in Honolulu.
Note: Case-Shiller for February will be released tomorrow.
Sunday, April 27, 2014
Monday: Pending Home Sales, Dallas Fed Mfg Survey
by Calculated Risk on 4/27/2014 08:30:00 PM
This will be a busy week ... Tim Duy has a preview of the FOMC meeting: FOMC Week
The FOMC will wrap up a two-day meeting this Wednesday. I suspect the subsequent statement will be met with little fanfare. There simply has been little in the way of data to prompt any new policy path. Steady as she goes.CR: I expect the FOMC to announce a $10 billion decrease in asset purchases, to blame the early year weakness mostly on the weather, and to express some concern about housing and also concern that inflation is too low. More of the same ...
To be sure, the Fed will be greeted by the Q1 GDP report Wednesday morning, and it is widely expected to be very weak. But incoming data (retail sales, auto sales, industrial production, and employment, for example) suggests that much of this weakness was weather related while the underlying pace of activity, albeit arguably unexciting, remains unchanged. In short, the economy is evolving largely according to the Fed's script, and thus we should expect no major policy change. I anticipate the statement will reflect a greater confidence that the first quarter growth hiccup was a weather effect, that low inflation remains a concern, and a reiteration of the Fed's commitment to a low-rate policy path as long as inflation remains a concern. And another $10 billion cut in asset purchases to push the taper further along.
The Fed may identify housing as an area of concern.
And Jim Hamilton has a discussion of the recent increase in gasoline prices: Oil and gasoline prices: many still missing the big picture
The international price of crude oil ultimately determines the price Americans pay for gasoline at the pump. Seasonal factors can bring the price temporarily below the long-run relation, and this accounted for the temporarily low gasoline prices that we saw last fall and winter. Movements in gasoline prices back up this spring are basically a return to normal.Monday:
And crude oil prices have remained stable despite impressive gains in U.S. production of shale oil, referring to oil produced from tight geological formations using horizontal fracturing methods. These new drilling techniques have added 2.5 million barrels of daily U.S. oil production since 2010. Why hasn’t that new oil brought lower prices?
...
For the next several years, the world should be able to continue to increase field production of crude oil, as long as the price stays at current levels. The real message from the new technology is this: oil prices have been remarkably steady over the last several years because of– not in spite of– the important added contribution of tight oil.
• At 10:00 AM ET, Pending Home Sales Index for March. The consensus is for a 0.6% increase in the index.
• At 10:30 AM, the Dallas Fed Manufacturing Survey for April. This is the last of the regional Fed manufacturing surveys for April.
Weekend:
• Schedule for Week of April 20th
• Ranking Economic Data
From CNBC: Pre-Market Data and Bloomberg futures: the S&P futures are up 3 and DOW futures are up 23 (fair value).
Oil prices are mixed with WTI futures at $100.79 per barrel and Brent at $109.58 per barrel.
Below is a graph from Gasbuddy.com for nationwide gasoline prices. Nationally prices are around $3.66 per gallon (up sharply over the last three months and more than 10 cents above the level of a year ago). If you click on "show crude oil prices", the graph displays oil prices for WTI, not Brent; gasoline prices in most of the U.S. are impacted more by Brent prices.
| Orange County Historical Gas Price Charts Provided by GasBuddy.com |
Ranking Economic Data
by Calculated Risk on 4/27/2014 10:38:00 AM
Here is an update to a list I posted several years ago with my ranking of economic data releases.
These lists are not exhaustive (I'm sure I left a few off), and the rankings are not static. As an example, a few years ago I ranked initial weekly unemployment claims as ‘B List’ data, but now that claims are close to normal levels, I've moved weekly claims down to the 'C List'. Currently I'm watching measures of household debt a little closer and I've moved up the NY Fed's quarterly "Household Debt and Credit Report" to the C-list.
Note: There has been some research by Wall Street analysts about how "surprises" for many of these indicators impact the stock market. In general the ranking is similar with the employment situation report being #1.
The NAR existing home sales report is difficult to rank. 'For sale' inventory is important - almost "B-List" - but the headline sales number is more "C-List".
For each indicator I've included a link to the source and a recent post with graphs (in parenthesis).
Some of the lower ranked data is useful as leading indicators. As an example, the Architecture Billings Index is a leading indicator for investment in commercial real estate. And the NMHC apartment survey leads changes in apartment rents and vacancy rates. Also some of the lower ranked data helps forecast some of the more important data.
Both A-List reports (employment and GDP) will be released this week.
A-List
• BLS: Employment Situation Report, (March Employment Report: 192,000 Jobs, 6.7% Unemployment Rate and Comments on Employment Report)
• BEA: GDP Report (quarterly) (Q4 GDP Revised up to 2.6%)
B-List
• Census: New Home Sales (New Home Sales decline to 384,000 Annual Rate in March)
• Census: Housing Starts (Housing Starts at 946 Thousand Annual Rate in March and A comment on Housing Starts)
• ISM Manufacturing Index (ISM Manufacturing index increased in March to 53.7)
• Census: Retail Sales (Retail Sales increased 1.1% in March)
• BEA: Personal Income and Outlays (Personal Income increased 0.3% in February, Spending increased 0.3%)
• Fed: Industrial Production (Fed: Industrial Production increased 0.7% in March)
• BLS: Core CPI (Key Inflation Measures Shows Slight Increase, but still Low in March)
C-List
• NAR: Existing Home Sales (Existing Home Sales in March: 4.59 million SAAR, Inventory up 3.1% Year-over-year)
• DOL: Weekly Initial Unemployment Claims (Weekly Initial Unemployment Claims at 329,000)
• Manufacturers: Light Vehicle Sales (U.S. Light Vehicle Sales increase to 16.4 million annual rate in March, Highest since 2007)
• Philly Fed: Philly Fed Index (Philly Fed Manufacturing Survey indicated Faster Expansion in April)
• NY Fed Empire State Manufacturing Index (NY Fed: Empire State Manufacturing Survey indicates "business activity was flat" in April)
• Chicago ISM: Chicago PMI (Chicago PMI declines to 55.9)
• Census: Durable Goods
• ISM Non-Manufacturing Index (ISM Non-Manufacturing Index increases to 53.1 in March)
• House Prices: Case-Shiller and CoreLogic (CoreLogic: House Prices up 12.2% Year-over-year in February and Comment on House Prices: Graphs, Real Prices, Price-to-Rent Ratio, Cities)
• BLS: Job Openings and Labor Turnover Survey (BLS: Jobs Openings increase to 4.2 million in February)
• Census: Construction Spending (Construction Spending increased slightly in February)
• Census: Trade Balance (Trade Deficit increased in February to $42.3 Billion)
• MBA: Mortgage Delinquency Data (Quarterly) (MBA: Mortgage "Delinquency and Foreclosure Rates Decline to Lowest Level in Six Years" in Q4)
• LPS: Mortgage Delinquency Data (Black Knight: Mortgage delinquency rate in March lowest since October 2007)
• CoreLogic and Zillow: Negative Equity Report and Zillow (quarterly) (CoreLogic: 4 Million Residential Properties Returned to Positive Equity in 2013 and Zillow: Negative Equity declines further in Q4 2013)
• AIA: Architecture Billings Index (AIA: Architecture Billings Index indicated contraction in March)
• NY Fed: Household Debt and Credit Report (Quarterly) (NY Fed: Household Debt increased in Q4, Delinquency Rates Improve)
D-List
• Fed: Household Debt Service and Financial Obligations Ratios (Quarterly) (Fed: Q4 Household Debt Service Ratio near 30 year low)
• Fed: Flow of Funds (Quarterly) (Mortgage Equity Withdrawal Still Negative in Q4)
• Richmond Fed: Richmond Fed Manufacturing Index
• Kansas City Fed: Kansas City Fed Manufacturing Index
• Dallas Fed: Dallas Fed Manufacturing Index
• Reis: Office, Mall, Apartment Vacancy Rates (Quarterly) (Reis: Office Vacancy Rate declined slightly in Q1 to 16.8% and Reis: Apartment Vacancy Rate declined to 4.0% in Q1 2014 and Reis: Mall Vacancy Rates unchanged in Q1)
• NMHC Apartment Survey (Quarterly) (NMHC Survey: Apartment Market Conditions Softer in Q4)
• Reuters / Univ. of Michigan Consumer Sentiment Index (Final April Consumer Sentiment at 84.1)
• MBA: Mortgage Purchase Applications Index (MBA: Mortgage Applications Decrease in Latest MBA Weekly Survey)
• NAHB: Housing Market Index (NAHB: Builder Confidence increased slightly in April to 47)
• Census: Housing Vacancy Survey (Quarterly) (HVS: Q4 2013 Homeownership and Vacancy Rates)
• Fed: Senior Loan Officer Survey (Quarterly) (Fed Survey: Banks eased lending standards, Experienced increased demand)
• ATA: Trucking (ATA Trucking Index increased in February)
• NFIB: Small Business Survey (NFIB: Small Business Optimism Index increases in March)
• STR: Hotel Occupancy (Hotels: Occupancy Rate, RevPAR decrease in latest weekly survey)
• NRA: Restaurant Performance Index
• Fed: Consumer Credit
• DOT: Vehicle Miles Driven (DOT: Vehicle Miles Driven decreased 0.8% year-over-year in February)
• LA and Long Beach Port Traffic: LA area Port Traffic: Up year-over-year in March, Exports at New High)
• BLS: Producer Price Index
• ADP Employment Report
• Conference Board Confidence Index
• NAR: Pending Home Sales
Sources (Government):
BEA: Bureau of Economic Analysis
BLS: Bureau of Labor Statistics
Census: Census Bureau
DOL: Dept of Labor
DOT: Dept. of Transportation
Fed: Federal Reserve
Sources (Industry):
AIA: American Institute of Architects
ISM: Institute for Supply Management
LPS: Black Knight
MBA: Mortgage Bankers Association
NAHB: National Association of Homebuilders
NAR: National Association of Realtors
NFIB: National Federation of Independent Business
NRA: National Restaurant Association
STR: Smith Travel Research
Saturday, April 26, 2014
Schedule for Week of April 27th
by Calculated Risk on 4/26/2014 01:11:00 PM
This will be a busy week for economic data with several key reports including the April employment report on Friday and the advance Q1 GDP report on Wednesday.
Other key reports include the ISM manufacturing index on Thursday, April vehicle sales, also on Thursday, and the February Case-Shiller house price index on Tuesday.
There will a two-day FOMC meeting on Tuesday and Wednesday, and the Fed is expected to announce on Wednesday a decrease in asset purchases from $55 billion per month to $45 billion per month.
10:00 AM ET: Pending Home Sales Index for March. The consensus is for a 0.6% increase in the index.
10:30 AM: Dallas Fed Manufacturing Survey for April. This is the last of the regional Fed manufacturing surveys for April.
 9:00 AM: S&P/Case-Shiller House Price Index for February. Although this is the February report, it is really a 3 month average of December, January and February.
 This graph shows the nominal seasonally adjusted Composite 10 and Composite 20 indexes through January 2014 (the Composite 20 was started in January 2000).
The consensus is for a 13.0% year-over-year increase in the Composite 20 index (NSA) for February. The Zillow forecast is for the Composite 20 to increase 12.8% year-over-year, and for prices to increase 0.6% month-to-month seasonally adjusted.
10:00 AM: Conference Board's consumer confidence index for April. The consensus is for the index to increase to 83.0 from 82.3.
10:00 AM: Q1 Housing Vacancies and Homeownership report from the Census Bureau. This report is frequently mentioned by analysts and the media to report on the homeownership rate, and the homeowner and rental vacancy rates. However, this report doesn't track with other measures (like the decennial Census and the ACS).
7:00 AM: The Mortgage Bankers Association (MBA) will release the results for the mortgage purchase applications index.
8:15 AM: The ADP Employment Report for April. This report is for private payrolls only (no government). The consensus is for 210,000 payroll jobs added in April, up from 191,000 in March.
8:30 AM: Q1 GDP (advance estimate). This is the advance estimate of Q1 GDP from the BEA. The consensus is that real GDP increased 1.1% annualized in Q1.
9:45 AM: Chicago Purchasing Managers Index for April. The consensus is for an increase to 56.9, up from 55.9 in March.
2:00 PM: FOMC Meeting Announcement. No change in interest rates is expected (for a long time). However the FOMC is expected to reduce QE3 asset purchases by $10 billion per month at this meeting.
8:30 AM: The initial weekly unemployment claims report will be released. The consensus is for claims to decrease to 320 thousand from 329 thousand.
 All day: Light vehicle sales for April. The consensus is for light vehicle sales to decrease to 16.2 million SAAR in April (Seasonally Adjusted Annual Rate) from 16.3 million SAAR in March.
This graph shows light vehicle sales since the BEA started keeping data in 1967. The dashed line is the March sales rate.
8:30 AM: Personal Income and Outlays for March. The consensus is for a 0.4% increase in personal income, and for a 0.6% increase in personal spending. And for the Core PCE price index to increase 0.2%.
8:30 AM: Speech by Fed Chair Janet Yellen, Community Bank Supervision, At the Independent Community Bankers of America 2014 Washington Policy Summit, Washington, D.C.
9:00 AM ET: The Markit US PMI Manufacturing Index for April.
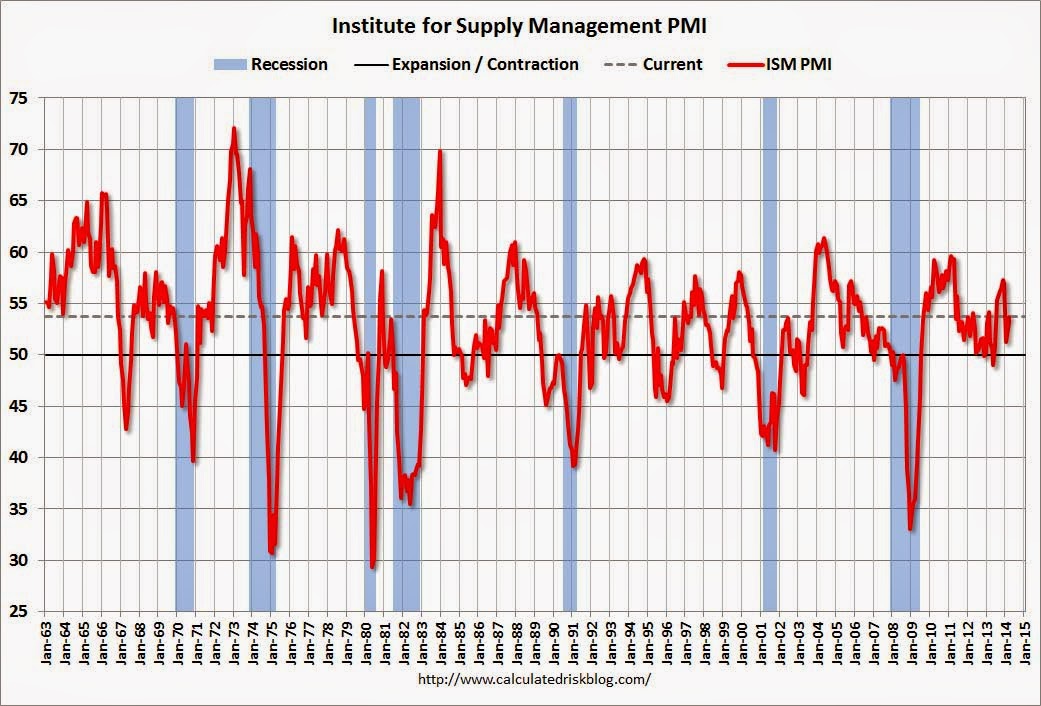 10:00 AM ET: ISM Manufacturing Index for April. The consensus is for an increase to 54.2 from 53.7 in March.
Here is a long term graph of the ISM manufacturing index.
The ISM manufacturing index indicated expansion in March at 53.7%. The employment index was at 51.1%, and the new orders index was at 55.1%.
10:00 AM: Construction Spending for March. The consensus is for a 0.6% increase in construction spending.
8:30 AM: Employment Report for April. The consensus is for an increase of 215,000 non-farm payroll jobs in April, up from the 192,000 non-farm payroll jobs added in March.
The consensus is for the unemployment rate to decline to 6.6% in April.
 This graph shows the percentage of payroll jobs lost during post WWII recessions through March.
The economy has added 8.9 million private sector jobs since employment bottomed in February 2010 (8.3 million total jobs added including all the public sector layoffs).
There are 110 thousand more private sector jobs now than when the recession started in 2007, but total employment is still 437 thousand below the pre-recession peak.
10:00 AM: Manufacturers' Shipments, Inventories and Orders (Factory Orders) for March. The consensus is for a 1.3% increase in March orders.


