by Calculated Risk on 4/16/2014 11:27:00 AM
Wednesday, April 16, 2014
A comment on Housing Starts
There were 203 thousand total housing starts in Q1 this year (not seasonally adjusted, NSA), down 2% from the 208 thousand during Q1 of 2013. Note: Permits were up 6% in Q1 2014 compared to Q1 2013 - still weak growth, but positive.
The weak start to 2014 was due to several factors: severe weather, higher mortgage rates, higher prices and probably supply constraints in some areas.
It is also important to note that Q1 was a difficult year-over-year comparison for housing starts. There was a huge surge for housing starts in Q1 2013 (up 34% over Q1 2012). Then starts softened a little over the next 7 months until November.
 Click on graph for larger image.
This year, I expect starts to be stronger over the next couple of quarters - and more starts combined with an easier comparison means starts will be up solidly year-over-year.
In 2013, the year-over-year comparisons ranged from a high of 42% to a low of just 2% - so there is quite a bit of variability. Overall starts finished up a solid 18.5% last year compared to 2012, and I still expect solid growth this year.
Here is an update to the graph comparing multi-family starts and completions. Since it usually takes over a year on average to complete a multi-family project, there is a lag between multi-family starts and completions. Completions are important because that is new supply added to the market, and starts are important because that is future new supply (units under construction is also important for employment).
These graphs use a 12 month rolling total for NSA starts and completions.
 The blue line is for multifamily starts and the red line is for multifamily completions.
The rolling 12 month total for starts (blue line) has been increasing steadily, and completions (red line) are lagging behind - but completions will continue to follow starts up (completions lag starts by about 12 months).
This means there will be an increase in multi-family completions in 2014, but probably still below the 1997 through 2007 level of multi-family completions. Multi-family starts will probably move more sideways in 2014.
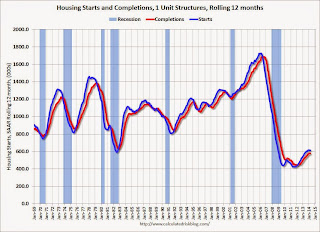
 The second graph shows single family starts and completions. It usually only takes about 6 months between starting a single family home and completion - so the lines are much closer. The blue line is for single family starts and the red line is for single family completions.
Starts have been moving up, and completions have followed.
Note the exceptionally low level of single family starts and completions. The "wide bottom" was what I was forecasting several years ago, and now I expect several years of increasing single family starts and completions.


