 RSS Feed
 by Calculated Risk on 12/26/2020 07:04:00 PM
Saturday, December 26, 2020
December 26 COVID-19 Test Results; Be Careful with Holidays Numbers
Note: Expect a dip in the data over the holidays. The week-over-week growth in positive cases has slowed. Hopefully that continues.
The US is now averaging close to 2 million tests per day. Based on the experience of other countries, for adequate test-and-trace (and isolation) to reduce infections, the percent positive needs to be under 5% (probably close to 1%), so the US has far too many daily cases - and percent positive - to do effective test-and-trace.
There were 2,133,757 test results reported over the last 24 hours.
There were 189,268 positive tests.
Almost 64,000 US deaths have been reported so far in December, surpassing April as the deadliest month. See the graph on US Daily Deaths here.
 Click on graph for larger image.
This data is from the COVID Tracking Project.
The percent positive over the last 24 hours was 8.9% (red line is 7 day average). The percent positive is calculated by dividing positive results by total tests (including pending).
And check out COVID Act Now to see how each state is doing. (updated link to new site)
 The second graph shows the 7 day average of positive tests reported and daily hospitalizations.
Schedule for Week of December 27, 2020
by Calculated Risk on 12/26/2020 08:11:00 AM
Happy New Year! Wishing you all the best in 2021.
Note: If the government shuts down, some government data will be delayed (the DOL initial weekly unemployment claims was still released during the last shutdown). All Fed Reserve data will still be released.
The key indicator this week is Case-Shiller House Prices for October.
----- Monday, Dec 28th -----
10:30 AM: Dallas Fed Survey of Manufacturing Activity for December. This is the last of regional manufacturing surveys for December.
----- Tuesday, Dec 29th -----
 9:00 AM ET: S&P/Case-Shiller House Price Index for October.
This graph shows graph shows the Year over year change in the seasonally adjusted National Index, Composite 10 and Composite 20 indexes through the most recent report (the Composite 20 was started in January 2000).
The consensus is for a 7.2% year-over-year increase in the National index for October.
10:30 AM: Dallas Fed Survey of Manufacturing Activity for December. This is the last of regional manufacturing surveys for December.
 9:00 AM ET: S&P/Case-Shiller House Price Index for October.
This graph shows graph shows the Year over year change in the seasonally adjusted National Index, Composite 10 and Composite 20 indexes through the most recent report (the Composite 20 was started in January 2000).
The consensus is for a 7.2% year-over-year increase in the National index for October.
Note that Zillow is forecasting Case-Shiller will report a 7.7% YoY increase in the National index.
----- Wednesday, Dec 30th -----
7:00 AM ET: The Mortgage Bankers Association (MBA) will release the results for the mortgage purchase applications index.
9:45 AM: Chicago Purchasing Managers Index for December.
10:00 AM: Pending Home Sales Index for November. The consensus is for a 0.2% increase in the index.
----- Thursday, Dec 31st -----
8:30 AM: The initial weekly unemployment claims report will be released.
----- Friday, Jan 1st -----
All US markets will be closed in observance of the New Year's Day Holiday.
7:00 AM ET: The Mortgage Bankers Association (MBA) will release the results for the mortgage purchase applications index.
9:45 AM: Chicago Purchasing Managers Index for December.
10:00 AM: Pending Home Sales Index for November. The consensus is for a 0.2% increase in the index.
8:30 AM: The initial weekly unemployment claims report will be released.
All US markets will be closed in observance of the New Year's Day Holiday.
Friday, December 25, 2020
December 25 COVID-19 Test Results; Holiday Decline in Numbers
by Calculated Risk on 12/25/2020 07:16:00 PM
Note: Expect a dip in the data over the holidays. The week-over-week growth in positive cases has slowed. Hopefully that continues.
The US is now averaging close to 2 million tests per day. Based on the experience of other countries, for adequate test-and-trace (and isolation) to reduce infections, the percent positive needs to be under 5% (probably close to 1%), so the US has far too many daily cases - and percent positive - to do effective test-and-trace.
There were 1,272,991 test results reported over the last 24 hours.
There were 124,498 positive tests.
Over 62,000 US deaths have been reported so far in December, surpassing April as the deadliest month. See the graph on US Daily Deaths here.
 Click on graph for larger image.
This data is from the COVID Tracking Project.
The percent positive over the last 24 hours was 9.8% (red line is 7 day average). The percent positive is calculated by dividing positive results by total tests (including pending).
And check out COVID Act Now to see how each state is doing. (updated link to new site)
 The second graph shows the 7 day average of positive tests reported and daily hospitalizations.
Ten Economic Questions for 2021
by Calculated Risk on 12/25/2020 01:11:00 PM
Here is a review of the Ten Economic Questions for 2020
Below are my ten questions for 2021. These are just questions, I'll follow up with some thoughts on each of these questions.
The purpose of these questions is to provide a framework to think about how the U.S. economy will perform in 2021, and if there are surprises - like in 2020 - to adjust my thinking.
A key question is when will the pandemic subside? This will have a huge economic impact, but is a question for infectious disease experts. I'm assuming that by mid-year people will engage in normal economic activity.
1) Economic growth: Economic growth was probably around negative 3% in 2020 due to the pandemic (maybe 2.5% Q4 over Q4). The FOMC is expecting growth of 3.7% to 5.0% Q4-over-Q4 in 2021. How much will the economy grow in 2021?
2) Employment: Through November 2020, the economy lost 9.37 million jobs. By April 2020, the economy had lost 21.7 million jobs, and then added back 12.33 million jobs by November. But job growth slowed over the last few months. Will all the jobs lost in 2020 return in 2021, or will job growth be sluggish?
3) Unemployment Rate: The unemployment rate was at 6.7% in November, up 3.2 percentage points year-over-year, but down from the peak of 14.7% in April. Currently the FOMC is forecasting the unemployment rate will be in the 4.7% to 5.4% range in Q4 2021. What will the unemployment rate be in December 2021?
4) Participation Rate: In November 2020, the overall participation rate was at 61.5%, down year-over-year from 63.2% in November 2019. Long term, the BLS has been projecting the overall participation rate will decline to 61.2% by 2028 due to demographics. Will the overall participation rate increase to pre-pandemic levels (63.4% in February 2020) , or will it will only partially recover in 2021?
5) Inflation: Core PCE was only up 1.4% YoY through November. Will the core inflation rate increase in 2021? Will too much inflation be a concern in 2021?
6) Monetary Policy: The Fed cut rates to zero in 2020 in response to the pandemic, and has signaled they will be on hold for some time. Will the Fed raise rates in 2021? Will the Fed end - or taper - the asset purchase program?
7) Residential Investment: Residential investment (RI) was solid in 2020, and housing was a strong sector during the pandemic. Through November, starts were up 7.0% year-over-year compared to the same period in 2019. New home sales were up 19.1% year--to-date through November. Note: RI is mostly investment in new single family structures, multifamily structures, home improvement and commissions on existing home sales. How much will RI increase in 2021? How about housing starts and new home sales in 2021?
8) House Prices: It appears house prices - as measured by the national repeat sales index (Case-Shiller, CoreLogic) - will be up around 8% to 9% in 2020. What will happen with house prices in 2021?
9) Housing Inventory: Housing inventory decreased sharply in 2020 to record lows. Will inventory increase as the pandemic subsides, or will inventory decrease further in 2021?
10) Economic Scarring: Some sectors were hit especially hard during the pandemic, like travel (hotels, airlines, cruise ships), and entertainment (restaurants, theaters, concerts). Also some areas of Commercial Real Estate (retail, hotels, offices) might suffer long term damage. How much damage did the pandemic do to certain sectors?
Some thoughts:
• Question #1 for 2021: How much will the economy grow in 2021?
• Question #2 for 2021: Will all the jobs lost in 2020 return in 2021, or will job growth be sluggish?
• Question #3 for 2021: What will the unemployment rate be in December 2021?
• Question #4 for 2021: Will the overall participation rate increase to pre-pandemic levels (63.4% in February 2020) , or will it will only partially recover in 2021?
• Question #5 for 2021: Will the core inflation rate increase in 2021? Will too much inflation be a concern in 2021?
• Question #6 for 2021: Will the Fed raise rates in 2021? What about the asset purchase program?
• Question #7 for 2021: How much will RI increase in 2021? How about housing starts and new home sales in 2021?
• Question #8 for 2021: What will happen with house prices in 2021?
• Question #9 for 2021: Will inventory increase as the pandemic subsides, or will inventory decrease further in 2021?
• Question #10 for 2021: How much damage did the pandemic do to certain sectors?
A Christmas Present for UberNerds
by Calculated Risk on 12/25/2020 08:11:00 AM
NOTE: If you are not familiar with Tanta, please read about her here. You will be happy you did - she was amazing.
A special present for UberNerds - an unpublished Tanta post written Dec 31, 2007: (I did post this for Christmas once before)
And from Tanta's 2007 Post: A Very Nerdy Christmas (see her post for an explanation of the origins of the Mortgage Pig™)Pig Rulz
There have been some misconceptions in the comments about Mortgage Pig™. I do not wish to enter a new year on the wrong track.
Mortgage Pig™ does not have a "name" except Mortgage Pig™. Assertions about Mortgage Pig™'s "name," "address," "job," "significant other," or favorite swill are not canonical. Anyone who asserts knowledge of such things in any communication, written or otherwise, is creating an Internet Urban Legend. Next thing you know they'll be telling you that you can Get Rich Qwik in RE investing.

Happy Holidays to all! CR
Thursday, December 24, 2020
December 24 COVID-19 Test Results; Record Hospitalizations
by Calculated Risk on 12/24/2020 07:16:00 PM
Note: Expect a dip in the data over the holidays. The week-over-week growth in positive cases has slowed. Hopefully that continues.
The US is now averaging close to 2 million tests per day. Based on the experience of other countries, for adequate test-and-trace (and isolation) to reduce infections, the percent positive needs to be under 5% (probably close to 1%), so the US has far too many daily cases - and percent positive - to do effective test-and-trace.
There were 1,889,205 test results reported over the last 24 hours.
There were 199,375 positive tests.
Almost 61,000 US deaths have been reported so far in December, surpassing April as the deadliest month. See the graph on US Daily Deaths here.
 Click on graph for larger image.
This data is from the COVID Tracking Project.
The percent positive over the last 24 hours was 10.6% (red line is 7 day average). The percent positive is calculated by dividing positive results by total tests (including pending).
And check out COVID Act Now to see how each state is doing. (updated link to new site)
 The second graph shows the 7 day average of positive tests reported and daily hospitalizations.
• Record Hospitalizations
Hotels: Occupancy Rate Declined 26.4% Year-over-year
by Calculated Risk on 12/24/2020 02:23:00 PM
From HotelNewsNow.com: STR US hotel results for week ending 19 December
U.S. weekly hotel occupancy decreased slightly from the previous week, according to the latest data from STR through 19 December.The following graph shows the seasonal pattern for the hotel occupancy rate using the four week average.
13-19 December 2020 (percentage change from comparable week in 2019):
• Occupancy: 36.8% (-26.4%)
• Average daily rate (ADR): US$85.50 (-21.9%)
• Revenue per available room (RevPAR): US$31.45 (-42.5%)
The industry also surpassed one billion unsold room nights for the first time on record.
emphasis added
 Click on graph for larger image.
The red line is for 2020, dash light blue is 2019, blue is the median, and black is for 2009 (the worst year since the Great Depression for hotels - before 2020).
Seasonally we'd expect the occupancy rate to decline into the new year.
Note: Y-axis doesn't start at zero to better show the seasonal change.
Since there is a seasonal pattern to the occupancy rate - see graph above - we can track the year-over-year change in occupancy to look for any improvement. This table shows the year-over-year change since the week ending Sept 19, 2020:
This suggests no improvement over the last 3 months.
| Week Ending | YoY Change, Occupancy Rate |
|---|---|
| 9/19 | -31.9% |
| 9/26 | -31.5% |
| 10/3 | -29.6% |
| 10/10 | -29.2% |
| 10/17 | -30.7% |
| 10/24 | -31.7% |
| 10/31 | -29.0% |
| 11/7 | -35.9% |
| 11/14 | -32.7% |
| 11/21 | -32.6% |
| 11/28 | -28.5% |
| 12/5 | -37.9% |
| 12/12 | -37.4% |
| 12/19 | -26.4% |
Review: Ten Economic Questions for 2020
by Calculated Risk on 12/24/2020 09:37:00 AM
Every year, I've posted a disclaimer that a recession could be caused by "An exogenous event such as a pandemic, significant military conflict, disruption of energy supplies for any reason, a major natural disaster (meteor strike, super volcano, etc), and a number of other low probability reasons" (emphasis added).
Unfortunately 2020 saw one of those "low probability" events, and many of my predictions weren't even close. In a way, this is the point of the predictions. I don't have a crystal ball, but I think it helps to outline what I think will happen - and understand - and change my mind, when the outlook is wrong. As an example, when the pandemic hit, I switched from being mostly positive on the economy to calling a recession in early March.
At the end of last year, I posted Ten Economic Questions for 2020. I followed up with a brief post on each question. Here is review (we don't have all data yet, but enough). I've linked to my posts from the beginning of the year, with a brief excerpt and a few comments:
10) Question #10 for 2020: Will housing inventory increase or decrease in 2020?
"Since I don't expect any change in fiscal policy during an election year, and monetary policy appears to be on hold - and I don't expect either a strong pickup in the economy (and higher rates) or an economic slump - it seems likely inventory will remain at about the same level through 2020."According to the November NAR report on existing home sales, inventory was down 22% year-over-year in November, and the months-of-supply was at a record low 2.3 months. In 2020, inventory really declined due to a combination of potential sellers keeping their properties off the market during a pandemic, and a pickup in buying due to record low mortgage rates, a move away from multi-family rentals and strong second home buying (to escape the high-density cities).
9) Question #9 for 2020: What will happen with house prices in 2020?
"If inventory remains at close to the same level, it seems likely that price appreciation will increase from the 2019 pace to the mid-single digits."The CoreLogic data for October showed prices up 7.3% year-over-year. The September Case-Shiller data showed prices up 7.0% YoY. With inventory lower than expected, house prices picked up more than expected.
8) Question #8 for 2020: How much will RI increase in 2020? How about housing starts and new home sales in 2020?
"My sense is the pickup that happened in the second half of 2019 will continue, and my guess is starts will be up year-over-year in 2020 by mid-to-high single digits. My guess is new home sales will be over 700 thousand in 2020 (for the first time since 2007) and will also be up mid-to-high single digits."Through November, starts were up 7.0% year-over-year compared to the same period in 2019. New home sales were up 19.1% year--to-date through November. Even with the pandemic, my guess was pretty close on starts - but new home sales were up much more than expected.
7) Question #7 for 2020: Will the Fed cut or raise rates in 2020, and if so, by how much?
"My guess is the Fed will stay on hold in 2020 and the FOMC will keep the federal funds rate at 1‑1/2 to 1-3/4 percent."With the onset of the pandemic, the Fed lowered rates to zero in March:
"In light of these developments, the Committee decided to lower the target range for the federal funds rate to 0 to 1/4 percent."6) Question #6 for 2020: Will the core inflation rate rise in 2020? Will too much inflation be a concern in 2020?
"although I think core PCE inflation (year-over-year) will increase a little in 2020 (from the current 1.6%), I think too much inflation will still not be a serious concern in 2020."According to the November Personal Income and Outlays report, the November PCE price index increased 1.1 percent year-over-year and the November PCE price index, excluding food and energy, increased 1.4 percent year-over-year. Inflation was lower than expected, and definitely not a concern in 2020.
5) Question #5 for 2020: How much will wages increase in 2020?
I expect to see some further increases in both the Average hourly earning from the CES, and in the Atlanta Fed Wage Tracker. Perhaps nominal wages will increase to the mid 3% range in 2020 according to the CES.With the pandemic, and the layoffs of many lower wage employees, the wage data isn't very useful in 2020.
4) Question #4 for 2020: Will the overall participation rate start declining in 2020, or will it move more sideways (or slightly up) in 2020?
I expect the overall participation rate to decline in 2020 to just under 63% by the end of the year.The participation rate declined sharply with the pandemic, and the Labor Force Participation Rate was at 61.5% in November.
3) Question #3 for 2020: What will the unemployment rate be in December 2020?
it appears the unemployment rate will decline into the low 3's by December 2020 from the current 3.5%The unemployment rate increased sharply with the pandemic, and the unemployment rates was at 6.7% in November.
2) Question #2 for 2020: Will job creation in 2020 be as strong as in 2019?
"my forecast is for gains of around 125,000 to 150,000 payroll jobs per month in 2020 (about 1.5 million to 1.8 million year-over-year) . This would be the fewest job gains since 2010, but another solid year for employment gains given current demographics."Employment decreased sharply with the pandemic, and in November the year-over-year change was negative 9.19 million jobs.
1) Question #1 for 2020: How much will the economy grow in 2020?
These factors suggest real GDP growth probably in the 2% to 2.5% range in 2020.With the pandemic, it appears GDP will be down around 2.5% to 3.0% in 2020.
In 2020, with the impact of the pandemic, many of my predictions weren't close - especially employment and GDP.
Wednesday, December 23, 2020
December 23 COVID-19 Test Results; Record Hospitalizations, December Now Deadliest Month
by Calculated Risk on 12/23/2020 07:04:00 PM
Note: The week-over-week growth in positive cases has slowed. Hopefully that continues.
The US is now averaging close to 2 million tests per day. Based on the experience of other countries, for adequate test-and-trace (and isolation) to reduce infections, the percent positive needs to be under 5% (probably close to 1%), so the US has far too many daily cases - and percent positive - to do effective test-and-trace.
There were 1,749,021 test results reported over the last 24 hours.
There were 220,834 positive tests.
Almost 58,000 US deaths have been reported so far in December, surpassing April as the deadliest month. See the graph on US Daily Deaths here.
 Click on graph for larger image.
This data is from the COVID Tracking Project.
The percent positive over the last 24 hours was 12.6% (red line is 7 day average). The percent positive is calculated by dividing positive results by total tests (including pending).
And check out COVID Act Now to see how each state is doing. (updated link to new site)
 The second graph shows the 7 day average of positive tests reported and daily hospitalizations.
• Record Hospitalizations
A few Comments on November New Home Sales
by Calculated Risk on 12/23/2020 12:23:00 PM
New home sales for November were reported at 841,000 on a seasonally adjusted annual rate basis (SAAR). Sales for the previous three months were revised down sharply.
This was well below consensus expectations of 990,000, but sales were still up 20.8% from November 2019. The last five months were the highest sales rates since 2006.
Clearly low mortgages rates, low existing home supply, and low sales in March and April (due to the pandemic) have led to a strong increase in sales. Favorable demographics (something I wrote about many times over the last decade) and a surging stock market have probably helped new home sales too.
Another factor in the strong headline sales rate over the last several months was the delay in the selling season. Usually the strongest sales are in the March to June time frame, but this year the strongest sales months were later in the year - so the usually seasonal factors boosted sales in late Summer and Fall.
Earlier: New Home Sales decrease to 841,000 Annual Rate in November.
 Click on graph for larger image.
This graph shows new home sales for 2019 and 2020 by month (Seasonally Adjusted Annual Rate).
New home sales were up 20.8% year-over-year (YoY) in November. Year-to-date (YTD) sales are up 19.1% (This is even above my optimistic forecast for 2020!).
And on inventory: since new home sales are reported when the contract is signed - even if the home hasn't been started - new home sales are not limited by inventory (except if no lots are available). Inventory for new home sales is important in that it means there will be more housing starts if inventory is low (like right now) - and fewer starts if inventory is too high (not now).
New Home Sales decrease to 841,000 Annual Rate in November
by Calculated Risk on 12/23/2020 10:14:00 AM
The Census Bureau reports New Home Sales in November were at a seasonally adjusted annual rate (SAAR) of 841 thousand.
The previous three months were revised down sharply.
Sales of new single-family houses in November 2020 were at a seasonally adjusted annual rate of 841,000, according to estimates released jointly today by the U.S. Census Bureau and the Department of Housing and Urban Development. This is 11.0 percent below the revised October rate of 945,000, but is 20.8 percent above the November 2019 estimate of 696,000.
emphasis added
 Click on graph for larger image.
The first graph shows New Home Sales vs. recessions since 1963. The dashed line is the current sales rate.
The last five months saw the highest sales rates since 2006. This is strong year-over-year growth.
The second graph shows New Home Months of Supply.
 The months of supply was increased in November to 4.1 months from 3.5 months in October.
 The all time record high was 12.1 months of supply in January 2009. The all time record low is 3.5 months, most recently in September 2020.
This is at the low end of the normal range (about 4 to 6 months supply is normal).
"The seasonally-adjusted estimate of new houses for sale at the end of November was 286,000. This represents a supply of 4.1 months at the current sales rate. "
 On inventory, according to the Census Bureau:
 "A house is considered for sale when a permit to build has been issued in permit-issuing places or work has begun on the footings or foundation in nonpermit areas and a sales contract has not been signed nor a deposit accepted."Starting in 1973 the Census Bureau broke this down into three categories: Not Started, Under Construction, and Completed.
The third graph shows the three categories of inventory starting in 1973.
The inventory of completed homes for sale is low, and the combined total of completed and under construction is lower than normal.
 The last graph shows sales NSA (monthly sales, not seasonally adjusted annual rate).
In November 2020 (red column), 55 thousand new homes were sold (NSA). Last year, 50 thousand homes were sold in November.
The all time high for November was 86 thousand in 2005, and the all time low for November was 20 thousand in 2010.
This was well below expectations and sales in the three previous months were revised down sharply. I'll have more later today.
Personal Income decreased 1.1% in November, Spending decreased 0.4%
by Calculated Risk on 12/23/2020 08:51:00 AM
The BEA released the Personal Income and Outlays report for November:
Personal income decreased $221.8 billion (1.1 percent) in November according to estimates released today by the Bureau of Economic Analysis. Disposable personal income (DPI) decreased $218.0 billion (1.2 percent) and personal consumption expenditures (PCE) decreased $63.3 billion (0.4 percent).The decrease in personal income was below expectations, and the decrease in PCE was also below expectations
Real DPI decreased 1.3 percent in November and Real PCE decreased 0.4 percent. The PCE price index had no change. Excluding food and energy, the PCE price index had no change .
The November PCE price index increased 1.1 percent year-over-year and the November PCE price index, excluding food and energy, increased 1.4 percent year-over-year.
The following graph shows real Personal Consumption Expenditures (PCE) since January 2019 through November 2020 (2012 dollars). Note that the y-axis doesn't start at zero to better show the change.
 Click on graph for larger image.
The dashed red lines are the quarterly levels for real PCE.
Using the two-month method to estimate Q4 PCE growth, PCE was increasing at a 6.8% annual rate in Q4 2020. (using the mid-month method, PCE was increasing at 4.0%). However, it appears the economy contracted in December - so PCE growth could be lower than 4%.
Weekly Initial Unemployment Claims decreased to 803,000
by Calculated Risk on 12/23/2020 08:37:00 AM
The DOL reported:
In the week ending December 19, the advance figure for seasonally adjusted initial claims was 803,000, a decrease of 89,000 from the previous week's revised level. The previous week's level was revised up by 7,000 from 885,000 to 892,000. The 4-week moving average was 818,250, an increase of 4,000 from the previous week's revised average. The previous week's average was revised up by 1,750 from 812,500 to 814,250.This does not include the 397,511 initial claims for Pandemic Unemployment Assistance (PUA) that was down from 454,471 the previous week.
emphasis added
The following graph shows the 4-week moving average of weekly claims since 1971.
 Click on graph for larger image.
The dashed line on the graph is the current 4-week average. The four-week average of weekly unemployment claims increased to 818,250.
The previous week was revised up.
The second graph shows seasonally adjust continued claims since 1967 (lags initial by one week).
 At the worst of the Great Recession, continued claims peaked at 6.635 million, but then steadily declined.
Continued claims decreased to 5,457,870 (SA) from 5,766,196 (SA) last week and will likely stay at a high level until the crisis abates.
Note: There are an additional 9,271,112 receiving Pandemic Unemployment Assistance (PUA) that increased from 9,244,556 the previous week (there are questions about these numbers). This is a special program for business owners, self-employed, independent contractors or gig workers not receiving other unemployment insurance.
An additional 4,793,230 are receiving Pandemic Emergency Unemployment Compensation (PEUC) that decreased from 4,801,408 the previous week.
This was lower than expected.
MBA: Mortgage Applications Increase in Latest Weekly Survey
by Calculated Risk on 12/23/2020 07:00:00 AM
From the MBA: Mortgage Applications Increase in Latest MBA Weekly Survey
Mortgage applications increased 0.8 percent from one week earlier, according to data from the Mortgage Bankers Association’s (MBA) Weekly Mortgage Applications Survey for the week ending December 18, 2020.
... The Refinance Index increased 4 percent from the previous week and was 124 percent higher than the same week one year ago. The seasonally adjusted Purchase Index decreased 5 percent from one week earlier. The unadjusted Purchase Index decreased 7 percent compared with the previous week and was 26 percent higher than the same week one year ago.
“Mortgage rates are closing the year at record lows. The 30-year fixed rate – at 2.86 percent – is a full percentage point below a year ago. Last week’s increase in refinance applications was driven by FHA and VA activity, while conventional refinances saw a slight decline. Overall refinance activity was 124 percent higher than in 2019, as borrowers continue to seek lower monthly payments or different loan terms,” said Joel Kan, MBA’s Associate Vice President of Economic and Industry Forecasting. “Purchase applications decreased for the second time in three weeks, as both conventional and government applications saw a drop-off. Despite the decline, purchase applications remained 26 percent higher than the same week a year ago, and the average loan balance reached another record high.”
Added Kan, “There are still signs of relative strength in the housing market as 2020 ends. However, housing affordability will be worth monitoring next year. The lower loan size segment of the market – particularly for entry-level and first-time buyers – continues to be impacted by rapidly increasing home prices and tight inventory.”
...
The average contract interest rate for 30-year fixed-rate mortgages with conforming loan balances ($510,400 or less) increased to 2.86 percent from 2.85 percent, with points remaining unchanged at 0.33 (including the origination fee) for 80 percent loan-to-value ratio (LTV) loans.
emphasis added
 Click on graph for larger image.
The first graph shows the refinance index since 1990.
The refinance index has been very volatile recently depending on rates and liquidity.
But with record low rates, the index remains up significantly from last year.
 The second graph shows the MBA mortgage purchase index
According to the MBA, purchase activity is up 26% year-over-year unadjusted.
Note: Red is a four-week average (blue is weekly).
Tuesday, December 22, 2020
Wednesday: New Home Sales, Unemployment Claims, Personal Income & Outlays and more
by Calculated Risk on 12/22/2020 09:11:00 PM
Wednesday:
• At 7:00 AM ET, The Mortgage Bankers Association (MBA) will release the results for the mortgage purchase applications index.
• At 8:30 AM, The initial weekly unemployment claims report will be released. The consensus is for 900,000 initial claims, up from 885,000 last week.
• Also at 8:30 AM, Durable Goods Orders for November. The consensus is for a 0.6% increase in durable goods.
• Also at 8:30 AM, Personal Income and Outlays for November. The consensus is for a 0.2% decrease in personal income, and for a 0.1% decrease in personal spending. And for the Core PCE price index to increase 0.1%.
• At 10:00 AM, New Home Sales for November from the Census Bureau. The consensus is for 990 thousand SAAR, down from 999 thousand in October.
• At 10:00 AM, University of Michigan's Consumer sentiment index (Final for December). The consensus is for a reading of 81.0.
December 22 COVID-19 Test Results; Record Hospitalizations, Record 7-Day Deaths
by Calculated Risk on 12/22/2020 08:26:00 PM
Note: The week-over-week growth in positive cases has slowed. Hopefully that continues.
The US is now averaging close to 2 million tests per day. Based on the experience of other countries, for adequate test-and-trace (and isolation) to reduce infections, the percent positive needs to be under 5% (probably close to 1%), so the US has far too many daily cases - and percent positive - to do effective test-and-trace.
There were 1,688,785 test results reported over the last 24 hours.
There were 188,614 positive tests.
Over 54,000 US deaths have been reported so far in December. See the graph on US Daily Deaths here.
 Click on graph for larger image.
This data is from the COVID Tracking Project.
The percent positive over the last 24 hours was 11.2% (red line is 7 day average). The percent positive is calculated by dividing positive results by total tests (including pending).
And check out COVID Act Now to see how each state is doing. (updated link to new site)
 The second graph shows the 7 day average of positive tests reported and daily hospitalizations.
• Record Hospitalizations
• Record 7 Day Average Deaths
Freddie Mac: Mortgage Serious Delinquency Rate decreased in November
by Calculated Risk on 12/22/2020 05:46:00 PM
Freddie Mac reported that the Single-Family serious delinquency rate in November was 2.75%, down from 2.89% in October. Freddie's rate is up from 0.62% in November 2019.
Freddie's serious delinquency rate peaked in February 2010 at 4.20%.
These are mortgage loans that are "three monthly payments or more past due or in foreclosure".
 Click on graph for larger image
Mortgages in forbearance are being counted as delinquent in this monthly report, but they will not be reported to the credit bureaus.
This is very different from the increase in delinquencies following the housing bubble. Lending standards have been fairly solid over the last decade, and most of these homeowners have equity in their homes - and they will be able to restructure their loans once (if) they are employed.
Note: Fannie Mae will report for November soon.
Also - for multifamily - delinquencies were at 0.16%, up from 0.14% in October, and up more than double from 0.06% in November 2019.
NMHC: Rent Payment Tracker Shows Households Paying Rent Decreased 3.4% YoY
by Calculated Risk on 12/22/2020 03:22:00 PM
From the NMHC: NMHC Rent Payment Tracker Finds 89.8 Percent of Apartment Households Paid Rent as of December 20
The National Multifamily Housing Council (NMHC)’s Rent Payment Tracker found 89.8 percent of apartment households made a full or partial rent payment by December 20 in its survey of 11.5 million units of professionally managed apartment units across the country.
This is a 3.4 percentage point, or 392,952 household decrease from the share who paid rent through December 20, 2019 and compares to 90.3 percent that had paid by November 20, 2020. These data encompass a wide variety of market-rate rental properties across the United States, which can vary by size, type and average rental price.
emphasis added
This graph from the NMHC Rent Payment Tracker shows the percent of household making full or partial rent payments by the 6th (dark color) and 20th (light color) of the month.
This is mostly for large, professionally managed properties.
The new disaster relief should help people make their rent payments.
Comments on November Existing Home Sales
by Calculated Risk on 12/22/2020 12:22:00 PM
Earlier: NAR: Existing-Home Sales Decreased to 6.69 million in November
A few key points:
1) This was the highest sales rate for November since 2005. Some of the increase over the last several months was probably related to pent up demand from the shutdowns in March and April. Other reasons include record low mortgage rates, a move away from multi-family rentals, strong second home buying (to escape the high-density cities) and favorable demographics.
The delay in the buying season has pushed the seasonally adjusted number to very high levels. For example, this number of sales, Not Seasonally Adjusted (NSA) in August, would have given a 5 million Seasonally Adjusted Annual Rate (SAAR), as opposed to 6.7 million. So the delay in the buying season is a factor in the headline number being so high.
2) Inventory is very low, and was down 22% year-over-year (YoY) in November. This is the lowest level of inventory for November since at least the early 1990s. Months-of-supply is at a record low. Inventory will be important to watch in 2021, see: Some thoughts on Housing Inventory
 Click on graph for larger image.
This graph shows existing home sales by month for 2019 and 2020.
Note that existing home sales picked up somewhat in the second half of 2019 as interest rates declined.
Even with weak sales in April, May, and June, sales to date are up about 4% compared to the same period in 2019.
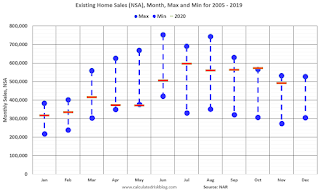 The second graph shows existing home sales Not Seasonally Adjusted (NSA) by month (Red dashes are 2020), and the minimum and maximum for 2005 through 2019.
Sales NSA in November (492,000) were 22% above sales last year in November (404,000). This was the highest sales for November (NSA) since 2005.
There are going to be some difficult comparisons in the second half of next year!
2) Inventory is very low, and was down 22% year-over-year (YoY) in November. This is the lowest level of inventory for November since at least the early 1990s. Months-of-supply is at a record low. Inventory will be important to watch in 2021, see: Some thoughts on Housing Inventory
 Click on graph for larger image.
This graph shows existing home sales by month for 2019 and 2020.
Note that existing home sales picked up somewhat in the second half of 2019 as interest rates declined.
Even with weak sales in April, May, and June, sales to date are up about 4% compared to the same period in 2019.
 The second graph shows existing home sales Not Seasonally Adjusted (NSA) by month (Red dashes are 2020), and the minimum and maximum for 2005 through 2019.
Sales NSA in November (492,000) were 22% above sales last year in November (404,000). This was the highest sales for November (NSA) since 2005.
NAR: Existing-Home Sales Decreased to 6.69 million in November
by Calculated Risk on 12/22/2020 10:14:00 AM
From the NAR: Existing-Home Sales Decrease 2.5% in November
Total existing-home sales, completed transactions that include single-family homes, townhomes, condominiums and co-ops, decreased 2.5% from October to a seasonally-adjusted annual rate of 6.69 million in November. However, sales in total rose year-over-year, up 25.8% from a year ago (5.32 million in November 2019).
...
Total housing inventory at the end of November totaled 1.28 million units, down 9.9% from October and down 22% from one year ago (1.64 million). Unsold inventory sits at an all-time low 2.3-month supply at the current sales pace, down from 2.5 months in October and down from the 3.7-month figure recorded in November 2019.
emphasis added
 Click on graph for larger image.
This graph shows existing home sales, on a Seasonally Adjusted Annual Rate (SAAR) basis since 1993.
Sales in November (6.69 million SAAR) were down 2.5% from last month, and were 25.8% above the November 2019 sales rate.
The second graph shows nationwide inventory for existing homes.
 According to the NAR, inventory decreased to 1.28 million in November from 1.42 million in October. Headline inventory is not seasonally adjusted, and inventory usually decreases to the seasonal lows in December and January, and peaks in mid-to-late summer.
The last graph shows the year-over-year (YoY) change in reported existing home inventory and months-of-supply. Since inventory is not seasonally adjusted, it really helps to look at the YoY change. Note: Months-of-supply is based on the seasonally adjusted sales and not seasonally adjusted inventory.
 Inventory was down 22% year-over-year in November compared to November 2019.
 Months of supply decreased to 2.3 months in November (an all time low).
This was close to the consensus forecast. I'll have more later.


