 RSS Feed
 by Calculated Risk on 12/24/2019 12:41:00 PM
Tuesday, December 24, 2019
Question #10 for 2020: Will housing inventory increase or decrease in 2020?
Earlier I posted some questions for next year: Ten Economic Questions for 2020. I'm adding some thoughts, and maybe some predictions for each question.
10) Housing Inventory: Housing inventory decreased in 2019 after increasing in 2018. Will inventory increase or decrease in 2020?
Tracking housing inventory is very helpful in understanding the housing market. The plunge in inventory in 2011 helped me call the bottom for house prices in early 2012 (The Housing Bottom is Here). And the increase in inventory in late 2005 (see red arrow on first graph below) helped me call the top for house prices in 2006.
Earlier in 2019, when several commentators were bearish on housing, I pointed out there was no sharp increase in housing inventory (like in 2005), and that was one of the reasons I remained optimistic on housing and the economy (correctly!).
This graph shows nationwide inventory for existing homes through November 2019.
 Click on graph for larger image.
According to the NAR, inventory decreased to 1.64 million in November from 1.77 million in October. And inventory in November was down from 1.74 million in November 2018.
Inventory is not seasonally adjusted, and usually inventory decreases from the seasonal high in mid-summer to the seasonal lows in December and January as sellers take their homes off the market for the holidays.
Note that inventory is at about the same level as in November 2017, and still 20% below the levels for November 2014 and 2015.
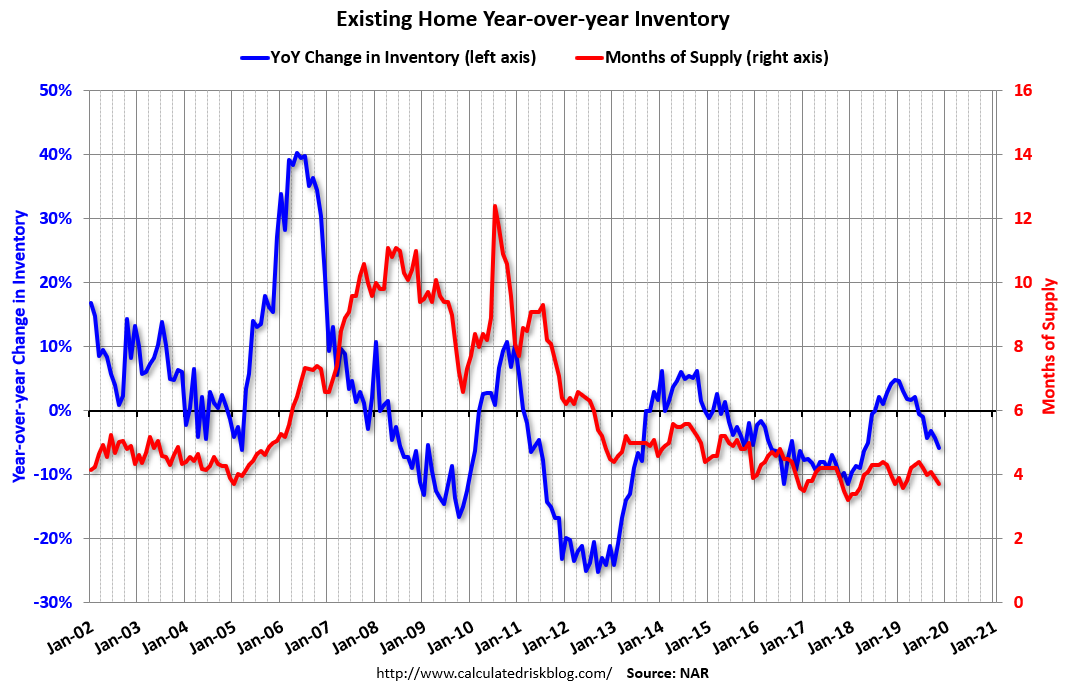 The second graph shows the year-over-year (YoY) change in reported existing home inventory and months-of-supply. Note: Months-of-supply is based on the seasonally adjusted sales and not seasonally adjusted inventory.
Inventory was down 5.7% year-over-year in November compared to November 2018. Months of supply decreased to 3.7 months in November.
Housing inventory increased YoY in 2018 due to a combination of higher mortgage rates and the new tax law. With lower mortgage rates, inventory decreased YoY at the end of 2019.
Inventory is always something to watch. If inventory increases sharply, house price growth will slow, and if inventory drops sharply, house price growth will pickup.
Since I don't expect any change in fiscal policy during an election year, and monetary policy appears to be on hold - and I don't expect either a strong pickup in the economy (and higher rates) or an economic slump - it seems likely inventory will remain at about the same level through 2020.
Here are the Ten Economic Questions for 2020 and a few predictions:
• Question #1 for 2020: How much will the economy grow in 2020?
• Question #2 for 2020: Will job creation in 2020 be as strong as in 2019?
• Question #3 for 2020: What will the unemployment rate be in December 2020?
• Question #4 for 2020: Will the overall participation rate start declining in 2020, or will it move more sideways (or slightly up) in 2020?
• Question #5 for 2020: How much will wages increase in 2020?
• Question #6 for 2020: Will the core inflation rate rise in 2020? Will too much inflation be a concern in 2020?
• Question #7 for 2020: Will the Fed cut or raise rates in 2020, and if so, by how much?
• Question #8 for 2020: How much will RI increase in 2020? How about housing starts and new home sales in 2020?
• Question #9 for 2020: What will happen with house prices in 2020?
• Question #10 for 2020: Will housing inventory increase or decrease in 2020?


