 RSS Feed
 by Calculated Risk on 12/30/2020 11:41:00 AM
Wednesday, December 30, 2020
Question #7 for 2021: How much will RI increase in 2021? How about housing starts and new home sales in 2021?
Earlier I posted some questions for next year: Ten Economic Questions for 2021. I'm adding some thoughts, and maybe some predictions for each question.
7) Residential Investment: Residential investment (RI) was solid in 2020, and housing was a strong sector during the pandemic. Through November, starts were up 7.0% year-over-year compared to the same period in 2019. New home sales were up 19.1% year--to-date through November. Note: RI is mostly investment in new single family structures, multifamily structures, home improvement and commissions on existing home sales. How much will RI increase in 2021? How about housing starts and new home sales in 2021?
First a graph of RI as a percent of Gross Domestic Product (GDP) through Q3 2020:
 Click on graph for larger image.
Residential investment (RI) increased at a 59.3% annual rate in Q3. And RI, as percent of GDP, increased sharply in Q3.
We don't have the data yet for Q4 2020 yet, but it appears RI will make a strong contribution to GDP in 2020.
Note that RI as a percent of GDP is still fairly low and not far above the lows of previous recessions.
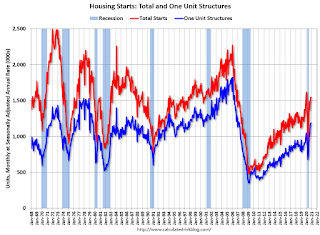 The second graph shows total and single family housing starts through November 2020.
Starts, year-to-date, are up 7.0% compared to the same period in 2019. Note that starts were up solidly prior to the pandemic, and then bounced back strong.
Even after the significant increase over the last several years, and the solid increase in 2020, the approximately 1.38 million housing starts in 2020 will still be the 34th highest on an annual basis since the Census Bureau started tracking starts in 1959 (34 out of 62 total years - middle of the pack).
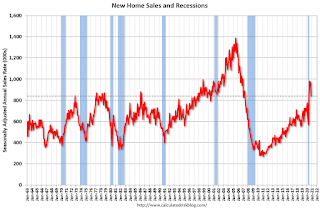 The third graph shows New Home Sales since 1963 through November 2020. The dashed line is the November sales rate.
New home sales in 2020, through November, were up 19.1% compared to the same period in 2019. This will be the strongest year for new home sales since 2006.
Clearly low mortgages rates, low existing home supply, and low sales in March and April (due to the pandemic) have led to a strong increase in sales. Favorable demographics and a surging stock market have probably helped new home sales too.
Here is a table showing housing starts and new home sales since 2005. No one should expect an increase to 2005 levels, however demographics and household formation suggest starts will increase further this cycle.
Most analysts are looking for starts and new home sales to increase further in 2021. For example, Fannie Mae expects new home sales to increase to 872 thousand, and the MBA is forecasting 960 thousand in 2021.
Here is a table showing housing starts and new home sales since 2005. No one should expect an increase to 2005 levels, however demographics and household formation suggest starts will increase further this cycle.
| Housing Starts and New Home Sales (000s) | ||||
|---|---|---|---|---|
| Housing Starts | Change | New Home Sales | Change | |
| 2005 | 2,068 | --- | 1,283 | --- |
| 2006 | 1,801 | -12.9% | 1,051 | -18.1% |
| 2007 | 1,355 | -24.8% | 776 | -26.2% |
| 2008 | 906 | -33.2% | 485 | -37.5% |
| 2009 | 554 | -38.8% | 375 | -22.7% |
| 2010 | 587 | 5.9% | 323 | -13.9% |
| 2011 | 609 | 3.7% | 306 | -5.3% |
| 2012 | 781 | 28.2% | 368 | 20.3% |
| 2013 | 925 | 18.5% | 429 | 16.6% |
| 2014 | 1,003 | 8.5% | 437 | 1.9% |
| 2015 | 1,112 | 10.8% | 501 | 14.6% |
| 2016 | 1,174 | 5.6% | 561 | 12.0% |
| 2017 | 1,203 | 2.5% | 613 | 9.3% |
| 2018 | 1,249 | 3.9% | 617 | 0.7% |
| 2019 | 1,290 | 3.2% | 683 | 10.7% |
| 20201 | 1,380 | 7.0% | 810 | 18.6% |
| 12020 estimated | ||||
Most analysts are looking for starts and new home sales to increase further in 2021. For example, Fannie Mae expects new home sales to increase to 872 thousand, and the MBA is forecasting 960 thousand in 2021.
And for housing starts, Fannie Mae is forecasting 1.44 million, and Merrill Lynch is forecasting 1.50 million.
Note that New Home sales have averaged 941 thousand over the last five months on seasonally adjust annual rate (SAAR) basis. So most forecasts are for sales to be relatively flat relative to the last five months.
Note that New Home sales have averaged 941 thousand over the last five months on seasonally adjust annual rate (SAAR) basis. So most forecasts are for sales to be relatively flat relative to the last five months.
And housing starts have averaged 1.47 million over the same period. So once again, analysts are expecting starts to be at about the same level in 2021 as the last 5 months.
My guess is starts will be up year-over-year in 2021 by high single digits. However, my guess is new home sales will soften in the second half of 2021 (based on my expectation of more existing home inventory), and will be up mid single digits (a decline from the sales rate over the last 5 months). It is even possible that sales will be flat to slightly down in 2021, but that will depend on inventory and the course of the pandemic.
Here are the Ten Economic Questions for 2021 and a few predictions:
• Question #1 for 2021: How much will the economy grow in 2021?
• Question #2 for 2021: Will all the jobs lost in 2020 return in 2021, or will job growth be sluggish?
• Question #3 for 2021: What will the unemployment rate be in December 2021?
• Question #4 for 2021: Will the overall participation rate increase to pre-pandemic levels (63.4% in February 2020) , or will it will only partially recover in 2021?
• Question #5 for 2021: Will the core inflation rate increase in 2021? Will too much inflation be a concern in 2021?
• Question #6 for 2021: Will the Fed raise rates in 2021? What about the asset purchase program?
• Question #7 for 2021: How much will RI increase in 2021? How about housing starts and new home sales in 2021?
• Question #8 for 2021: What will happen with house prices in 2021?
• Question #9 for 2021: Will inventory increase as the pandemic subsides, or will inventory decrease further in 2021?
• Question #10 for 2021: How much damage did the pandemic do to certain sectors?


