 RSS Feed
 by Calculated Risk on 7/26/2010 02:20:00 PM
Monday, July 26, 2010
Survey shows house prices falling in June, but long wait for house price indexes
Campbell Surveys put out a press release this morning: Home Prices Tumble in Most Categories During June (no link)
A drop in homebuyer activity helped trigger a noticeable decline in home prices between May and June, according to the latest Campbell/Inside Mortgage Finance Monthly Survey of Real Estate Market Conditions.We already know existing home sales collapsed in July, however, as Popik notes, it will take some time for the impact on house prices to show up in the house price indexes.
...
Average prices tumbled by 6.8% for move-in ready foreclosed properties, 6.3% for short sales, and 4.6% for non-distressed properties.
...
“Prices are dropping…same house that had 2 showings a day in April with hopes of a closing by June at $139,000 now gets a showing of just one a week if we are lucky and at $129,000,” reported a real estate agent responding to the survey and located in Florida.
“Buyers just plan on deducting the $8,000 off what they are going to offer now. So, now prices are dropping to compensate for the credit not being available,” stated an agent located in Ohio.
...
“Contracts signed in June will be closing in July and August,” explained [Thomas Popik, research director for Campbell Surveys]. “That’s why we know prices for closed transactions will continue their decline. But this won’t be reflected in the publicly-released price indexes until October or November.”
The Case-Shiller index is a three month average and is released with a two month lag. The Case-Shiller house price index to be released tomorrow will be for a three month average ending in May.
The first Case-Shiller release with July prices will be released at the end of September - and that will include the months of May, June and July! And prices were probably up in May and June.
And prices don't fall overnight. Based on the timing of the above survey, prices fell from May to June - and those transactions will probably mostly closed in August. That is why Popik is saying the price declines will not show up in house price indexes until October of November.
The Corelogic data for July will also be released in September. There are other repeat sales measures (like from Radar Logic and Clear Capital), but in general it will be a long wait before reported house prices are falling.
Dallas Fed: Manufacturing Activity Remains Sluggish in July
by Calculated Risk on 7/26/2010 11:51:00 AM
Usually I don't post all the regional manufacturing surveys, however with the inventory adjustment over, export growth appearing to slow, and domestic consumer demand sluggish, these surveys might provide a hint of weakness in the manufacturing sector.
From the Dallas Fed: Texas Manufacturing Activity Remains Sluggish
Texas factory activity rebounded slightly in July, according to business executives responding to the Texas Manufacturing Outlook Survey. The production index, a key indicator of state manufacturing conditions, rose from –2 to 5, suggesting output expanded slightly in July after contracting in June.Although production was up slightly, new orders were down sharply. This was a weak report - I'll post a summary of the regional reports later this week.
Several indexes for factory activity continued to fall in July. The new orders and growth rate of orders indexes pushed deeper into negative territory, indicating a further contraction of demand. The index for capacity utilization dipped to –1, its first negative reading in nine months. The shipments index stabilized in July, rising from –9 to –1, with nearly equal shares of respondents noting an increase or decrease.
The general business activity index fell sharply to –21, its lowest level since July 2009. Thirty-one percent of firms reported a worsening of activity, up from 22 percent in June. The company outlook index also fell to a 12-month low, as only 13 percent of manufacturers said their outlook had improved over the previous month, compared with 24 percent who said it had worsened.
The employment index edged up and was positive for the fifth consecutive month, with 20 percent of firms reporting new hires.
New Home Sales: Worst June on Record
by Calculated Risk on 7/26/2010 10:00:00 AM
Ignore all the month to previous month comparisons. May was revised down sharply and that makes the increase look significant. Here is the bottom line: this was the worst June for new home sales on record.
The Census Bureau reports New Home Sales in June were at a seasonally adjusted annual rate (SAAR) of 330 thousand. This is an increase from the record low of 267 thousand in May (revised from 300 thousand).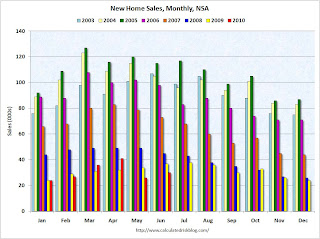 Click on graph for larger image in new window.
The first graph shows monthly new home sales (NSA - Not Seasonally Adjusted).
Note the Red columns for 2010. In June 2010, 30 thousand new homes were sold (NSA). This is a new record low for June.
The previous record low for the month of June was 34 thousand in 1982; the record high was 115 thousand in June 2005.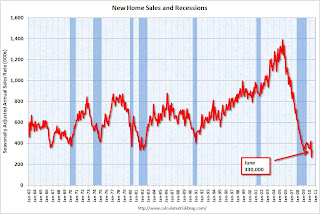 The second graph shows New Home Sales vs. recessions for the last 47 years.
Sales of new single-family houses in June 2010 were at a seasonally adjusted annual rate of 330,000 ... This is 23.6 percent (±15.3%) above the revised May rate of 267,000, but is 16.7 percent (±10.9%) below the June 2009 estimate of 396,000.And another long term graph - this one for New Home Months of Supply.
 Months of supply decreased to 7.6 in June from a revised 9.6 in May (revised from 8.5). The all time record was 12.4 months of supply in January 2009. This is still very high (less than 6 months supply is normal).
 The seasonally adjusted estimate of new houses for sale at the end of June was 210,000. This represents a supply of 7.6 months at the current sales rate.
 The final graph shows new home inventory.
 The 267 thousand annual sales rate for May is the all time record. This is a very sharp downward revision.
The 330 thousand in June is the worst June on record. With all the gyrations, it is difficult to see what is happening month to month, but overall this was a very weak report.
Chicago Fed: Economic activity declined in June
by Calculated Risk on 7/26/2010 08:30:00 AM
Note: This is a composite index based on a number of economic releases.
From the Chicago Fed: Index shows economic activity declined in June
Led by deterioration in production- and employment-related indicators, the Chicago Fed National Activity Index declined to –0.63 in June, down from +0.31 in May. Three of the four broad categories of indicators that make up the index made negative contributions in June, while the sales, orders, and inventories category made the lone positive contribution.
The index’s three-month moving average, CFNAI-MA3, decreased to –0.05 in June from +0.31 in May. The CFNAI-MA3 suggests that growth in national economic activity returned very close to its historical trend in June after reaching its highest level since March 2006 in May. With regard to inflation, it indicates subdued inflationary pressure from economic activity over the coming year.
 Click on table for larger image in new window.
This graph shows the Chicago Fed National Activity Index (three month moving average) since 1967. According to the Chicago Fed:
A zero value for the index indicates that the national economy is expanding at its historical trend rate of growth; negative values indicate below-average growth; and positive values indicate above-average growth.This is a compositive of other indicators. June was definitely a weak month.
Sunday, July 25, 2010
European Stress Tests: Not very stressful
by Calculated Risk on 7/25/2010 07:32:00 PM
It was announced last week that the stress tests didn't consider a sovereign default, and here is more ...
From David Enrich at the WSJ: Europe's 'Stress Tests' Relied on Mild Assumptions (ht jb)
In some of the 20 countries that conducted the tests, regulators figured that property values would keep rising or hold steady in a worst-case economic scenario.These are the two assumptions that put the most stress on households - lost jobs and negative equity. I guess in some European countries property prices only go up, and the unemployment rate only goes down.
In other cases, unemployment rates in a double-dip recession crept up by as little as 0.1 percentage point from the tests' so-called benchmark scenario, which is based on current economic conditions.
Earlier today: Weekly Summary and Schedule, July 25th
Yesterday: Sovereign default Part 5B. What Happens If Things Go Really Badly? More Things Can Go Badly: Credit Default Swaps, Interest Swaps and Options, Foreign Exchange
Private Investment?
by Calculated Risk on 7/25/2010 03:38:00 PM
The WSJ is quoting Treasury Secretary Timothy Geithner as saying it is time for private investment to take over from government stimulus:
“We need to make that transition now to a recovery led by private investment,” Mr. Geithner said Sunday on NBC’s “Meet the Press.”I discussed this last week - in most sectors of the economy there is over capacity or too much supply (housing), so there is no reason for significant new private investment.
...
“I think the most likely thing is you’ll see an economy that gradually strengthens over the next year or two, you’ll see job growth start to come back, investments expanding ... but we’ve got a long way to go still,” Mr. Geithner said.
Earlier today: Weekly Summary and Schedule, July 25th
Yesterday: Sovereign default Part 5B. What Happens If Things Go Really Badly? More Things Can Go Badly: Credit Default Swaps, Interest Swaps and Options, Foreign Exchange
Weekly Summary and Schedule, July 25th
by Calculated Risk on 7/25/2010 11:29:00 AM
The focus this week will be on the Q2 GDP report to be released on Friday. There are also two key housing reports: New Home Sales on Monday and Case-Shiller house prices on Tuesday.
On Monday, the June Chicago Fed National Activity Index will be released at 8:30 AM. This is a composite index of other data.
At 10 AM on Monday, the Census Bureau will release the New Home Sales report for June. The consensus is for a slight increase to 310 thousand at a seasonally adjusted annual rate (SAAR) from the record low 300 thousand in May.
Also on Monday, the Dallas Fed Manufacturing survey for July will be released at 10:30 AM. This is one of several regional surveys that will be released this week. Usually I don't highlight the minor regional reports, but right now I'm looking for hints of a slowdown in industrial production.
On Tuesday, the May Case-Shiller house price index will be released at 9:00 AM. The consensus is for a slight increase in the house price index. At 10:00 AM, the Conference Board will release Consumer Confidence for July (consensus is for a slight decrease from June). Also at 10:00 AM, the Richmond Fed Manufacturing Survey for July will be released.
Also at 10 AM Tuesday, the Census Bureau will release the Q2 Housing Vacancies and Homeownership report. This report provides the homeownership rate and estimates of the homeowner and rental vacancy rates.
On Wednesday, the MBA mortgage purchase index will be released. The purchase index is at the same level as in 1996 – suggesting further weakness in housing. Also on Wednesday, the June Durable Goods Orders will be released at 8:30 AM. The consensus is for a 1.0% increase.
Also on Wednesday, at 2 PM ET, the Fed will release the Beige Book for July. This will be closely scrutinized for further evidence of a 2nd half slowdown.
On Thursday, the initial weekly unemployment claims will be released. Consensus is for a decline to 460 thousand from 464 thousand last week. Also on Thursday, the Kansas City Fed Manufacturing survey will be released at 11 AM.
And on Friday, at 8:30 AM, the BEA will release the Q2 GDP report. The consensus is for real annualized GDP growth of 2.5% in Q2, down from a sluggish 2.7% in Q1. Also on Friday, the Chicago Purchasing Manager index for July will be released at 9:45 AM. And the FDIC will probably be busy on Friday afternoon ...
And a summary of last week:
 Click on graph for larger image in new window.
This graph shows existing home sales, on a Seasonally Adjusted Annual Rate (SAAR) basis since 1993.
Sales in June 2010 (5.37 million SAAR) were 5.1% lower than last month, and were 9.8% higher than June 2009 (4.89 million SAAR).
 The second graph shows nationwide inventory for existing homes.
According to the NAR, inventory increased to 3.99 million in June from 3.89 million in May. The all time record high was 4.58 million homes for sale in July 2008.
Months of supply increased to 8.9 months in June from 8.3 months in May. A normal market has under 6 months of supply, so this is already high - and probably excludes some substantial shadow inventory.
The next graph shows the year-over-year (YoY) change in reported existing home inventory and months-of-supply. Inventory is not seasonally adjusted, so it really helps to look at the YoY change.
 Inventory increased 4.7% YoY in June. This is the third consecutive month of a year-over-year increases in inventory, and this is the largest YoY increase since early 2008.
 This increase in inventory is especially bad news because the reported inventory is already historically very high, and the 8.9 months of supply in June is well above normal.
The months-of-supply will jump in July as sales collapse - probably to double digits - and a double digit months-of-supply would be a really bad sign for house prices ...
This was another a weak report. Sales were slightly above expectations (5.37 million at a seasonally adjusted annual rate vs. expectations of 5.3 million), but the YoY increase in inventory and the increase in months-of-supply are the real stories.
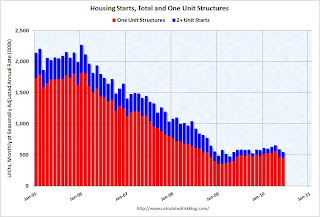 Total housing starts were at 549 thousand (SAAR) in June, down 5% from the revised May rate of 578,000 (revised down from 593 thousand), and up 15% from the all time record low in April 2009 of 477 thousand (the lowest level since the Census Bureau began tracking housing starts in 1959).
 Single-family starts declined 0.7% to 454,000 in June. This is 26% above the record low in January 2009 (360 thousand).
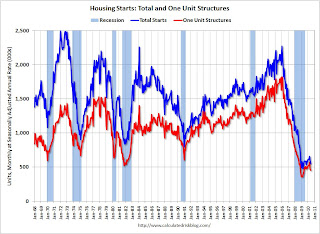 This graph shows total and single unit starts since 1968. This shows the huge collapse following the housing bubble, and that housing starts have mostly been moving sideways for over a year.
This was way below expectations of 580 thousand (I took the under!), and is good news for the housing market longer term (there are already too many housing units), but bad news for the economy and employment short term.
 This graph shows the builder confidence index from the National Association of Home Builders (NAHB).
The housing market index (HMI) was at 14 in June. This is the lowest level since April 2009.
The record low was 8 set in January 2009, but 14 is very low ...
Note: any number under 50 indicates that more builders view sales conditions as poor than good.
Note: This index is a leading indicator for new Commercial Real Estate (CRE) investment.
 This graph shows the Architecture Billings Index since 1996. The index has remained below 50, indicating falling demand, since January 2008.
Note: Nonresidential construction includes commercial and industrial facilities like hotels and office buildings, as well as schools, hospitals and other institutions.
This suggests the slump for commercial real estate design is ongoing. According to the AIA, there is an "approximate nine to twelve month lag time between architecture billings and construction spending" on non-residential construction. So there will probably be further declines in CRE investment into 2011.
Best wishes to all.
More State and Local Government Layoffs and the Pension Crisis
by Calculated Risk on 7/25/2010 08:36:00 AM
From Tom Abate at the San Fransicso Chronicle: Public pensions put state, cities in crisis
The recent layoff of 80 police officers in Oakland could be the harbinger of things to come ...The author argues that many of these layoffs are happening because pensions are straining state and local government budgets.
"This is not unique to Oakland," said Ron Cottingham, president of the Police Officers Research Association of California. "Stockton is having this happen. So is Sacramento."
The article contains some information on a recent scandal and the size of most pensions:
[T]he city of Bell (Los Angeles County) ... has been paying its city manager nearly $800,000 a year and setting him and other highly paid local officials up for huge pensions.The pension problem is a long term issue, but in the short term, the state and local government layoffs will contribute to the unemployment problem.
Scandals like this fuel public outrage and overshadow the reality that while abuses occur, and fatter pension payouts are on the rise, the average CalPERS beneficiary currently gets just over $24,000 a year, and 78 percent of all the fund's recipients get $36,000 or less.
Saturday, July 24, 2010
Charlie Rose: Geithner on Financial Regulatory Reform and Elizabeth Warren
by Calculated Risk on 7/24/2010 08:25:00 PM
Early today: Part 5B of Sovereign default series: What Happens If Things Go Really Badly? More Things Can Go Badly: Credit Default Swaps, Interest Swaps and Options, Foreign Exchange
Here is the full interview at CharlieRose.com.
Charlie Rose (about 6 mins): "Will Professor Elizabeth Warren be the new director of the consumer agency?"
Treasury Secretary Timothy Geithner: "She is a incredibly capable effective advocate for reform. She was way ahead of her time - way ahead of the country - in pointing out what was actually happening in the credit business. All the bad stuff that was happening. The looming housing crisis. She was pioneering in pointing out those risks. And she is the most effective advocate of reform we have in the country on these questions. And obviously I think she would do a great job in that position."
Charlie Rose: "She has the qualities you are looking for?"
Geithner: "Absolutely. Without a doubt."
A short preview (doesn't include Warren comments).
More new condo inventory
by Calculated Risk on 7/24/2010 04:30:00 PM
Another update on condos as shadow inventory ...
From Roger Vincent at the LA Times: Luxury condo tower in Century City is completed
The prices, exceeding $2,700 per square foot, were a record high for Los Angeles-area condos. ... In recognition that times have changed, developer Related Cos. reduced prices as much as 25% on the building's 140 units. ... About 25% of the building's residential space has been sold or is in escrow ...So 75% are still for sale.
A handful of other deluxe condominium projects have opened in recent months
There are some areas - like Las Vegas and Miami - that have a huge number of vacant high rise condos. But there are also many smaller buildings that are mostly vacant in a number of cities (like in New York, Chicago, San Diego, Raliegh, N.C. and Irvine, Ca).
Unless the high rise condos are listed for sale, they are not included in either the new home inventory report (from the Census Bureau) or the existing home inventory report (from NAR). They are part of the shadow inventory ...
Part 5B. What Happens If Things Go Really Badly? More Things Can Go Badly: Credit Default Swaps, Interest Swaps and Options, Foreign Exchange
by Calculated Risk on 7/24/2010 08:30:00 AM
CR Note: This series is from reader "some investor guy".
In Part 5A, I showed a Really Bad scenario consistent with some very bad historic default rates for sovereign debt. That produced an estimate of $15.3 trillion of defaulted sovereign debt, with $7.5 to $10.5 trillion of losses.
In today’s post, we look at the effects of sovereign default on credit default swaps, interest rate swaps and options, and currency exchange contracts.
Sovereign risk can make its way into over the counter markets in many ways, including:
A. For credit default swaps, the sovereigns are often the “reference entity”. In other words, market participants are often buying and selling insurance related to a potential future default of a country on its debt.
B. Sovereign bonds are a major form of collateral for over the counter trades. The collateral itself is often marked to market. Thus, movements in interest rates often changes the value of highly rated sovereign bonds posted as collateral, and a participant might post more or fewer bonds as collateral as a result. However, sovereign bonds are typically subject to larger haircuts if downgraded, and might not be accepted at all if rated lower than BB-.
C. Sovereigns ARE the participants in a large number of contracts. Yes, many governments and/or their central banks or sovereign wealth funds are active participants in OTC markets. The author’s impression is that sovereign participation in the CDS market is low, but participation in interest rate and FX markets is considerably higher.
OTC markets are huge. Their notional values are over $600 trillion, and exceed all other forms of investment combined (source: BIS Quarterly Review, June 2010 ). During the 2008 crisis, the market values of CDS, interest rate derivatives, and FX contracts was about the same as all outstanding sovereign debt, or all outstanding equities.
There are also exchange-traded interest and FX futures and options, about $67 trillion in 2009 (source: BIS Quarterly Review, June 2010, page 126).
Unlike stocks and bonds, the total market values for the OTC rise during times of turmoil. That’s partly because when interest rates or FX move from their values when the contracts were entered into, one party to the transaction now has a positive mark to market value for the swap (the other counterparty has a negative mark to market value).
 Click on graph for larger image in new window.
From mid 2007 to the end of 2008, the market values of FX and interest rate derivatives tripled, even though their notional values moved by less than 9%. The market value of CDS went up by a factor of seven, on an almost unchanged notional value.
Credit Default Swaps.
 The next chart shows the ratios of gross and net notional to current outstanding bonds. Unlike the case for many corporate borrowers, for sovereigns it’s rarely the case that even gross notional CDS values exceed sovereign bonds outstanding. It’s even rarer for net notional to exceed outstanding sovereign bonds.
Good to know that CDS are unlikely to make sovereign default much worse, right? Well, these are recent CDS numbers, but take note. The ratios of CDS to bonds outstanding are higher for those countries believed to be in the most trouble. If sovereign financial conditions got much worse, the volume of CDS could go up considerably. In our Really Bad scenario, I assume the amount of CDS outstanding on sovereigns triples, and about half of it pays off. Currently there are about $2 trillion of sovereign CDS outstanding. Let’s assume it goes to $6 trillion of notional, that half of that pays off due to the insolvency of reference entity (the country the CDS is written on), or $3 trillion. That produces $3 trillion of payments, but there is a lot of netting. Even with some counterparty problems, net losses will probably not go over $1 trillion. Let’s assume $500 billion to $1 trillion of net payment and losses due to counterparty problems. Not too bad next to $7.5 to $10.5 trillion of losses on defaulted bonds.
Interest Rate and FX Derivatives.
Here the situation is much different. The total notional value of OTC interest rate and derivatives is $500 trillion (half a quadrillion). It is many times the size of the sovereign bond market.
Interest rate and FX derivatives typically start out at inception with a zero market value. Over time, as interest rates move, a contract acquires a market value. Sometimes, those market values are very large. In the 2008 distress, market values rose to $32 trillion from $11 trillion just 18 months before (Source: BIS, Table 19). Much of that market value is collateralized. Much of it is not, especially for sovereigns.
During the 2008 market turmoil, all kinds of typical relationships between rates changed. Significantly, there were no sovereign defaults during that period. A sovereign default would have made this period even more volatile.
During late 2008, huge amounts of collateral were sucked into the over the counter markets. With numerous sovereign defaults, this would likely happen again, probably on a bigger scale. There are several major sovereign-related risks:
1. Sovereigns are frequently counterparties, and many of them typically don’t post any collateral. According to the ISDA Margin Survey 2010, exposures to “sovereign governments and supra-national institutions tend to have the lowest collateralization levels“. Only 25% of what would normally be collateralized is collateralized if the counterparty is a sovereign. Thus, a highly-rated sovereign, its central bank, or another quasi-sovereign entity could accumulate very large risk positions with no collateral. For example, a AAA-rated sovereign might slide to lower ratings and eventually to default, leaving an immense amount of collateral and derivatives payments due.
Does that story sound familiar? It’s what happened to AIG. AIG went from AAA rated in early 2005 to being majority owned by the Federal Reserve in its first bailout in September 2008.
AIG had some poor risk management decisions, aside from selling mostly unhedged credit default swap protection. ISDA asserts that
“Apparently, AIG relied excessively on a credit risk model that did not adequately account for both the sharp decline in the mortgage market and a downgrade of AIG's credit rating. It has been said that AIG would never have needed government assistance if not for its investments in credit default swaps. Perhaps that is true. But it would be more accurate to state that AIG would never have needed government assistance if had not so heavily exposed itself to mortgage backed securities”(ISDA, AIG and Credit Default Swaps, 2009 ).
Good to know that sovereigns don’t provide unhedged credit guarantees, right? Among many other guarantees, it is common for sovereigns to guarantee bank deposits.
If interest rates or exchange rates moved quickly near the time a sovereign was downgraded or defaulted, a number of in-the-money swaps could be anywhere from worrisome to worthless to the other counterparty. Cash is an acceptable form of collateral, so some sovereigns who control their own currencies might print money, though printing really large amounts of it could have unintended consequences. Countries on the Euro don’t have the choice of printing their own money. Often, the native currency is not the one the OTC contract is written in, so any money printed might have to be converted to dollars, euros, or yen.
2. Sovereign bonds are a major form of collateral. As downgrades occur, haircuts become larger, meaning that for every $100 million of collateral required, a counterparty might have to post $112 million of bonds with a BB rating. Then, when the bonds go below BB- (typical Basel II collateral requirements), it wouldn’t be acceptable at all.
3. Sovereign distress and default would likely cause a breakdown between historic relationships and term structures. The relationships between short and long term rates in a particular currency could move to a strong preference toward short term debt, with long term rates going up. The relationships of interest rates in different currencies could move considerably. In Part 5C on banks, we’ll also discuss how LIBOR departed very substantially from its usual relationships in 2008, and in a period of distress this could easily happen again.
4. Many interest rates for OTC contracts are directly set based on a sovereign interest rate, or are strongly influenced by them. Thus, a contract between two banks might be based on a rate which becomes very volatile, or unglued from its historic relationship.
Having defaulted or distressed sovereigns as counterparties could cause cascading defaults. Downgrades of sovereign debt being used as collateral could cause a massive rush for debt which is still highly rated, and cash. Remember that not only will traders have to replace downgraded debt with other collateral, downgraded debt will lose a big portion of its value and is affect traders’ balance sheets, and the entire system will need much more collateral.
Total Current OTC Collateral, Current Credit Risk
At year end 2009, there was only about $3.2 trillion of collateral posted, on over $600 trillion of notional value contracts, ISDA Margin Survey 2010.
With $22 trillion of gross market value of derivatives at year end 2009, BIS shows “gross credit exposure” of $3.7 trillion (Gross market values after taking into account legally enforceable bilateral netting agreements), BIS Quarterly Review, June 2010 Much of the half trillion of uncollateralized exposure is sovereigns. While I have no reason to doubt the BIS data collection on this item, the $3.7 number is not what it might seem to be.
Stress Cases
If you were to assume that there was only $3.7 trillion of credit exposure in the OTC derivatives market, you would be greatly underestimating.
Why? 1. The BIS number assumes that all expected netting actually occurs. These are bilateral contracts. It is not a given that netting will function properly when there are some big defaulted counterparties and quickly rising collateral requirements. 2. The BIS number would be more appropriately titled “gross credit exposure at current market values”. If market values change wildly due to movements in interest rates and FX, the market values of the OTC contracts will rise considerably. Vastly more collateral and/or credit exposure would now be booked at the new prices.
How much more collateral? Between mid 2007 and late 2008, the market value of OTC derivatives rose by $21 trillion (source: BIS). The “gross credit exposure” rose by $2 trillion.
A couple of analogies may help. If a bank looks at a line of credit for a borrower, it has two different risks. First, the risk that the borrower won’t repay part of all of what they have currently borrowed. Second, the risk that they will borrow considerably more, even max out the credit line, and then not pay that amount. The second one is an extreme stress case.
Another example is even more informative for OTC derivatives. Credit default swaps are similar to insurance in many ways. What many people miss is that interest rate and FX derivatives are also similar to insurance in many ways. They are much like the way that property insurers transfer risk around between various companies. Writing homeowners coverage in an area prone to hurricanes involves taking in risk. It is then sliced, diced, moved around in various ways, and mixed in with risk from other areas and hazards. Of course, regulators do tests for adequacy of capital.
In an analysis which sounds like you could simply substitute “financial crisis” for “hurricane”, Rawle King wrote,
“as development increased in coastal areas, a catastrophic hurricane could result in huge government outlays for disaster assistance and present insurers with significant financial hazards, such as the risk of insolvency, a rapid reduction of earnings and statutory surplus, forced asset liquidation to meet cash needs, and ratings downgrade ... for the very highest layers of catastrophe risk, the government (and consequently the taxpayer) is now, by default, the insurer of last resort.”That was published several months before Hurricane Katrina.
“Insurers were caught off-guard by the large losses associated with Hurricane Andrew because of significant errors in actuarial estimates of potential hurricane related losses. Prior to Hurricane Hugo in 1989, the insurance industry never suffered any loss over $1 billion from a single hurricane. Further, most insurance industry experts estimated the probable maximum loss (PML) for a single hurricane in the United States at between $8 and $10 billion, and that such an event would occur only once in a century. Hurricane Andrew took insurers and forecasters by total surprise. In hindsight, because of the lull in hurricane activity during the 1970s and 1980s, insurance policies were underpriced and insurers accepted far more hurricane exposure than could be supported by their capital resources (including reinsurance).”
The low hurricane period of the 1970s and 80s has a close analog in finance, with similar results. The Great Moderation lasted from the late 1980s to 2007. In a speech in 2004, Fed Governor Ben Bernanke said
“One of the most striking features of the economic landscape over the past twenty years or so has been a substantial decline in macroeconomic volatility ...In the Really Bad scenario, we have passed the Great Moderation, and are currently sitting in the relative calm between Hurricane Hugo and the much larger Hurricane Andrew (3x Hugo), or the even larger Hurricane Katrina (6x Hugo).
I have argued today that improved monetary policy has likely made an important contribution not only to the reduced volatility of inflation (which is not particularly controversial) but to the reduced volatility of output as well. Moreover, because a change in the monetary policy regime has pervasive effects, I have suggested that some of the effects of improved monetary policies may have been misidentified as exogenous changes in economic structure or in the distribution of economic shocks. This conclusion on my part makes me optimistic for the future, because I am confident that monetary policymakers will not forget the lessons of the 1970s.”
In our Really Bad scenario, there isn’t enough collateral to cover the gross market values. If collateral was required on all positions of all traders and the market values reached 3x their 2008 values, gross market value would be about $100 trillion dollars. That would exceed all sovereign debt, all corporate debt and all outstanding equities. However, even in a dysfunctional market, there is a lot of netting.
There might not be enough collateral even if netting. In recent years, the ratio of “gross credit exposure” to “gross market value” has been about 14-22% (BIS data). Let’s say that there is a need for a maximum of $20 trillion of collateral given the net positions. While there is probably enough collateral worldwide to cover $20 trillion, it would undoubtedly move market prices for acceptable assets. It would also be difficult to buy or borrow that much in a short time period.
It’s not just collateral. During a crisis, huge amounts of money would be changing hands. Many interest rate and FX contracts would have their scheduled payments.
An estimate of OTC losses.
While this is not a market value estimate like Part 5A, in the Really Bad scenario, defaulted sovereigns, banks, and other counterparties might find themselves unable to make a substantial part of their payments, or provide collateral. The IMF has discussed “the systemic risk associated with cascading counterparty failures” in Making Over-the-Counter Derivatives Safer.
Despite some large efforts by academics, governments, and others to estimate stress case losses, there are a myriad of modeling issues and choices. For the Really Bad scenario, I use a similar assumption to the losses on sovereign bonds. 45% of the counterparties have problems providing collateral or making their derivative payments as due. Losses to their counterparties are 50-69% of what is owed. That results in another $4.5 to $9.0 trillion of losses on interest rates and FX, and $0.5 to 1.0 trillion on CDS. So far, we’re at $12.5 to 20.5 trillion of losses in the Really Bad scenario
Such large losses require that in addition to the sovereigns themselves, a number of large OTC traders would default. The largest traders include banks and other institutions which have already received government rescues or substantial additional capital from governments. The Really Bad scenario assumes that solvent governments do not cover, or cannot cover, many of those traders’ OTC losses. Nouriel Roubini and Michael Pettis have interesting views on this. Due to OTC losses and direct losses on sovereign bonds, in our Really Bad scenario many of those firms would be in bankruptcy, conservatorship, receivership, or liquidation. As a result, massive changes would occur in the OTC market, and financial systems as a whole.
What can be done? Can we just print money? Turn unacceptable collateral into acceptable? Issue IOUs? Can governments change the terms of the OTC contracts? How about austerity, would that help?
Those are in Part 5C. Some Policy Options, Good and Bad. Financial institutions, governments, and central banks can be creative in a crisis. We will look at some previous actions during crises, and some proposals.
Note from Some Investor Guy: I appreciate everyone’s comments on each thread, they help to improve the series as it goes. CR Note: thanks to Some Investor Guy - this series has add over 100,000 visits to CR.
Full Disclosure: Some Investor Guy owns no credit default swaps, interest rate derivatives, or FX contracts. This series is not investment advice nor an offer to buy or sell anything. Unless cited to other sources, opinions are the author’s. Like just about any other analyst, he could be wrong. He might be right, but he is not psychic. He is not a regulator, nor is he running for any elected office. If a regulator or researcher wants to talk about the series, email CR. He will forward it to Some Investor Guy.
CR Note: This is from "Some investor guy".
Series:
• Part 1: How Large is the Outstanding Value of Sovereign Bonds?
• Part 2. How Often Have Sovereign Countries Defaulted in the Past?
• Part 2B: More on Historic Sovereign Default Research
• Part 3. What are the Market Estimates of the Probabilities of Default?
• Part 4. What are Total Estimated Losses on Sovereign Bonds Due to Default?
• Part 5A. What Happens If Things Go Really Badly? $15 Trillion of Sovereign Debt in Default
• Part 5B. Part 5B. What Happens If Things Go Really Badly? More Things Can Go Badly: Credit Default Swaps, Interest Swaps and Options, Foreign Exchange
• Part 5C. Some Policy Options, Good and Bad
• Part 5D. European Banks, What if Things Go Really Badly?
Friday, July 23, 2010
Unofficial Problem Bank List at 792 Institutions
by Calculated Risk on 7/23/2010 11:46:00 PM
Note: this is an unofficial list of Problem Banks compiled only from public sources.
Here is the unofficial problem bank list for July 23, 2010.
Changes and comments from surferdude808:
Failed banks led to a reduction in the Unofficial Problem Bank List this week. The list stands at 792 institutions with aggregate assets of $409.3 billion.
There were seven removals because of failure including Crescent Bank and Trust Company ($1.0 billion), Sterling Bank ($408 million), Home Valley Bank ($258 million Ticker: HVYB), SouthwestUSA Bank ($214 million), Williamsburg First National Bank ($139 million), Community Security Bank ($109 million), and Thunder Bank ($33 million).
There were three additions this week including Metro United Bank, San Diego, CA ($463 million Ticker: MCBI); Bank VI, Salinas, KS ($98 million); and American Loan and Savings Association, Hannibal, MO ($6 million). The other change is a Prompt Corrective Action Order issued by the Federal Reserve against Pacific State Bank ($323 million Ticker: PSBC).
While the FDIC was busy closing some problem institutions, they did not release their enforcement actions for June as we had anticipated they would. Look for it next week.
Bank Failure #103: Home Valley Bank, Cave Junction, Oregon
by Calculated Risk on 7/23/2010 09:17:00 PM
Home Valley, led through shadows
They have much to fear
by Soylent Green is People
From the FDIC: South Valley Bank & Trust, Klamath Falls, Oregon, Assumes All of the Deposits of Home Valley Bank, Cave Junction, Oregon
As of March 31, 2010, Home Valley Bank had approximately $251.80 million in total assets and $229.6 million in total deposits.That makes 7 today ...
...
The FDIC estimates that the cost to the Deposit Insurance Fund (DIF) will be $37.1 million. ... Home Valley Bank is the 103rd FDIC-insured institution to fail in the nation this year, and the second in Oregon. The last FDIC-insured institution closed in the state was Columbia River Bank, The Dalles, on January 22, 2010.
Bank Failure #102: SouthwestUSA Bank, Las Vegas, Nevada
by Calculated Risk on 7/23/2010 07:16:00 PM
Once flush green brown shifts to fail
Viva, lost wages
by Soylent Green is People
From the FDIC: Plaza Bank, Irvine, California, Assumes All of the Deposits of SouthwestUSA Bank, Las Vegas, Nevada
As of March 31, 2010, SouthwestUSA Bank had approximately $214.0 million in total assets and $186.7 million in total deposits.That makes six today.
...
The FDIC estimates that the cost to the Deposit Insurance Fund (DIF) will be $74.1 million. ... SouthwestUSA Bank is the 102nd FDIC-insured institution to fail in the nation this year, and the fourth in Nevada. The last FDIC-insured institution closed in the state was Nevada Security Bank, Reno, on June 18, 2010.
Bank Failures #97 to #101
by Calculated Risk on 7/23/2010 06:10:00 PM
Whomever is last standing
Please turn out the lights
by Soylent Green is People
From the FDIC: IBERIABANK, Lafayette, Louisiana, Assumes All of the Deposits of Sterling Bank, Lantana, Florida
As of March 31, 2010, Sterling Bank had approximately $407.9 million in total assets and $372.4 million in total deposits.From the FDIC: Renasant Bank, Tupelo, Mississippi, Assumes All of the Deposits of Crescent Bank and Trust Company, Jasper, Georgia
...
The FDIC estimates that the cost to the Deposit Insurance Fund (DIF) will be $45.5 million. ... Sterling Bank is the 97th FDIC-insured institution to fail in the nation this year, and the eighteenth in Florida. The last FDIC-insured institution closed in the state was Metro Bank of Dade County, Miami, on July 16, 2010.
As of March 31, 2010, Crescent Bank and Trust Company had approximately $1.01 billion in total assets and $965.7 million in total deposits.From the FDIC: First Citizens Bank and Trust Company, Inc., Columbia, South Carolina, Assumes All of the Deposits of Williamsburg First National Bank, Kingstree, South Carolina
...
The FDIC estimates that the cost to the Deposit Insurance Fund (DIF) will be $242.4 million. ... Crescent Bank and Trust Company is the 98th FDIC-insured institution to fail in the nation this year, and the tenth in Georgia. The last FDIC-insured institution closed in the state was First National Bank, Savannah, on June 25, 2010.
As of March 31, 2010, Williamsburg First National Bank had approximately $139.3 million in total assets and $134.3 million in total deposits.From the FDIC: The Bennington State Bank, Salina, Kansas, Assumes All of the Deposits of Thunder Bank, Sylvan Grove, Kansas
...
The FDIC estimates that the cost to the Deposit Insurance Fund (DIF) will be $8.8 million. .... Williamsburg First National Bank is the 99th FDIC-insured institution to fail in the nation this year, and the fourth in South Carolina. The last FDIC-insured institution closed in the state was Woodlands Bank, Bluffton, on July 16, 2010.
As of March 31, 2010, Thunder Bank had approximately $32.6 million in total assets and $28.5 million in total deposits.From the FDIC: Roundbank, Waseca, Minnesota, Assumes All of the Deposits of Community Security Bank, New Prague, Minnesota
...
The FDIC estimates that the cost to the Deposit Insurance Fund (DIF) will be $4.5 million.... Thunder Bank is the 100th FDIC-insured institution to fail in the nation this year, and the first in Kansas. The last FDIC-insured institution closed in the state was SolutionsBank, Overland Park, on December 11, 2009.
As of March 31, 2010, Community Security Bank had approximately $108.0 million in total assets and $99.7 million in total deposits.
...
The FDIC estimates that the cost to the Deposit Insurance Fund (DIF) will be $18.6 million. .... Community Security Bank is the 101st FDIC-insured institution to fail in the nation this year, and the seventh in Minnesota. The last FDIC-insured institution closed in the state was Pinehurst Bank, St. Paul, on May 21, 2010.
Existing Home Sales: Still above historical median
by Calculated Risk on 7/23/2010 05:11:00 PM
It might be a little surprising, but existing home sales are still above the historical median level of the last 40 years as a percent of owner occupied units ...
Click on graph for larger image in new window.
The first graph shows existing home sales on an annual basis, and end of year inventory. For 2010, sales are estimated at 5.0 million units and year end inventory at 3.4 million units (currently 4.0 million in June, but inventory will decline seasonally).
The second graph shows the same information normalized by the number of owner occupied units. Because of the high number of low end foreclosures (investor buying), and various government programs (tax credit, etc.) the number of existing home sales have stayed fairly high.
The median for sales is about 6.1% of owner occupied units or currently about 4.6 million sales per year.
The median for inventory is about 3.1% of owner occupied units or just over 2.3 million units (about 6 months of inventory).
As distressed sales move into the mid-to-high priced areas and investor activity declines, I expect turnover will slow, and overall sales will probably decline to the median level over the next year or two. This is below most forecasts ...
The NAR forecast for 2011 is 5.6 million existing home sales. So I'll take the under.
Three Questionable Housing Related Reports
by Calculated Risk on 7/23/2010 02:15:00 PM
Here are the European bank stress test results by country and bank. From MarketWatch: Seven European banks fail stress tests
Since there are plenty of reports on the stress tests, I'd like to comment on three housing related reports that readers have emailed me today ...
1) The FHA
There are some reports out today that the FHA is "broke". This is based on an entry in the Federal Register that I reported on last week. What is important about the notice is the FHA is tightening standards - like cutting seller concessions in half - and this is the public notice of these changes. These changes will become effective after the 30 day comment period - or in mid-August.
But the "breaking" reports focused on this statement in the Federal Register:
A recently issued independent actuarial study shows that the Mutual Mortgage Insurance Fund (MMIF) capital ratio has fallen below its statutorily mandated threshold.Uh, that is not news. The study was released back in November 2009!
2) Fed MBS Program
There is a story out today about how the Fed was still buying MBS after March 31st! That would be news, but the evidence was that MBS was still showing up on the Fed's balance sheet.
I covered this several times, but it takes a few months for the purchases to settle on the Fed's balance sheet (see: the discussion from SIFMA: "To-Be-Announced" Trading of Agency Passthrough Securities). Here is what I wrote in March:
The coming increase in the Fed's balance sheet (and the expansion of the Supplementary Financing Program (SFP) over the same period) are related to the MBS settling on the Fed's balance sheet. Now that the short term liquidity facilities are finished - the balance sheet will increase by about $200 billion over the next couple of months as the remaining MBS settle.The Fed stopped buying on March 31st (I even predicted some people would be fooled by the increase of the Fed's balance sheet!).
Update: I'm not referring to this Bloomberg story about a minor adjustment in holdings.
3) Lenders holding REO off market
There is a report arguing lenders are sitting on a huge amount of REO. I disagree with the methodology in the report (I corresponded with the author). In my view, better (and much lower) estimates come from Barclays and housing economist Tom Lawler.
See: Barclays Lowers REO Inventory Estimate and Lawler's REO: Agencies vs. Private Label
Final Note: My goal is to let everyone know what I know - my intention is not to embarrass anyone (so no links to the articles). If I'm receiving these articles (multiple times) others are probably reading them too. Heck, I'm concerned about the FHA (but this report is not new news) and housing in general. The situation is bad enough ...
European Bank Stress Test Results
by Calculated Risk on 7/23/2010 12:01:00 PM
Here are the Committee of European Banking Supervisors (CEBS) aggregate results.
The aggregate Tier 1 ratio, used as a common measure of banks’ resilience to shocks, under the adverse scenario would decrease from 10.3% in 2009 to 9.2% by the end of 2011 (compared to the regulatory minimum of 4% and to the threshold of 6% set up for this exercise). The aggregate results depend partly on the continued reliance on government support for currently 38 institutions in the exercise.So the details will be available shortly.
...
For the institutions that failed to meet the threshold for this stress test exercise, the competent national authorities are in close contact with these banks to assess the results of the test and their implications, in particular in terms of need for recapitalisation.
Results of the individual banks and statements on follow-up actions, where needed, are provided by the banks participating in the exercise and/or their national supervisory authorities.
...
CEBS will publish a summary of the 91 individual bank results, sorted by country, under this page at 18:30 CEST (17:30 BST). Links to the webpages of the participating national supervisory authorities will be activated at the same time.
The WSJ reports: German financial supervisors say Hypo Real Estate is the only German bank to fail stress test. All Dutch banks pass. All Spanish listed banks pass.
CNBC reports: Portuguese, Dutch, Italian Banks Pass Stress Test, All German Banks Except HRE Pass, France Top 4 Banks Pass
Reuters reports: Several Spanish Savings Banks Fail Stress Test: Report
Deflation Watch
by Calculated Risk on 7/23/2010 09:57:00 AM
Tech Ticker quotes Euro Pacific Capital's Peter Schiff:
"I don't know where anyone thinks prices are falling," Schiff says, citing rising prices for food, healthcare and energy. "I don't know where most people do their shopping but I don't see falling prices. To me, prices are rising."And from Reuters:
Safeway executives said the strength of that push on pricing caught them by surprise.Maybe Schiff should shop at Safeway.
"Deflation continues in price per item and is not expected to significantly improve until the fourth quarter," said Chief Executive Steve Burd, who oversees supermarkets including Safeway, Vons and Dominick's.
Burd acknowledged that retail deflation was much greater than expected in the second quarter and drove a decline in identical-store sales.
More seriously there is little deflation so far, but general deflation would be a bad bad thing.
Hungary debt may be downgraded by S&P and Moody's
by Calculated Risk on 7/23/2010 08:42:00 AM
From Bloomberg: Hungary Credit Rating May Be Cut to Junk After IMF Talks Fail
Standard & Poor’s said it is reviewing Hungary’s credit rating for possible downgrade after the collapse of negotiations with the International Monetary Fund and European Union. A cut would give Hungary’s debt a junk rating.From Reuters: Ratings agencies threaten Hungary with downgrade
Moody's placed Hungary's Baa1 local and foreign currency government bond ratings on review, citing increased fiscal risks after the International Monetary Fund and the European Union suspended talks over their 20 billion euro ($25 billion) financing deal at the weekend.


