 RSS Feed
 by Calculated Risk on 5/25/2010 04:00:00 PM
Tuesday, May 25, 2010
Market Update
The euro recovered to 1.23 dollars and I had to put away my Dow 10K hat ...
The S&P 500 actually finished up slightly.
This graph is from Doug Short of dshort.com (financial planner): "Four Bad Bears".
Note that the Great Depression crash is based on the DOW; the three others are for the S&P 500.
Real Case-Shiller National House Prices
by Calculated Risk on 5/25/2010 11:40:00 AM
S&P/Case-Shiller also released the Q1 2010 National Index this morning.
By request, here is a graph that shows the national index in both nominal and real terms (adjusted with CPI less shelter). Click on graph for larger image in new window.
In nominal terms (blue), the National Index declined 1.3% in Q1, and is 2.1% off the recent bottom in Q1 2009.
Note: Case-Shiller reported the national index declined 3.2% in Q1 (Not Seasonally Adjusted, NSA) - however I'm using the SA data.
In real terms (red), the National Index declined 1.9% in Q1, and is now at the lowest level since Q4 2000.
Case-Shiller House Prices "Weakening"
by Calculated Risk on 5/25/2010 09:00:00 AM
IMPORTANT: These graphs are Seasonally Adjusted (SA). S&P has cautioned that the seasonal adjustment is probably being distorted by irregular factors. These distortions could include distressed sales and the various government programs.
S&P/Case-Shiller released the monthly Home Price Indices for March (actually a 3 month average), and the Q1 2010 National Index.
The monthly data includes prices for 20 individual cities, and two composite indices (10 cities and 20 cities).
From S&P: The First Quarter of 2010 Indicates Some Weakening in Home Prices
Data through March 2009, released today by Standard & Poor’s for its S&P/Case-Shiller Home Price Indices ... show that the U.S. National Home Price Index fell 3.2% in the first quarter of 2010, but remains above its year-earlier level. In March, 13 of the 20 MSAs covered by S&P/Case-Shiller Home Price Indices and both monthly composites were down although the two composites and 10 MSAs showed year-over-year gains.
Housing prices rebounded from crisis lows, but recently have seen renewed weakness as tax incentives are ending and foreclosures are climbing.
 Click on graph for larger image in new window.
 The first graph shows the nominal not seasonally adjusted Composite 10 and Composite 20 indices (the Composite 20 was started in January 2000).
The Composite 10 index is off 29.8% from the peak, and up slightly in March (SA).
The Composite 20 index is off 29.3% from the peak, and down slightly in March (SA).
 The second graph shows the Year over year change in both indices.
The Composite 10 is up 3.2% compared to March 2009.
The Composite 20 is up 2.4% compared to March 2009.
This is the second month with YoY price increases in a row.
The third graph shows the price declines from the peak for each city included in S&P/Case-Shiller indices.
 Prices decreased (SA) in 11 of the 20 Case-Shiller cities in March (SA).
 Prices in Las Vegas are off 56% from the peak, and prices in Dallas only off 5.8% from the peak.
Case Shiller is reporting on the NSA data (13 cities down), and I'm using the SA data. I'm not sure why Case-Shiller is saying prices are weakening because the tax incentive is ending. This is Q1 and March 2010 data - and the tax incentive pulled forward demand and probably supported prices. Just wait until later this year ...
Morning Market News
by Calculated Risk on 5/25/2010 08:12:00 AM
From the NY Times: Concerns Over North Korea Shake Markets and Euro
From the WSJ: Europe's Banks Hit by Rising Loan Costs
On Monday, the London interbank offered rate, or Libor—the rate at which banks lend money to each other, and thus a vital sign of their mutual trust—rose to its highest level for the three-month dollar rate since last July. While the current Libor, at just above 0.5%, is far below the sky-high levels of 4.81875% reached at the height of the financial crisis in 2008, it is still a significant jump from 0.25% as recently as March.The three month Libor has moved even higher, and is now at 0.54.
But Libor's jump is more pronounced at European banks. On Monday, German state-controlled lender WestLB AG said it cost 0.565% to borrow dollars for three months, up from 0.38% a month earlier. U.S.
The TED spread is up to 38.61 (from 34.47). This is the difference between the interbank rate for three month loans and the three month Treasury. The peak was 463 on Oct 10th -the spread is still low, but has been steadily rising.
The European markets are off sharply. The German DAX off 2.76%, the FTSE 100 off 2.5%.
From CNBC: Pre-Market Data shows the S&P 500 off about 25 or over 2.0%. Dow futures are off almost 200 points.
The Euro is down to 1.22 dollars.
Monday, May 24, 2010
Futures Off Tonight
by Calculated Risk on 5/24/2010 11:56:00 PM
The U.S. futures are off tonight:
From CNBC: Pre-Market Data shows the S&P 500 off about 19 or almost 2.0%. Dow futures are off about 150 points.
Get your Dow 10K hats ready ... I've heard the Libor is "going nutty" (no link).
CBOT mini-sized Dow
And the Asian markets are off about 2% ... and a graph of the Asian markets.
The Euro is back down to 1.23 dollars. Some other sources for exchange rates and NetDania.
And a couple of stories ...
From Micheal Pettis at Bloomberg: China Falls Victim to Greek Deficit Contagion
And from the Financial Times: Obama adviser calls for new ‘mini-stimulus’
The Obama administration made a strong plea to Congress on Monday to grit its teeth and pass a new set of spending measures ... in order to help dig the economy “out of a deep valley”. ... Lawrence Summers ... urged Congress to pass up to $200bn (£138.9bn) in spending measures ... last year’s $787bn stimulus is wearing off.Could be an interesting day ...
except with permission
Best to all.
DOT: Vehicle Miles Driven increase in March
by Calculated Risk on 5/24/2010 09:05:00 PM
Note: On existing home sales, please see Inventory increases Year-over-Year and Existing Home Sales increase in April
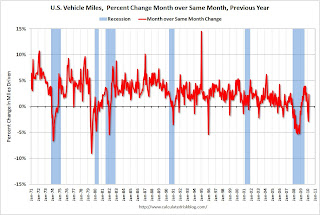
The Department of Transportation (DOT) reported earlier today that vehicle miles driven in March were up from March 2009:
Travel on all roads and streets changed by +2.3% (5.8 billion vehicle miles) for March 2010 as compared with March 2009. Travel for the month is estimated to be 254.8 billion vehicle miles.So miles driven are still down for the year compared to 2009.
Cumulative Travel for 2010 changed by -0.7% (-4.8 billion vehicle miles).
Also miles driven in March were still 1.7% below March 2007.
 Click on graph for larger image in new window.
This graph shows the percent change from the same month of the previous year as reported by the DOT.
As the DOT noted, miles driven in March 2010 were up 2.3% compared to March 2009.
The YoY decline in February was blamed on the snow, and there might have been some extra driving in March once the weather improved. On a rolling 12 month basis, miles driven are still 2.1% below the peak - and only 0.5% above the recent low - suggesting a sluggish recovery.
FHA Commissioner: Housing on "Life support", "very sick system"
by Calculated Risk on 5/24/2010 05:55:00 PM
“This is a market purely on life support, sustained by the federal government. Having FHA do this much volume is a sign of a very sick system.”
Federal Housing Commissioner David Stevens at Mortgage Bankers Association Government Housing Conference (see Bloomberg, the FHA was involved in more transactions in Q1 than Fannie and Freddie combined)
No kidding ...
Market Update
by Calculated Risk on 5/24/2010 04:04:00 PM
Note: On existing home sales, please see Inventory increases Year-over-Year and Existing Home Sales increase in April
The market sell-off continues with the Dow down 127. The S&P 500 off 14 (1.3%).
This graph is from Doug Short of dshort.com (financial planner): "Four Bad Bears".
Note that the Great Depression crash is based on the DOW; the three others are for the S&P 500.
The Euro is down to 1.2383 dollars (off slightly).
The TED spread increased to 35.96 from 34.47. This is still fairly low, but has been increasing steadily. Note: This is the difference between the interbank rate for three month loans and the three month Treasury. The peak was 463 on Oct 10th and a normal spread is below 50 bps.
The three month dollar Libor edged up to 0.51.
'Shadow' Condos coming back on market
by Calculated Risk on 5/24/2010 02:16:00 PM
Over the weekend, Jeff Collins at the O.C. Register noted that the "Central Park West" complex in Irvine, California that was mothballed by Lennar in 2007 is now back on the market.
And from Amanda Fung at Crain's New York: 'Shadow' condos dim sale outlook (ht Nick)
A little over two years ago, SDS Procida suspended plans to market The Dillon, its 83-unit Hell's Kitchen condo, when residential real estate tanked ... the developer finally put the units on the block three weeks ago.The term "shadow inventory" is used in many different ways. My definition is: housing units that are not currently listed on the market, but will probably be listed soon. This includes:
...
“It is still early—you're not seeing a flood of apartments yet—but we may see it happen during the second half of the year,” says Jonathan Miller, chief executive of appraisal firm Miller Samuel Inc.
...
Mr. Miller estimates that there were 6,500 units of shadow space in Manhattan alone during the first quarter of this year. If those apartments were unloaded all at once, supply would potentially skyrocket by 70%.
It is difficult to put a number on the total, but it is in the millions of units and all this inventory will keep downward pressure on house prices for some time.
Existing Home Sales: Inventory increases Year-over-Year
by Calculated Risk on 5/24/2010 11:25:00 AM
Earlier the NAR released the existing home sales data for April; here are a couple more graphs ...
The first graph shows the year-over-year (YoY) change in reported existing home inventory and months-of-supply. Inventory is not seasonally adjusted, so it really helps to look at the YoY change.  Click on graph for larger image in new window.
Inventory increased 2.7% YoY in April, the first YoY increase since 2008.
This increase in the inventory is especially concerning because the reported inventory is already historically very high, and the 8.4 months of supply in April is well above normal. The months of supply will probably decline over the next two months because of the increase in sales due to the tax credit (reported at closing), but this will be something to watch this summer and later this year.
Perhaps this was an especially large surge in inventory as sellers tried to take advantage of the tax credit, but it is also possible that we will see close to double digit months of supply later this year.  The second graph shows NSA monthly existing home sales for 2005 through 2010 (see Red columns for 2010).
Sales (NSA) in April 2010 were 26% higher than in April 2009, and also higher than in April of 2007 and 2008.
We will probably see an increase in sales in May and June - perhaps to the levels of 2006 or 2007 - because of the tax credit, however I expect to see existing home sales below last year in the 2nd half of this year.
I think this was a weak report. Sales were up because of the tax credit (pulling sales forward), but that does very little for the economy. The key is the increase in the inventory and months-of-supply, and if these two measures increase later this year (after the distortions in May and June), then there will be additional downward pressure on house prices.
Existing Home Sales increase in April
by Calculated Risk on 5/24/2010 10:00:00 AM
The NAR reports: Existing-Home Sales Rise
Existing-home sales, which are completed transactions that include single-family, townhomes, condominiums and co-ops, increased 7.6 percent to a seasonally adjusted annual rate of 5.77 million units in April from an upwardly revised 5.36 million in March, and are 22.8 percent higher than the 4.70 million-unit pace in April 2009.
...
Total housing inventory at the end of April rose 11.5 percent to 4.04 million existing homes available for sale, which represents an 8.4-month supply at the current sales pace, up from an 8.1-month supply in March.
 Click on graph for larger image in new window.
This graph shows existing home sales, on a Seasonally Adjusted Annual Rate (SAAR) basis since 1993.
Sales in April 2010 (5.77 million SAAR) were 7% higher than last month, and were 22.8% higher than April 2009 (4.61 million SAAR).
Sales surged last November when many first-time homebuyers rushed to beat the initial expiration of the tax credit. There will probably be a further increase in May and June this year. Note: existing home sales are counted at closing, so even though contracts must be signed in April to qualify for the tax credit, buyers have until June 30th to close.
 The second graph shows nationwide inventory for existing homes.
According to the NAR, inventory increased to 4.04 million in April from 3.63 million in March. The all time record high was 4.57 million homes for sale in July 2008.
Inventory is not seasonally adjusted and there is a clear seasonal pattern - inventory should increase further in the spring. This is an increase from April 2009, and this breaks a streak of 20 consecutive months of year-over-year declines in inventory (I'll have more on inventory).
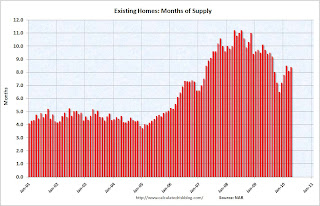 The last graph shows the 'months of supply' metric.
Months of supply increased to 8.4 months in April. A normal market has under 6 months of supply, so this is high - and probably excludes some substantial shadow inventory. And the months of supply will probably increase sharply this summer.
I'll have more later ... the increase in inventory is the big story.
Chicago Fed: Economic Activity increased in April
by Calculated Risk on 5/24/2010 08:30:00 AM
Note: This is a composite index based on a number of economic releases. This shows that growth in April was still slightly below trend (weak for a recovery).
From the Chicago Fed: Index shows economic activity continued to improve in April
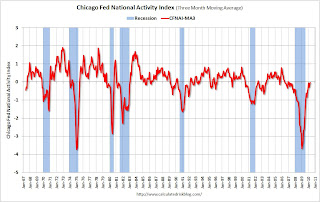
Led by continued improvements in production- and employment-related indicators, the Chicago Fed National Activity Index increased to +0.29 in April, up from +0.13 in March. April marked the highest level of the index since December 2006 and the third time in the past four months that the index indicated above-average economic activity. Three of the four broad categories of indicators that make up the index made positive contributions in April, while the consumption and housing category made the lone negative contribution.
The index’s three-month moving average, CFNAI-MA3, increased to –0.03 in April from –0.09 in March, reaching its highest level since February 2007. April’s CFNAI-MA3 suggests that growth in national economic activity was very near its historical trend. With the index still slightly below trend, there remains some economic slack, suggesting subdued inflationary pressure from economic activity over the coming year.
 Click on table for larger image in new window.
This graph shows the Chicago Fed National Activity Index (three month moving average) since 1967. According to the Chicago Fed:
A zero value for the index indicates that the national economy is expanding at its historical trend rate of growth; negative values indicate below-average growth; and positive values indicate above-average growth.We are now about 10+ months into the recovery, and growth by most indicators is still slightly below trend.
Sunday, May 23, 2010
Sunday Night Futures
by Calculated Risk on 5/23/2010 11:59:00 PM
Note: Here is the weekly summary and a look ahead (with plenty of interesting graphs!). The U.S. futures are off slightly tonight:
From CNBC: Pre-Market Data shows the S&P 500 off about 7 or less than 1%. Dow futures are off about 45 points.
CBOT mini-sized Dow
And the Asian markets are mostly up ... and a graph of the Asian markets.
The Euro is at 1.25 dollars (off slightly). Some other sources for exchange rates and NetDania.
Best to all.
States: U-6 Unemployment Rate vs. Mortgage Delinquency Rate
by Calculated Risk on 5/23/2010 07:01:00 PM
Note: Earlier post is weekly summary and a look ahead (with plenty of interesting graphs!)
By request here is a scatter graph comparing the Q1 2010 delinquency rate for mortgage loans (including all loans in foreclosure) vs. the U-6 unemployment rate for all states. U-6 is available on a rolling four quarters basis from the BLS - and this is the 'Second Quarter of 2009 through First Quarter of 2010 Averages' data. (ht Keith for the data).
Note: The U-6 unemployment rate includes "total unemployed, plus all marginally attached workers, plus total employed part time for economic reasons, as a percent of the civilian labor force plus all marginally attached workers." Click on graph for larger image in new window.
Ht Jeff to the labels!
The graph is pretty similar to the U-3 vs delinquency rate graph. R2 is higher using U-3 (0.52) than using U-6 (0.46), but that might be because of the lag of using a four quarter average.
Once again Florida and Nevada stand out. As I mentioned before, Florida has a high number of delinquencies because of state specific foreclosure laws - it takes forever to foreclose. The delinquency rate in Nevada is also very high, probably because of the large percentage of homeowners with negative equity. Both states might also have higher than expected delinquency rates because of significant investor activity during the housing bubble.
Another stand out is Oregon with a much higher U-6 than U-3.
"Feeling like a foolish child"
by Calculated Risk on 5/23/2010 03:07:00 PM
I received so many positive emails after posting this Friday night; here it is again for those who missed it. Singer-songwriter Tim Miller captures the anger and despair of a victim of predatory lending in "Love, Your Broken Home" (some rough language). Click here for YouTube.
Weekly Summary and a Look Ahead
by Calculated Risk on 5/23/2010 12:12:00 PM
Three housing related reports will be released this week: existing home sales on Monday, Case-Shiller house prices on Tuesday, and new home sales on Wednesday.
On Monday, the April Chicago Fed National Activity Index will be released at 8:30 AM. This is a composite index of other data. At 10 AM the National Association for Realtors (NAR) will release the April existing home sales report. The consensus is for an increase to 5.6 million sales in April as a seasonally adjusted annual rate (SAAR). Also on Monday, the DOT will probably release the Vehicle Miles Driven for March. This has been showing declining Year-over-year miles driven.
On Tuesday, the March Case-Shiller house price index will be released at 9:00 AM. The consensus is for a slight decline in the house price index. At 10:00 AM, the Conference Board will release Consumer Confidence for May (consensus is for an increase to 59). Also on Tuesday, the FHFA house price index, and the Richmond Fed survey will be released.
On Wednesday, the April Durable Goods Orders will be released at 8:30 AM. The consensus is for a 1.5% increase. At 10 AM, the Census Bureau will release the April New Home sales report. The consensus is for an increase to 425K (SAAR) from 411K in March. Since new home sales are reported when a contract is signed, April was the last month that reported sales will be positively impacted by the tax credit.
On Thursday, the first revision of the Q1 GDP report will be released at 8:30 AM. The consensus is for an upward revision to 3.5% from the initially reported 3.2%. Also on Thursday, the closely watched initial weekly unemployment claims will be released. Consensus is for a decline to 450K from 471K last week.
And on Friday, the BEA will release the Personal Income and Outlayreport for April at 8:30 AM. Also on Friday the Chicago Purchasing Managers Index for May will be released. And of course the FDIC will probably have another busy Friday afternoon ...
There will be several Fed speeches this week, and a few other economic releases (trucking index, restaurant index).
And a summary of last week:
The MBA reported a record 14.69 percent of mortgage loans were either one payment delinquent or in the foreclosure process in Q1 2010 (seasonally adjusted).
 Click on graph for larger image in new window.
This graph shows the percent loans delinquent by duration. Loans 30 days delinquent increased to 3.45%, about the same level as in Q4 2008.
Delinquent loans in the 60 day bucket increased too, and are also close to the Q4 2008 level. This suggests that the pipeline is still filling up at a high rate, but slightly below the rates of early 2009.
The 90+ day and 'in foreclosure' rates are at record levels. Obviously the lenders have been slow to start foreclosure proceedings - and the 90+ day delinquent bucket is very full. Also lenders have been slow to actually foreclose - and the 'in foreclosure' bucket is at record levels.

The second graph shows the delinquency rate by state (red is seriously delinquent: 90+ days or in foreclosure, blue is delinquent less than 90 days).
Thirty four states and the District of Columbia have total delinquency rates over 10%. This is a widespread problem.
 Total housing starts were at 672 thousand (SAAR) in April, up 5.8% from the revised March rate, and up 41% from the all time record low in April 2009 of 477 thousand (the lowest level since the Census Bureau began tracking housing starts in 1959).
 Single-family starts were at 593 thousand (SAAR) in April, up 10.2% from the revised February rate, and 65% above the record low in January 2009 (360 thousand).
Permits declined sharply suggesting that starts will decline next month.
 This graph shows the builder confidence index from the National Association of Home Builders (NAHB).
The housing market index (HMI) was at 22 in May. This is an increase from 19 in April. This is the highest level since August 2007 - and builders were seen as depressed then!
The record low was 8 set in January 2009. This is still very low ... Note: any number under 50 indicates that more builders view sales conditions as poor than good.
 On a month-over-month basis, the national average home price index fell by 0.3 percent in March 2010 compared to February 2010.
This graph shows the national LoanPerformance data since 1976. January 2000 = 100.
The index is up 1.7% over the last year, and off 30.5% from the peak.
 Moody's reported that the Moody’s/REAL All Property Type Aggregate Index declined 0.5% in March. This is a repeat sales measure of commercial real estate prices.
This is a comparison of the Moodys/REAL Commercial Property Price Index (CPPI) and the Case-Shiller composite 20 index. CRE prices only go back to December 2000.
Commercial real estate values are now down 25% over the last year, and down 42% from the peak in August 2007.
 The American Institute of Architects’ Architecture Billings Index increased to 48.5 in April from 46.1 in March. This index is a leading indicator for Commercial Real Estate (CRE) investment. Any reading below 50 indicates contraction.
According to the AIA, there is an "approximate nine to twelve month lag time between architecture billings and construction spending" on non-residential construction. So there will probably be further declines in CRE investment through all of 2010, and probably into 2011.
Best wishes to all.
On Loan Mods and Credit Scores
by Calculated Risk on 5/23/2010 08:58:00 AM
From Carolyn Said at the San Francisco Chronicle: Loan modifications often damage credit scores
Struggling homeowners who get a loan modification to reduce their mortgage payments are often unaware that it can seriously ding their credit score.And on short sales:
...
"A lot of people don't understand that by making the payments due on their temporary loan mod they're reported as delinquent immediately," said Margot Saunders of the National Consumer Law Center in Washington. "It's a huge misunderstanding."
...
"A lot of lenders are reporting these modifications as paying under a partial payment plan. FICO regards that status as a serious delinquency," said Craig Watts, a spokesman for FICO ...
Watts said it is a "widespread myth" that short sales and deeds in lieu of foreclosure have less impact on credit scores than do foreclosures.There is much more in the article ...
"Generally speaking, when you can't pay your mortgage, in the eyes of the FICO score what matters is that you were not able to fill your obligation as you originally agreed and that failure is highly predictive of future risk," he said.
Saturday, May 22, 2010
Spain: Regulators seize CajaSur; U.K.: Bonfire of the Quangos?
by Calculated Risk on 5/22/2010 08:39:00 PM
Some news from Europe ...
From Bloomberg: Regulator Seizes CajaSur, Lender Hurt by Bad Loans
The Bank of Spain removed the managers of CajaSur ... a savings bank with assets of about 19 billion euros and 486 branches ... and put the bank under a provisional administrator.This is a fairly large bank. The 45 or so 'cajas' are local government owned banks that are focused domestically with about 70% of their portfolios exposed to the Spanish real estate market.
And in the U.K. it looks like the proposed austerity measures will lead to 100s of thousands of public job cuts, from the police to active duty front line soldiers. The ministers are promising a “bonfire of the quangos” (quasi-autonomous non-governmental organisation), but it sounds like this will go far beyond the NGOs ...
From the Times: 300,000 jobs in public sector face the axe
Detailed research by The Sunday Times shows that at least 300,000 workers, including civil servants and frontline staff, will lose their jobs over the next few years.
Some estimates suggest that the number of job losses could reach 700,000.
These will include tens of thousands of health service managers as well as many thousands of doctors and nurses ... Thousands of police officers and their civilian support staff ... 20,000 jobs will be lost at the Ministry of Defence ... including some frontline soldiers ...
Mothballed Condos Offered For Sale
by Calculated Risk on 5/22/2010 04:48:00 PM
In November 2007 Lennar mothballed a major condo project in Irvine called "Central Park West". I posted a short video of the project (poor quality) in 2008.
Jeff Collins at the O.C. Register has an update: Prices cut 25% on new ‘urban’ condos
What a difference three years makes.This is real shadow inventory coming back on the market ...
When homebuilder Lennar Corp. first launched home sales in its urban-styled Central Park West community in Irvine, prices started at $500,000 and ranged up to $2.9 million.
Fast forward to today’s “grand opening” for Central Park West’s four-story condo buildings — the project’s low-rises. Prices now start in the upper $300,000’s and range to over $1 million – at least 25 percent below the original pricing.
Sales at the sleek, industrial-chic Central Park West began in early 2007, but were halted abruptly by the fall of that year amid cascading home prices.
Credit Indicators
by Calculated Risk on 5/22/2010 12:44:00 PM
During the crisis these indicators showed the stress in the credit markets and it is probably worth revisiting them now. Click on graph for larger image in new window.
This graph from Bloomberg, based on data from the British Bankers' Association, shows the three-month U.S. dollar London interbank offered rate, or Libor rose to 0.50% on Friday.
This is an important rates since trillions of financial products worldwide are tied to the Libor - including many adjustable mortgages in the U.S.
The rate has increased recently, but it is still very low. The TED spread has also risen recently and is now at 34.47. This is a 5 year graph to show the recent increase is very small compared to the huge increases during the worst of the crisis.
Note: This is the difference between the interbank rate for three month loans and the three month Treasury. The peak was 463 on Oct 10th and a normal spread is below 50 bps. Here is the A2P2 spread from the Federal Reserve. This is the spread between high and low quality 30 day nonfinancial commercial paper.
This has increased recently to 0.19, but the spread is still very low.
The last graph shows the Merrill Lynch Corporate Master Index OAS (Option adjusted spread) for the last few years. This is a broad index of investment grade corporate debt:
The Merrill Lynch US Corporate Index tracks the performance of US dollar denominated investment grade corporate debt publicly issued in the US domestic market.This index has increased lately - but it still very low compared to the worst of the crisis.
So far we've only seen slightly wider credit spreads and just a hint of stress.


