 RSS Feed
 by Calculated Risk on 12/20/2019 08:35:00 AM
Friday, December 20, 2019
Q3 GDP at 2.1% Annual Rate
From the BEA: Gross Domestic Product, Third quarter 2019 (third estimate); Corporate Profits, Third quarter 2019 (revised estimate)
Real gross domestic product (GDP) increased at an annual rate of 2.1 percent in the third quarter of 2019, according to the "third" estimate released by the Bureau of Economic Analysis. In the second quarter, real GDP increased 2.0 percent.PCE growth was revised up to 3.2% from 2.9% in the second estimate. Residential investment was revised down to 4.6% from 5.1%.
The GDP estimate released today is based on more complete source data than were available for the "second" estimate issued last month. In the second estimate, the increase in real GDP was also 2.1 percent. With the third estimate for the third quarter, upward revisions to personal consumption expenditures (PCE) and nonresidential fixed investment were offset by a downward revision to private inventory investment.
emphasis added
Here is a Comparison of Second and Advance Estimates.
Thursday, December 19, 2019
Friday: Q3 GDP, Nov Personal Income and Outlays and More
by Calculated Risk on 12/19/2019 06:49:00 PM
Friday:
• At 8:30 AM ET, Gross Domestic Product, 3nd quarter 2018 (Third estimate). The consensus is that real GDP increased 2.1% annualized in Q3, unchanged from the second estimate of GDP.
• At 10:00 AM, Personal Income and Outlays for November. The consensus is for a 0.3% increase in personal income, and for a 0.4% increase in personal spending. And for the Core PCE price index to increase 0.1%.
• Also at 10:00 AM, University of Michigan's Consumer sentiment index (Final for December). The consensus is for a reading of 99.2.
• Also at 10:00 AM, State Employment and Unemployment (Monthly) for November 2018
• At 11:00 AM, the Kansas City Fed manufacturing survey for December.
Comments on November Existing Home Sales
by Calculated Risk on 12/19/2019 12:24:00 PM
Earlier: NAR: Existing-Home Sales Decreased to 5.35 million in November
A few key points:
1) Existing home sales were up 2.7% year-over-year (YoY) in November. This was the fifth consecutive month with a YoY increase - following 16 consecutive months with a YoY decrease in sales
2) Inventory is still low, and was down 5.7% year-over-year (YoY) in November.
 Click on graph for larger image.
3) Year-to-date sales are down about 1.1% compared to the same period in 2018. On an annual basis, that would put sales around 5.28 million in 2019, down from 5.34 million in 2018.
Sales slumped at the end of 2018 and in January 2019 due to higher mortgage rates, the stock market selloff, and fears of an economic slowdown.
The comparisons will be easy in December of this year, and with lower mortgage rates, sales will probably finish the year mostly unchanged from 2018.
 The second graph shows existing home sales Not Seasonally Adjusted (NSA).
Sales NSA in November (404,000, red column) were slightly below sales in November 2018 (406,000, NSA). Note: There were fewer selling days in November 2019 compared to 2018.
Overall this was a solid report.
NAR: Existing-Home Sales Decreased to 5.35 million in November
by Calculated Risk on 12/19/2019 10:10:00 AM
From the NAR: Existing-Home Sales Descend 1.7% in November
Existing-home sales fell in November, taking a small step back after October’s gains, according to the National Association of Realtors®. The Northeast and Midwest both reported growth last month, while the South and West saw sales decline.
Total existing-home sales, completed transactions that include single-family homes, townhomes, condominiums and co-ops, decreased 1.7% from October to a seasonally-adjusted annual rate of 5.35 million in November. However, sales are up 2.7% from a year ago (5.21 million in November 2018).
...
Total housing inventory at the end of November totaled 1.64 million units, down approximately 7.3% from October and 5.7% from one year ago (1.74 million). Unsold inventory sits at a 3.7-month supply at the current sales pace, down from 3.9 months in October and from the 4.0-month figure recorded in November 2018. Unsold inventory totals have declined for five consecutive months, constraining home sales.
emphasis added
 Click on graph for larger image.
This graph shows existing home sales, on a Seasonally Adjusted Annual Rate (SAAR) basis since 1993.
Sales in November (5.35 million SAAR) were down 1.9% from last month, and were 2.7% above the November 2018 sales rate.
The second graph shows nationwide inventory for existing homes.
 According to the NAR, inventory decreased to 1.64 million in November from 1.77 million in October. Headline inventory is not seasonally adjusted, and inventory usually decreases to the seasonal lows in December and January, and peaks in mid-to-late summer.
The last graph shows the year-over-year (YoY) change in reported existing home inventory and months-of-supply. Since inventory is not seasonally adjusted, it really helps to look at the YoY change. Note: Months-of-supply is based on the seasonally adjusted sales and not seasonally adjusted inventory.
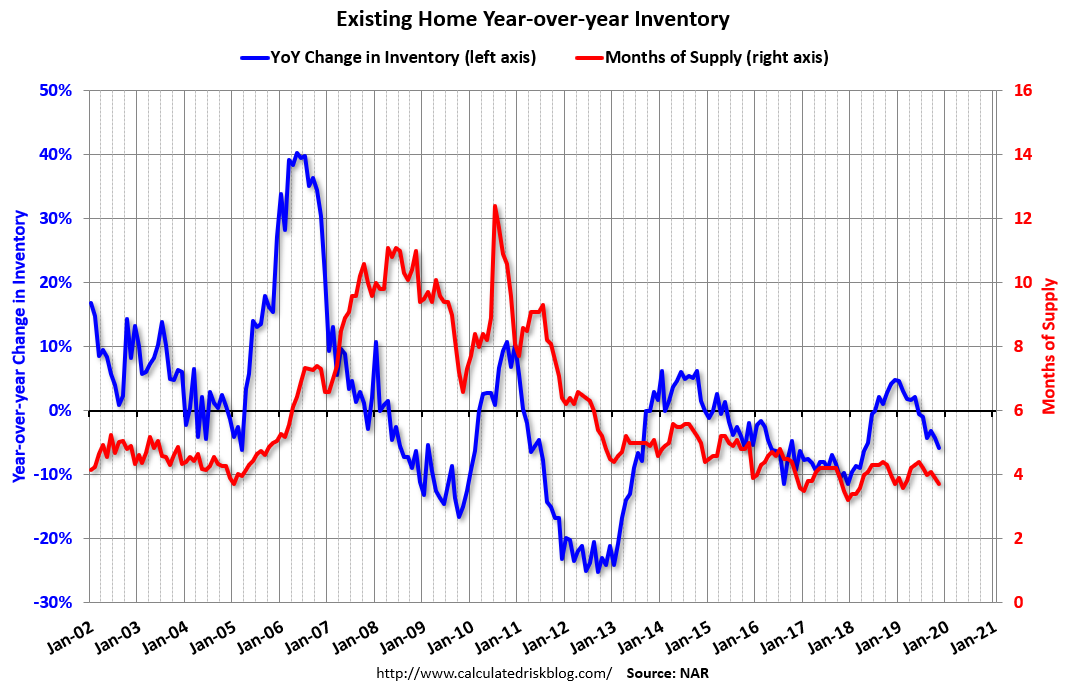 Inventory was down 5.7% year-over-year in November compared to November 2018.
 Months of supply decreased to 3.7 months in November.
This was lower than the consensus forecast. For existing home sales, a key number is inventory - and inventory is still low. I'll have more later …
Philly Fed Manufacturing Suggests Activity "Flat" in December
by Calculated Risk on 12/19/2019 08:42:00 AM
From the Philly Fed: Current Manufacturing Indexes Suggest Flat Growth in December
Manufacturing activity in the region was flat this month, according to results from the December Manufacturing Business Outlook Survey. The survey's broad indicator for current activity dropped to a reading near zero this month, although indicators for new orders, shipments, and employment remained at higher positive readings. The survey’s future activity indexes remained positive, suggesting continued optimism about growth for the next six months.This was slightly above the consensus forecast. Here is a graph comparing the regional Fed surveys and the ISM manufacturing index:
The diffusion index for current general activity fell 10 points this month to 0.3, its lowest reading in six months … Manufacturers continued to report expanding employment this month, although the current employment index decreased 4 points to 17.8.
emphasis added
 Click on graph for larger image.
The New York and Philly Fed surveys are averaged together (yellow, through December), and five Fed surveys are averaged (blue, through November) including New York, Philly, Richmond, Dallas and Kansas City. The Institute for Supply Management (ISM) PMI (red) is through November (right axis).
These early reports suggest the ISM manufacturing index will probably be weak again in December.
Weekly Initial Unemployment Claims decreased to 234,000
by Calculated Risk on 12/19/2019 08:33:00 AM
The DOL reported:
In the week ending December 14, the advance figure for seasonally adjusted initial claims was 234,000, a decrease of 18,000 from the previous week's unrevised level of 252,000. The 4-week moving average was 225,500, an increase of 1,500 from the previous week's unrevised average of 224,000.The previous week was unrevised.
emphasis added
The following graph shows the 4-week moving average of weekly claims since 1971.
 Click on graph for larger image.
The dashed line on the graph is the current 4-week average. The four-week average of weekly unemployment claims increased to 225,500.
This was higher than the consensus forecast.
Wednesday, December 18, 2019
Thursday: Existing Home Sales, Unemployment Claims, Philly Fed Mfg
by Calculated Risk on 12/18/2019 06:57:00 PM
Thursday:
• At 8:30 AM ET, The initial weekly unemployment claims report will be released. The consensus is for 224,000 initial claims, down from 252,000 last week.
• At 8:30 AM, the Philly Fed manufacturing survey for December. The consensus is for a reading of 8.0, down from 10.4.
• At 10:00 AM, Existing Home Sales for November from the National Association of Realtors (NAR). The consensus is for 5.45 million SAAR, down from 5.46 million.
Phoenix Real Estate in November: Sales up 7.0% YoY, Active Inventory Down 20.7% YoY
by Calculated Risk on 12/18/2019 02:15:00 PM
This is a key housing market to follow since Phoenix saw a large bubble / bust followed by strong investor buying.
The Arizona Regional Multiple Listing Service (ARMLS) reports ("Stats Report"):
1) Overall sales were at 6,974 in November, down from 7,848 in October, and up from 6,515 in November 2018. Sales were down 11.1% from October 2019 (last month), and up 7.0% from November 2018.
2) Active inventory was at 13,675, down from 18,162 in November 2018. That is down 24.7% year-over-year.
3) Months of supply increased to 2.49 months in November from 2.35 months in October. This remains relatively low.
This is another market with increasing sales and falling inventory.
Lawler: Early Read on Existing Home Sales in November
by Calculated Risk on 12/18/2019 11:04:00 AM
Based on publicly-available local realtor/MLS reports released across the country through today, I project that existing home sales as estimated by the National Association of Realtors ran at a seasonally adjusted annual rate of 5.43 million in November, down 0.5% from October’s preliminary pace and up 4.2% from last November’s seasonally adjusted pace. Unadjusted sales should be about flat from a year ago, with the SA/NSA difference reflecting this November’s lower business day count comparted to last November.
On the inventory front, local realtor/MLS data, as well as data from other inventory trackers, suggest that the inventory of existing homes for sale at the end of November should be down by about 9.1% from a year earlier.
Finally, local realtor/MLS data suggest that the median US existing single-family home sales price last month was up by about 5.8% from last November.
CR Note: The National Association of Realtors (NAR) is scheduled to release November existing home sales on Thursday, December 19th at 10:00 AM ET. The consensus is for 5.45 million SAAR.
AIA: "Architecture Billings Index continues to show modest growth"
by Calculated Risk on 12/18/2019 09:37:00 AM
Note: This index is a leading indicator primarily for new Commercial Real Estate (CRE) investment.
From the AIA: Architecture Billings Index continues to show modest growth
Demand for design services in November increased at a modest pace for the second month in a row, according to a new report today from The American Institute of Architects (AIA).
AIA’s Architecture Billings Index (ABI) score of 51.9 for November reflects an increase in design services provided by U.S. architecture firms (any score above 50 indicates an increase in billings). During November, both the new project inquiries and design contracts scores were positive, posting scores of 60.9 and 52.9 respectively.
“The uncertainty surrounding the overall health of the economy is leading developers to proceed with more caution on new projects,” said AIA Chief Economist, Kermit Baker, Hon. AIA, PhD. “We are at a point where there is a potential for an upside but also a potential for things to get worse.”
...
• Regional averages: South (54.5); West (51.3); Midwest (51.1); Northeast (47.5)
• Sector index breakdown: commercial/industrial (52.9) mixed practice (52.2); multi-family residential (51.5); institutional (50.1)
emphasis added
 Click on graph for larger image.
This graph shows the Architecture Billings Index since 1996. The index was at 51.9 in October, down from 52.0 in October. Anything above 50 indicates expansion in demand for architects' services.
Note: This includes commercial and industrial facilities like hotels and office buildings, multi-family residential, as well as schools, hospitals and other institutions.
According to the AIA, there is an "approximate nine to twelve month lag time between architecture billings and construction spending" on non-residential construction. This index has been positive for 8 of the previous 12 months, suggesting some further increase in CRE investment in 2020 - but three of the previous six months were negative.


