 RSS Feed
 by Calculated Risk on 12/19/2019 10:10:00 AM
Thursday, December 19, 2019
NAR: Existing-Home Sales Decreased to 5.35 million in November
From the NAR: Existing-Home Sales Descend 1.7% in November
Existing-home sales fell in November, taking a small step back after October’s gains, according to the National Association of Realtors®. The Northeast and Midwest both reported growth last month, while the South and West saw sales decline.
Total existing-home sales, completed transactions that include single-family homes, townhomes, condominiums and co-ops, decreased 1.7% from October to a seasonally-adjusted annual rate of 5.35 million in November. However, sales are up 2.7% from a year ago (5.21 million in November 2018).
...
Total housing inventory at the end of November totaled 1.64 million units, down approximately 7.3% from October and 5.7% from one year ago (1.74 million). Unsold inventory sits at a 3.7-month supply at the current sales pace, down from 3.9 months in October and from the 4.0-month figure recorded in November 2018. Unsold inventory totals have declined for five consecutive months, constraining home sales.
emphasis added
 Click on graph for larger image.
This graph shows existing home sales, on a Seasonally Adjusted Annual Rate (SAAR) basis since 1993.
Sales in November (5.35 million SAAR) were down 1.9% from last month, and were 2.7% above the November 2018 sales rate.
The second graph shows nationwide inventory for existing homes.
 According to the NAR, inventory decreased to 1.64 million in November from 1.77 million in October. Headline inventory is not seasonally adjusted, and inventory usually decreases to the seasonal lows in December and January, and peaks in mid-to-late summer.
The last graph shows the year-over-year (YoY) change in reported existing home inventory and months-of-supply. Since inventory is not seasonally adjusted, it really helps to look at the YoY change. Note: Months-of-supply is based on the seasonally adjusted sales and not seasonally adjusted inventory.
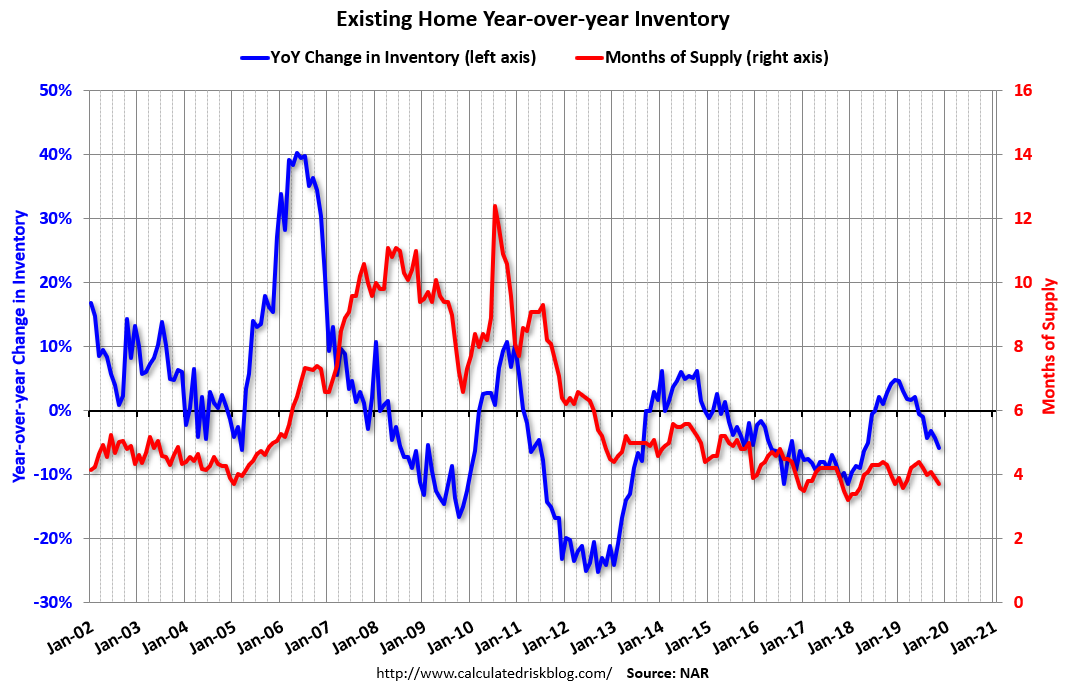 Inventory was down 5.7% year-over-year in November compared to November 2018.
 Months of supply decreased to 3.7 months in November.
This was lower than the consensus forecast. For existing home sales, a key number is inventory - and inventory is still low. I'll have more later …


