 RSS Feed
 by Calculated Risk on 12/10/2018 08:00:00 AM
Monday, December 10, 2018
Black Knight Mortgage Monitor for October
Black Knight released their Mortgage Monitor report for October today. According to Black Knight, 3.64% of mortgages were delinquent in October, down from 4.44% in October 2017. Black Knight also reported that 0.52% of mortgages were in the foreclosure process, down from 0.68% a year ago.
This gives a total of 4.16% delinquent or in foreclosure.
Press Release: Black Knight: Total Tappable Equity Falls for First Time Since Housing Recovery Began; Softening Home Prices in the Most Equity-Rich Markets Driving Decline
Today, the Data & Analytics division of Black Knight, Inc. released its latest Mortgage Monitor Report, based on data as of the end of October 2018. This month, Black Knight looked at full Q3 2018 data to revisit the U.S. home equity landscape, finding that quarterly declines were seen in both total equity and tappable equity, the amount available for homeowners with mortgages to borrow against before hitting a maximum 80 percent combined loan-to-value (LTV) ratio. Ben Graboske, executive vice president of Black Knight’s Data & Analytics division, explained that the decline is being driven by home prices pulling back on a quarterly basis in some of the nation’s most expensive housing markets.
“After seeing a significant slowdown in its growth from the first to second quarters of 2018, the amount of tappable equity fell by $140 billion in Q3 2018,” said Graboske. “That is the first decline we’ve seen since the housing recovery began, and its cause can be traced directly to softening home prices in some of the nation’s most expensive – and equity- rich – markets. Indeed, tappable equity fell in 60 of the 100 largest markets, including 12 of the top 15. Three markets in California alone – San Jose, San Francisco and Los Angeles – accounted for 55 percent of the total net decline. Add Seattle into the mix, and you see that just four markets were behind two-thirds of the net reduction in tappable equity. All were areas where home price growth has far outpaced the national average in recent years, but in which prices fell in Q3 2018 – from as little as one percent in Los Angeles, to a 4.6 percent drop in San Jose.
“Of course, there is still $9.8 trillion in total home equity in the market, some $5.9 trillion of which is tappable. That’s $571 billion more than in Q3 2017, and tappable equity remains near an all-time high. It’s also important to remember that in general third quarters are relatively flat as far as home prices are concerned, and that tappable equity is up on an annual basis in 98 percent of major metro areas. But the fact remains that affordability concerns are beginning to have an impact on home prices, particularly in more expensive markets, and as a result, on homeowner equity as well.
Interestingly enough – although for-sale inventory is up on an annual basis for the first time in four years – an analysis of listings on mortgaged properties suggests that homeowners reluctant to put their current homes on the market due to ‘rate lock’ or ‘affordability lock’ may still be holding down available inventory by about six percent. By constraining the supply of available homes, this in turn may be countering what might otherwise be greater downward pressure on home prices.”
emphasis added
 Click on graph for larger image.
Here is a graph from the Mortgage Monitor showing Black Knight's estimate of active listings (using Realtor.com).
From Black Knight:
• After hitting a post-recession low in January 2018, for sale inventory is up 2% from last year
• That's the first annual increase in more than 4 years, as softening demand causes a net increase in the number of homes listed for sale
• As a point of comparison, and similar to today, the increase in inventory in 2013/2014 was due in part to rising rates putting pressure on the buy side of the housing equation

• Mapping the rise in inventory against 30-year rates, the current increase may be slightly lower and more delayed than expected based on what was observed in 2013/2014 and again in 2015/2016There is much more in the mortgage monitor.
• One potential factor could be homeowners with a mortgage hesitant to list their homes and give up a low fixed interest rate, i.e., "rate lock"
• Despite inventories rising, the average days on market continues to decline, with the median property listed for 68 days, down 5 days on average from a year ago
• Days on market tend to increase as inventories rise, so we may see a shift in coming months
Sunday, December 09, 2018
Monday: Job Openings
by Calculated Risk on 12/09/2018 08:32:00 PM
Weekend:
• Schedule for Week of December 9, 2018
Monday:
• At 10:00 AM ET, Job Openings and Labor Turnover Survey for October from the BLS.
From CNBC: Pre-Market Data and Bloomberg futures: S&P 500 are down 16 and DOW futures are down 165 (fair value).
Oil prices were mixed over the last week with WTI futures at $52.58 per barrel and Brent at $62.15 per barrel. A year ago, WTI was at $57, and Brent was at $64 - so WTI oil prices are down about 10%, and Brent prices down about 3% year-over-year.
Here is a graph from Gasbuddy.com for nationwide gasoline prices. Nationally prices are at $2.42 per gallon. A year ago prices were at $2.46 per gallon, so gasoline prices are down slightly year-over-year.
Hotels: Occupancy Rate Increased Year-over-year, On Pace for Record Year
by Calculated Risk on 12/09/2018 08:17:00 AM
From HotelNewsNow.com: STR: US hotel results for week ending 1 December
The U.S. hotel industry reported positive year-over-year results in the three key performance metrics during the week of 25 November through 1 December 2018, according to data from STR.The following graph shows the seasonal pattern for the hotel occupancy rate using the four week average.
In comparison with the week of 26 November through 2 December 2017, the industry recorded the following:
• Occupancy: +1.0% to 57.3%
• Average daily rate (ADR): +2.2% to US$120.23
• Revenue per available room (RevPAR): +3.3% to US$68.93
…
Houston, Texas, reported the steepest declines in each of the three key performance metrics: occupancy (-17.4% to 56.9%), ADR (-6.8% to US$99.64) and RevPAR (-23.1% to US$56.70).
emphasis added
 Click on graph for larger image.
The red line is for 2018, dash light blue is 2017, blue is the median, and black is for 2009 (the worst year probably since the Great Depression for hotels).
This is the fourth strong year in a row for hotel occupancy. The occupancy rate, year-to-date, is just ahead of the record year in 2017.
Seasonally, the occupancy rate will now decline through the end of the year.
Data Source: STR, Courtesy of HotelNewsNow.com
Saturday, December 08, 2018
Schedule for Week of December 9, 2018
by Calculated Risk on 12/08/2018 08:11:00 AM
The key economic reports this week are November CPI and Retail Sales.
For manufacturing, November industrial production will be released this week.
 10:00 AM ET: Job Openings and Labor Turnover Survey for October from the BLS.
 This graph shows job openings (yellow line), hires (purple), Layoff, Discharges and other (red column), and Quits (light blue column) from the JOLTS.
Jobs openings decreased in September to 7.009 million from 7.293 million in August.
The number of job openings (yellow) were up 12% year-over-year, and Quits were up 11% year-over-year.
6:00 AM: NFIB Small Business Optimism Index for November.
8:30 AM: The Producer Price Index for November from the BLS. The consensus is for no change in PPI, and a 0.1% increase in core PPI.
7:00 AM ET: The Mortgage Bankers Association (MBA) will release the results for the mortgage purchase applications index.
8:30 AM: The Consumer Price Index for November from the BLS. The consensus is for no change in CPI, and a 0.2% increase in core CPI.
8:30 AM ET: The initial weekly unemployment claims report will be released. The consensus is for 228 thousand initial claims, down from 231 thousand the previous week.
 8:30 AM ET: Retail sales for November will be released. The consensus is for a 0.1% increase in retail sales.
This graph shows the year-over-year change in retail sales and food service (ex-gasoline) since 1993. Retail and Food service sales, ex-gasoline, increased by 3.6% on a YoY basis.
 9:15 AM: The Fed will release Industrial Production and Capacity Utilization for November.
This graph shows industrial production since 1967.
The consensus is for a 0.3% increase in Industrial Production, and for Capacity Utilization to increase to 78.5%.
Friday, December 07, 2018
Q4 GDP Forecasts
by Calculated Risk on 12/07/2018 06:01:00 PM
From Merrill Lynch:
Disappointing construction data sliced 0.2pp from our 4Q GDP tracking down to 2.5%, and a tenth off 3Q GDP down to 3.5%. [Dec 7 estimate].And from the Altanta Fed: GDPNow
emphasis added
The GDPNow model estimate for real GDP growth (seasonally adjusted annual rate) in the fourth quarter of 2018 is 2.4 percent on December 7, down from 2.7 percent on December 6. The nowcast of fourth-quarter real final sales of domestic product growth decreased from 2.9 percent to 2.7 percent after this morning’s employment report from the U.S. Bureau of Labor Statistics. The nowcast of the contribution of inventory investment to fourth-quarter real GDP growth decreased from -0.23 percentage points to -0.33 percentage points after the employment report and this morning’s wholesale trade release from the U.S. Census Bureau. [Dec 7 estimate]From the NY Fed Nowcasting Report
The New York Fed Staff Nowcast stands at 2.4% for both 2018:Q4 and 2019:Q1 [Dec 7 estimate]CR Note: These early estimates suggest GDP in the mid 2s for Q4.
Lawler: Some Early Realtor/MLS Based Reports on Home Sales and Active Listings for November
by Calculated Risk on 12/07/2018 03:14:00 PM
The table below is from housing economist Tom Lawler: Some Early Realtor/MLS Based Reports on Home Sales and Active Listings for November
CR Note: Earlier I posted on "Seattle", but that was really data for all of King County. Tom Lawler breaks out the City of Seattle below.
| MLS Home Sales | Active Listings* | |||||
|---|---|---|---|---|---|---|
| Nov-18 | Nov-17 | % Chg | Nov-18 | Nov-17 | % Chg | |
| Denver | 3,732 | 4,885 | -23.6% | 7,530 | 5,131 | 46.8% |
| Colorado Springs | 1,277 | 1,422 | -10.2% | 2,319 | 1,745 | 32.9% |
| Greater Las Vegas | 2,857 | 3,202 | -10.8% | 8,608 | 5,274 | 63.2% |
| Reno (SF) | 456 | 512 | -10.9% | 1,237 | 767 | 61.3% |
| NW Washington State | 6,837 | 8,068 | -15.3% | 15,830 | 11,193 | 41.4% |
| King County | 2,258 | 2,821 | -20.0% | 5,241 | 2,234 | 134.6% |
| City of Seattle | 667 | 889 | -25.0% | 1,660 | 534 | 210.9% |
| *Note: the definition of “active” listings can vary across MLS. For Vegas, the above data representing listings without an offer. | ||||||
Seattle Real Estate in November: Sales Down 20% YoY, Inventory up 135% YoY
by Calculated Risk on 12/07/2018 12:39:00 PM
The Northwest Multiple Listing Service reported Home buyers have "window of opportunity" with shift to more balanced market
With more plentiful inventory, recently announced increases in lending limits, and moderating prices, prospective home buyers are finding more options around Western Washington, according to industry experts from Northwest Multiple Listing Service.The press release is for the Northwest. In Seattle, sales were down 19.96% year-over-year, and inventory was up 134.6% year-over-year. This is another market with inventory increasing sharply year-over-year, but months-of-supply in Seattle is still on the low side at 2.3 months.
"Moderating interest rates over the past few weeks could provide a window of opportunity for buyers this month, even if the Fed is widely expected to raise them again in December," said Mike Grady, president and COO of Coldwell Banker Bain.
"We are continuing to see a balancing of the market," Grady stated, citing moderating prices and increasing inventory as contributing factors in comments about the latest figures from Northwest Multiple Listing Service.
House hunters have a much bigger selection than a year ago. Northwest MLS figures for the 23 counties in its report show the year-over-year volume of inventory rose from 11,193 homes and condos to 15,830. The increase in active listings represents a gain of more than 41 percent. Members added 6,399 new listings to inventory last month, up from 6,098 for the same month a year ago.
King County registered the biggest gains, with active inventory surging 135 percent from a year ago. The number of single family homes more than doubled from a year ago, rising from 1,879 to 4,020, while the condo selection more than tripled, jumping from 355 active listings twelve months ago to last month's total of 1,221. Eight counties reported fewer listings than a year ago.
"Months of inventory is still slim compared to historical norms," Grady emphasized. Using this metric, both King County and the Northwest MLS market area overall have 2.3 months of supply. While supply is improving, it's still well below the 4-to-6 month level industry analysts use as a gauge of a balanced market.
The surge in supply is not yet reflected in sales during this typically slower holiday season. Pending sales for November were down 10.4 percent from a year ago. Thirteen of the 23 counties in the report registered drops in pending sales versus a year ago. Compared with October, mutually accepted offers fell 17.5 percent. That was less than the falloff in 2017, when the volume of pending sales from October to November shrunk by 21.5 percent. Closed sales declined about 15.3 percent from twelve months ago, with 13 counties reporting double-digit drops. Year-over-year prices still rose (up 4.2 percent overall). Ten counties had double-digit appreciation in their median sales price for single family homes and condos (combined).
emphasis added
Comments on November Employment Report
by Calculated Risk on 12/07/2018 10:00:00 AM
The headline jobs number at 155 thousand for November was below consensus expectations of 190 thousand, and the previous two months were revised down 12 thousand, combined. The unemployment rate was unchanged at 3.7%. Still this was a decent report.
Earlier: November Employment Report: 155,000 Jobs Added, 3.7% Unemployment Rate
In November, the year-over-year employment change was 2.443 million jobs. This is solid year-over-year growth.
Seasonal Retail Hiring
Typically retail companies start hiring for the holiday season in October, and really increase hiring in November. Here is a graph that shows the historical net retail jobs added for October, November and December by year.
 Click on graph for larger image.
This graph really shows the collapse in retail hiring in 2008. Since then seasonal hiring has increased back close to more normal levels. Note: I expect the long term trend will be down with more and more internet holiday shopping.
Retailers hired 464 thousand workers (NSA) net in November. Note: this is NSA (Not Seasonally Adjusted).
Just like last year, there was a surge in seasonal hiring in November.
Average Hourly Earnings
Wage growth was close to expectations in November. From the BLS:
"In November, average hourly earnings for all employees on private nonfarm payrolls rose by 6 cents to $27.35. Over the year, average hourly earnings have increased by 81 cents, or 3.1 percent."
 This graph is based on “Average Hourly Earnings” from the Current Employment Statistics (CES) (aka "Establishment") monthly employment report. Note: There are also two quarterly sources for earnings data: 1) “Hourly Compensation,” from the BLS’s Productivity and Costs; and 2) the Employment Cost Index which includes wage/salary and benefit compensation.
The graph shows the nominal year-over-year change in "Average Hourly Earnings" for all private employees. Nominal wage growth was at 3.1% YoY in November.
Wage growth has generally been trending up.
Prime (25 to 54 Years Old) Participation
 Since the overall participation rate has declined due to cyclical (recession) and demographic (aging population, younger people staying in school) reasons, here is the employment-population ratio for the key working age group: 25 to 54 years old.
In the earlier period the participation rate for this group was trending up as women joined the labor force. Since the early '90s, the participation rate moved more sideways, with a downward drift starting around '00 - and with ups and downs related to the business cycle.
The 25 to 54 participation rate decreased in November to 82.2%, and the 25 to 54 employment population ratio was unchanged at 79.7%.
Part Time for Economic Reasons
 From the BLS report:
"The number of persons employed part time for economic reasons (sometimes referred to as involuntary part-time workers), at 4.8 million, changed little in November. These individuals, who would have preferred full-time employment, were working part time because their hours had been reduced or they were unable to find full-time jobs."The number of persons working part time for economic reasons has been generally trending down. The number increased in November. The number working part time for economic reasons suggests there is still a little slack in the labor market.
These workers are included in the alternate measure of labor underutilization (U-6) that increased to 7.6% in November. This is the highest level for U-6 since June.
Unemployed over 26 Weeks
 This graph shows the number of workers unemployed for 27 weeks or more.
 According to the BLS, there are 1.253 million workers who have been unemployed for more than 26 weeks and still want a job. This was down from 1.373 million in October.
Summary:
The headline jobs number was below expectations. The headline unemployment rate was unchanged at 3.7%, tying the previous two month for the lowest rate since 1969. And wage growth was at expectations, and above 3% YoY for the second consecutive month.
Overall, this was a decent report. For the first eleven months of 2018, job growth has been solid, averaging 206 thousand per month.
November Employment Report: 155,000 Jobs Added, 3.7% Unemployment Rate
by Calculated Risk on 12/07/2018 08:43:00 AM
From the BLS:
Total nonfarm payroll employment increased by 155,000 in November, and the unemployment rate remained unchanged at 3.7 percent, the U.S. Bureau of Labor Statistics reported today. Job gains occurred in health care, in manufacturing, and in transportation and warehousing.
...
The change in total nonfarm payroll employment for October was revised down from +250,000 to +237,000, and the change for September was revised up from +118,000 to +119,000. With these revisions, employment gains in September and October combined were 12,000 less than previously reported.
...
In November, average hourly earnings for all employees on private nonfarm payrolls rose by 6 cents to $27.35. Over the year, average hourly earnings have increased by 81 cents, or 3.1 percent.
emphasis added
 Click on graph for larger image.
The first graph shows the monthly change in payroll jobs, ex-Census (meaning the impact of the decennial Census temporary hires and layoffs is removed - mostly in 2010 - to show the underlying payroll changes).
Total payrolls increased by 155 thousand in November (private payrolls increased 161 thousand).
Payrolls for September and October were revised down 12 thousand combined.
 This graph shows the year-over-year change in total non-farm employment since 1968.
In November the year-over-year change was 2.443 million jobs.
The third graph shows the employment population ratio and the participation rate.
 The Labor Force Participation Rate was unchanged in November at 62.9%. This is the percentage of the working age population in the labor force. A large portion of the recent decline in the participation rate is due to demographics and long term trends.
The Employment-Population ratio was unchanged at 60.6% (black line).
I'll post the 25 to 54 age group employment-population ratio graph later.
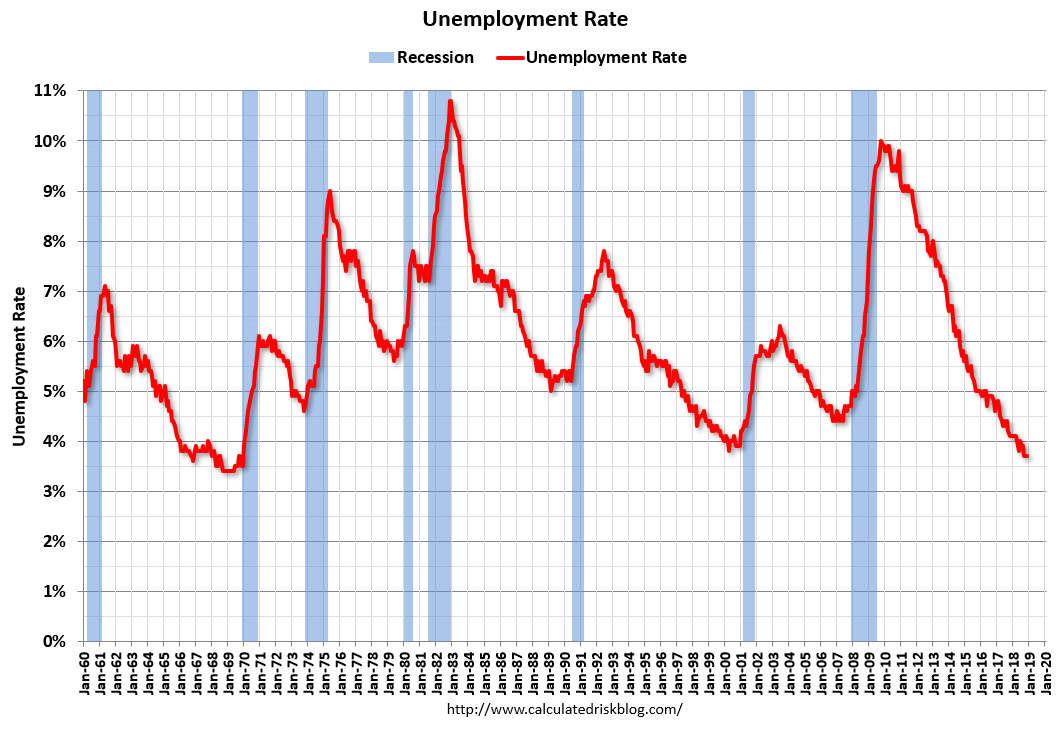 The fourth graph shows the unemployment rate.
 The unemployment rate was unchanged in November at 3.7%.
This was below the consensus expectations of 190,000 jobs added, and September and October were revised down, combined. Still a decent report.
I'll have much more later ...
Thursday, December 06, 2018
Friday: Employment Report
by Calculated Risk on 12/06/2018 08:29:00 PM
My November Employment Preview
Goldman: November Payrolls Preview
Friday:
• At 8:30 AM, Employment Report for November. The consensus is for 190,000 jobs added, and for the unemployment rate to be unchanged at 3.7%.
• At 10:00 AM, University of Michigan's Consumer sentiment index (Preliminary for December).
• At 3:00 PM, Consumer Credit from the Federal Reserve.


