 RSS Feed
 by Calculated Risk on 12/09/2012 10:15:00 AM
Sunday, December 09, 2012
FOMC Projections Preview
There are two key topics for the FOMC meeting this week: 1) What action to take when Operation Twist concludes at the end of year, and 2) whether or not to adopt a threshold rule for the Feds Fund Rate based on inflation and unemployment, and remove the forward guidance sentence from the statement.
My expectation is the FOMC will announce additional security purchases starting in January after the conclusion of Operation Twist. This will probably be announced this week and will be funded with reserve creation that will expand the Fed balance sheet. Note: Operation Twist didn't increase the Fed's balance sheet, but changed the composition of their securities holdings by selling short-term Treasury securities and buying longer-term Treasury securities.
The key questions are: the size of the additional purchases (some FOMC members have argued for $45 billion per month), the composition and maturity of the assets (Treasuries and MBS), and how long the purchases will continue (along with QE3). Goldman Sachs estimates:
"Looking further ahead, based on our economic forecasts the Fed may purchase up to $2 trillion in Treasury securities and MBS under QE3, before the first fed funds rate hike in early 2016."On thresholds: Currently the Fed has been including projections of when participants think the first rate increase will happen, and the FOMC statement includes the sentence: "[the FOMC] currently anticipates that exceptionally low levels for the federal funds rate are likely to be warranted at least through mid-2015". The could be replaced with general rules based on the unemployment rate and inflation.
Here are a couple of excerpts from the FOMC minutes for the October meeting:
Participants generally favored the use of economic variables, in place of or in conjunction with a calendar date, in the Committee's forward guidance, but they offered different views on whether quantitative or qualitative thresholds would be most effective. Many participants were of the view that adopting quantitative thresholds could, under the right conditions, help the Committee more clearly communicate its thinking about how the likely timing of an eventual increase in the federal funds rate would shift in response to unanticipated changes in economic conditions and the outlook.So the FOMC is leaning towards changing to thresholds, but it appears there is more work to do. This communication change could happen at the meeting this week, but my feeling is the FOMC will wait until early 2013.
...
Participants generally agreed that the Committee would need to resolve a number of practical issues before deciding whether to adopt quantitative thresholds to communicate its thinking about the timing of the initial increase in the federal funds rate. These issues included whether to specify such thresholds in terms of realized or projected values of inflation and the unemployment rate and, in either case, what values for those thresholds would best balance the Committee's objectives of promoting maximum employment and price stability. Another open question was whether to supplement thresholds expressed in terms of the unemployment rate and inflation with additional indicators of economic and financial conditions that might signal a need either to raise the federal funds rate before a threshold is crossed or to delay until well afterward.
emphasis added
In advance of the meeting, here is a look back at the previous projections from the September meeting.
 Click on graph for larger image.
The first two charts are when participants project the initial increase in the target federal funds rate should occur, and the participants view of the appropriate path of the federal funds rate.
"The shaded bars represent the number of FOMC participants who project that the initial increase in the target federal funds rate (from its current range of 0 to ¼ percent) would appropriately occur in the specified calendar year."
If the FOMC moves to thresholds, this graph might be removed. However I expect the FOMC to wait until next year for thresholds, and the key will be to see if the views have shifted for when the first rate hike will occur.
 "The dots represent individual policymakers’ projections of the appropriate federal funds rate target at the end of each of the next several years and in the longer run. Each dot in that chart represents one policymaker’s projection."
Most participants still think the Fed Funds rate will be in the current range through 2014.
On the projections, it looks like GDP and inflation will be close to the September FOMC projections. However the unemployment rate will be lower than projected. The key will be to look for changes in the 2013 and 2014 forecasts.
| GDP projections of Federal Reserve Governors and Reserve Bank presidents | |||
|---|---|---|---|
| Change in Real GDP1 | 2012 | 2013 | 2014 |
| Sept 2012 Projections | 1.7 to 2.0 | 2.5 to 3.0 | 3.0 to 3.8 |
Fiscal policy uncertainty makes it even more difficult to forecast GDP for 2013, but I expect the FOMC will revise down their 2013 forecasts.
The unemployment rate was at 7.9% in October and 7.7% in November (average of 7.8%). This is below the September projections, and suggests the unemployment rate projections for 2013 and 2014 will be revised down.
| Unemployment projections of Federal Reserve Governors and Reserve Bank presidents | |||
|---|---|---|---|
| Unemployment Rate2 | 2012 | 2013 | 2014 |
| Sept 2012 Projections | 8.0 to 8.2 | 7.6 to 7.9 | 6.7 to 7.3 |
Both measures of inflation will be close to the September projections, and I expect the forecasts for inflation will show the FOMC is still not concerned about inflation going forward.
| Inflation projections of Federal Reserve Governors and Reserve Bank presidents | |||
|---|---|---|---|
| PCE Inflation1 | 2012 | 2013 | 2014 |
| Sept 2012 Projections | 1.7 to 1.8 | 1.6 to 2.0 | 1.6 to 2.0 |
Here is core inflation:
| Core Inflation projections of Federal Reserve Governors and Reserve Bank presidents | |||
|---|---|---|---|
| Core Inflation1 | 2012 | 2013 | 2014 |
| Sept 2012 Projections | 1.7 to 1.9 | 1.7 to 2.0 | 1.8 to 2.0 |
Conclusion: I expect the FOMC to announce additional asset purchases at the meeting this week (to start at the conclusion of Operation Twist). It seems the FOMC will move to thresholds, but probably not until next year. On projections, I expect GDP to be revised down for 2013, and the unemployment rate to be revised lower for 2013 and 2014.
Saturday, December 08, 2012
Unofficial Problem Bank list declines to 849 Institutions
by Calculated Risk on 12/08/2012 07:05:00 PM
The first unofficial problem bank list was published in August 2009 with 389 institutions. The number of unofficial problem banks grew steadily and peaked at 1,002 institutions on June 10, 2011. The list has been declining since then.
This is an unofficial list of Problem Banks compiled only from public sources.
Here is the unofficial problem bank list for Dec 7, 2012.
Changes and comments from surferdude808:
Nothing to report this week than removals to the Unofficial Problem Bank List. Seven institutions were removed, which leaves the list at 849 institutions with assets of $316.2 billion. From last week, assets dropped by $10.2 billion, but $4.9 billion of the decline came from balance sheet shrinkage during the third quarter. A year ago, the list held 977 institutions with assets of $399.5 billion.Earlier:
The Federal Reserve terminated actions against Hanmi Bank, Los Angeles, CA ($2.8 billion Ticker: HAFC) and Anadarko Bank and Trust Company, Anadarko, OK ($67 million).
The following institutions were removed through voluntary merger -- Southern Community Bank and Trust, Winston Salem, NC ($1.4 billion); South Valley Bank & Trust, Klamath Falls, OR ($836 million); Flatbush Federal Savings and Loan Association, Brooklyn, NY ($137 million Ticker: FLTB); Bank 1st, Albuquerque, NM ($61 million); and Lone Summit Bank, Lake Lotawana, MO ($21 million).
Next week's activity likely will be mostly removals as the OCC probably will wait until the 17th to publish its actions through November.
• Summary for Week Ending Dec 7th
• Schedule for Week of Dec 9th
Hotel Occupancy Rate above pre-recession levels at end of November
by Calculated Risk on 12/08/2012 03:40:00 PM
From HotelNewsNow.com: STR: US results for week ending 1 December
In year-over-year comparisons, occupancy was up 2.5 percent to 52.2 percent, average daily rate rose 3.5 percent to US$103.00 and revenue per available room increased 6.2 percent to US$53.74.The 4-week average is above the pre-recession levels (the 4-week average is at 56.0% - for the same week in 2007, the 4-week average was at 54.8%).
Note: ADR: Average Daily Rate, RevPAR: Revenue per Available Room.
The following graph shows the seasonal pattern for the hotel occupancy rate using a four week average.
 Click on graph for larger image.
The red line is for 2012, yellow is for 2011, blue is "normal" and black is for 2009 - the worst year since the Great Depression for hotels.
The occupancy rate will continue to decline over the next month as business travel slows for the holidays. The next key period is for spring business travel.
Data Source: Smith Travel Research, Courtesy of HotelNewsNow.com
Earlier:
• Summary for Week Ending Dec 7th
• Schedule for Week of Dec 9th
Schedule for Week of Dec 9th
by Calculated Risk on 12/08/2012 01:11:00 PM
Earlier:
• Summary for Week Ending Dec 7th
The key event this week is the two day FOMC meeting on Tuesday and Wednesday. With the coming conclusion of Operation Twist, there is a very strong possibility that the Fed will announce additional accommodation.
The key reports for this week will be the October trade balance report on Tuesday, the November retail sales report on Thursday, Industrial Production on Friday, and November CPI also on Friday.
No economic releases scheduled.
7:30 AM ET: NFIB Small Business Optimism Index for November. The consensus is for a decrease to 92.5 from 93.1 in October.
 8:30 AM: Trade Balance report for October from the Census Bureau.
 This graph is through September. Both exports and imports increased in September, and exports were at a new high.
The consensus is for the U.S. trade deficit to increase to $42.8 billion in October, up from from $41.5 billion in September. Export activity to Europe will be closely watched due to economic weakness. Note: the strike at the ports of Long Beach and Los Angeles started in late November, and this report is for October.
 10:00 AM: Job Openings and Labor Turnover Survey for October from the BLS.
 This graph shows job openings (yellow line), hires (purple), Layoff, Discharges and other (red column), and Quits (light blue column) from the JOLTS.
Jobs openings decreased in September to 3.561 million, down slightly from 3.661 million in August. The number of job openings (yellow) has generally been trending up, and openings are only up about 2% year-over-year compared to September 2011.
10:00 AM: Monthly Wholesale Trade: Sales and Inventories for October. The consensus is for a 0.4% increase in inventories.
7:00 AM: The Mortgage Bankers Association (MBA) will release the mortgage purchase applications index.
8:30 AM: Import and Export Prices for November. The consensus is a 0.4% decrease in import prices.
12:30 PM: FOMC Meeting Announcement. With Operation Twist ending in a few weeks, the FOMC will probably announce additional policy accommodation that will start in January.
2:00 PM: FOMC Forecasts The will include the Federal Open Market Committee (FOMC) participants' projections of the appropriate target federal funds rate along with the quarterly economic projections.
2:15 PM: Fed Chairman Ben Bernanke holds a press briefing following the FOMC announcement.
8:30 AM: The initial weekly unemployment claims report will be released. The consensus is for claims to be unchanged at 370 thousand.
8:30 AM: Producer Price Index for November. The consensus is for a 0.5% decrease in producer prices (0.2% increase in core).
 8:30 AM ET: Retail sales for November will be released. October retail sales (especially auto sales) were impacted by Hurricane Sandy, and auto sales bounced back in November.
This graph shows retail sales since 1992. This is monthly retail sales and food service, seasonally adjusted (total and ex-gasoline). Retail sales are up 24.2% from the bottom, and now 8.6% above the pre-recession peak (not inflation adjusted)
The consensus is for retail sales to increase 0.6% in November, and to be unchanged ex-autos.
8:30 AM: Consumer Price Index for November. The consensus is for CPI to decrease 0.2% in November and for core CPI to increase 0.2%.
 9:15 AM: The Fed will release Industrial Production and Capacity Utilization for November.
This shows industrial production since 1967.
The consensus is for a 0.3% increase in Industrial Production in November, and for Capacity Utilization to increase to 78.0%.
Summary for Week Ending Dec 7th
by Calculated Risk on 12/08/2012 08:05:00 AM
The November employment report was better than expected, but mostly because expectations were so low due to Hurricane Sandy. A couple of employments highlights: seasonal retail hiring was surprisingly strong (could indicate a decent holiday retail season), and it appears the state and local government layoffs are mostly over.
On Monday we saw dueling headlines: "ISM Manufacturing index lowest since July 2009" and "Auto Sales highest since 2007". Both reports were probably impacted by Hurricane Sandy, with a negative impact on manufacturing, and auto sales were bouncing back from a weak October. The reality is the economy is still growing - sluggishly - although manufacturing remains a weak sector.
Other reports were mostly positive: the ISM service index was above expectations, construction spending continues to increase, and initial weekly unemployment claims are declining following the Hurricane Sandy spike. A negative on Friday was consumer sentiment, and that may be impacted by the austerity debate (aka "Fiscal cliff) and the apparent lack of progress.
On the Fiscal Cliff, at Goldman Sachs economist Alec Phillips wrote yesterday:
While we still believe an agreement is slightly more likely before year end, there is a clear possibility that it could slip to late December or even early 2013. That said, we remain confident that Congress will resolve the issue by mid-January.I expect an agreement to be reached, but probably not until January so politicians can claim they didn't vote for a tax increase (the tax cuts expire at the end of the year). I also expect the agreement to include raising the debt ceiling.
There are two potential paths to an agreement. The current focus is a comprehensive package of tax revenue increases, spending reductions, and an increase in the debt limit. In a broad package, the risk would probably be toward slightly more expansive fiscal policy than we assume in our forecast, since some changes (e.g., the scheduled payroll tax increase) might be phased in more slowly as a result of a political compromise.
Fallback plans have also gained recent attention. One alternative would be for the House of Representatives to simply pass an extension of the middle-income tax cuts. This would avoid the largest single source of fiscal restraint scheduled for 2013, but it would lead to more fiscal restraint than we expect if other aspects of the fiscal cliff are not addressed. Moreover, failure to increase the debt limit would create a second source of uncertainty in early 2013.
Here is a summary of last week in graphs:
• November Employment Report: 146,000 Jobs, 7.7% Unemployment Rate
 Click on graph for larger image.
With all the uncertainty about the impact of Hurricane Sandy, this was a decent report, especially with the decline in the unemployment rate. However, negatives include the downward revisions to prior months, and the decline in the participation rate.
The headline number was above expectations of 80,000, but both September and October payroll growth was revised down.
The second graph shows the unemployment rate. The unemployment rate declined to 7.7%.
 The unemployment rate is from the household report.
The unemployment rate declined because of lower participation (a decline in the civilian labor force).
The third graph shows the employment population ratio and the participation rate.
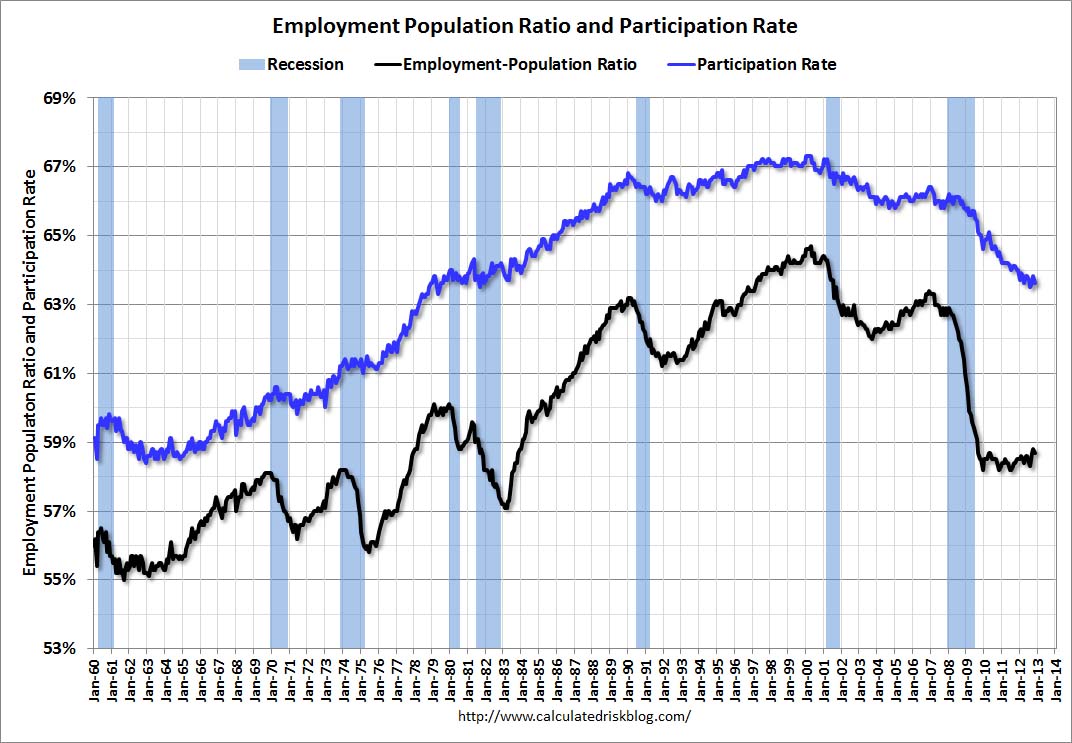 The Labor Force Participation Rate decreased to 63.6% in November (blue line. This is the percentage of the working age population in the labor force.
The participation rate is well below the 66% to 67% rate that was normal over the last 20 years, although most of the recent decline is due to demographics.
The Employment-Population ratio decreased to 58.7% in November (black line). I'll post the 25 to 54 age group employment-population ratio graph later.
 The fourth graph shows the job losses from the start of the employment recession, in percentage terms, compared to previous post WWII recessions. The dotted line is ex-Census hiring.
This shows the depth of the recent employment recession - worse than any other post-war recession - and the relatively slow recovery due to the lingering effects of the housing bust and financial crisis.
According to the BLS employment report, retailers hired seasonal workers at a record pace in November.
 Typically retail companies start hiring for the holiday season in October, and really increase hiring in November. Here is a graph that shows the historical net retail jobs added for October, November and December by year.
This really shows the collapse in retail hiring in 2008. Since then seasonal hiring has increased back to normal levels.
Retailers hired 465.5 thousand workers (NSA) net in November. The combined level for October and November is the highest ever. Note: this is NSA (Not Seasonally Adjusted).
This suggests retailers are fairly optimistic about the holiday season. There is a decent correlation between retail hiring and retail sales, see: Retail: Seasonal Hiring vs. Retail Sales
 This graph shows total state and government payroll employment since January 2007. State and local governments lost 129,000 jobs in 2009, 262,000 in 2010, and 230,000 in 2011. So far in 2012, state and local governments have actually added a few jobs, and state and local government employment increased by 4,000 in November.
Note: The dashed line shows an estimate including the benchmark revision.
It appears most of the state and local government layoffs are over, however the Federal government layoffs are ongoing. Overall government employment has seen an unprecedented decline over the last 3+ years (not seen since the Depression).
• U.S. Light Vehicle Sales at 15.5 million annual rate in November, Highest Since 2007
 Based on an estimate from Autodata Corp, light vehicle sales were at a 15.54 million SAAR in November. That is up 15% from November 2011, and up 9% from the sales rate last month. This is the highest level of sales since December 2007.
This was above the consensus forecast of 15.0 million SAAR (seasonally adjusted annual rate), however some of the increase was a bounce back from Hurricane Sandy that negatively impacted sales at the end of October.
Note: dashed line is current estimated sales rate.
Most (or all) of the month-to-month decline in October was related to Hurricane Sandy, and some of the sharp increase this month was a bounce back.
• ISM Manufacturing index declines in November to 49.5, Lowest since July 2009
 The ISM manufacturing index indicated contraction in November. PMI was at 49.5% in November, down from 51.7% in October. The employment index was at 48.4%, down from 52.1%, and the new orders index was at 50.3%, down from 54.2%.
Here is a long term graph of the ISM manufacturing index.
This was well below expectations of 51.7% and suggests manufacturing contracted in November.
• ISM Non-Manufacturing Index increases in November
 The November ISM Non-manufacturing index was at 54.7%, up from 54.2% in October. The employment index decreased in November to 50.3%, down from 54.9% in October. Note: Above 50 indicates expansion, below 50 contraction.
 This graph shows the ISM non-manufacturing index (started in January 2008) and the ISM non-manufacturing employment diffusion index.
This was above the consensus forecast of 53.6% and indicates faster expansion in November than in October. The internals were mixed with the employment index down, but new orders up.
• Construction Spending increased in October
 This graph shows private residential and nonresidential construction spending, and public spending, since 1993. Note: nominal dollars, not inflation adjusted.
Private residential spending is 57% below the peak in early 2006, and up 32% from the post-bubble low. Non-residential spending is 28% below the peak in January 2008, and up about 31% from the recent low.
Public construction spending is now 14% below the peak in March 2009 and just above the post-bubble low.
Looking forward, private residential construction spending will be the largest category again very soon - but spending is still very low (at 1998 levels not adjusted for inflation).
• Weekly Initial Unemployment Claims decline to 370,000
 "In the week ending December 1, the advance figure for seasonally adjusted initial claims was 370,000, a decrease of 25,000 from the previous week's revised figure of 395,000."
The dashed line on the graph is the current 4-week average. The four-week average of weekly unemployment claims increased to 408,000.
This sharp increase in the 4 week average is due to Hurricane Sandy as claims increased significantly in NY, NJ and other impacted areas over the 4-week period (some of those areas saw another decline this week). Note the spike in 2005 was related to hurricane Katrina - we are seeing a similar impact, although on a smaller scale.
Weekly claims were lower than the consensus forecast.
• Preliminary Consumer Sentiment lower in December
 The preliminary Reuters / University of Michigan consumer sentiment index for December declined to 74.5 from the November reading of 82.7.
This was way below the consensus forecast of 83.0. There are a number of factors that can impact sentiment including unemployment, gasoline prices and other concerns.
Back in August 2011, sentiment declined sharply due to the threat of default and the debt ceiling debate. Hopefully we will not see a repeat of that debacle.
Friday, December 07, 2012
"Oil to the World"
by Calculated Risk on 12/07/2012 10:41:00 PM
A holiday carol from Versus Plus, Marcy Shaffer and Greg Hilfman: "Oil to the World".
Earlier on employment:
• November Employment Report: 146,000 Jobs, 7.7% Unemployment Rate
• Employment Report: More Positives than Negatives
• All Employment Graphs
November Employment Diffusion Indexes
by Calculated Risk on 12/07/2012 08:24:00 PM
Earlier on employment:
• November Employment Report: 146,000 Jobs, 7.7% Unemployment Rate
• Employment Report: More Positives than Negatives
• All Employment Graphs
This is a technical indicator that I like to follow. The employment diffusion indexes are a measure of how widespread job gains are across industries. The further from 50 (above or below), the more widespread the job losses or gains reported by the BLS. From the BLS:
Figures are the percent of industries with employment increasing plus one-half of the industries with unchanged employment, where 50 percent indicates an equal balance between industries with increasing and decreasing employment.
 Click on graph for larger image.
The BLS diffusion index for total private employment was at 59.0 in November, down from 63.0 in October. For manufacturing, the diffusion index declined to 47.5, down from 56.8 in October.
We'd like to see the diffusion indexes consistently above 60 - and even in the 70s like in the '1990s. But even 59 isn't bad and this suggests job growth was spread across a number of industries in November.
AAR: Rail Traffic "mixed" in November
by Calculated Risk on 12/07/2012 03:51:00 PM
Once again rail traffic was "mixed". Most of the decline in rail carloads was due to fewer coal and grain shipments, and intermodal was up - but the strike at the ports of Los Angeles and Long Beach limited the increase.
From the Association of American Railroads (AAR): AAR Reports Mixed Rail Traffic for November
Intermodal traffic in November saw an increase for the 36th straight month, totaling 934,595 containers and trailers, up 1.2 percent (11,519 units) compared with November of 2011. Carloads originated in November totaled 1,130,770 carloads, down 4 percent (47,512 carloads) compared with the same month last year. Carloads excluding coal and grain were up 5.5 percent for the month, or 30,466 carloads, compared with the same month last year.
...
“Coal and grain together account for almost half of non-intermodal U.S. rail traffic, so they are obviously very important to railroads. But coal and grain carloads often rise or fall for reasons that have little or nothing to do with the economy. Other commodity categories like autos, lumber, and crushed stone, sand and gravel that are more highly correlated with economic growth have been growing, which we hope is a good sign for the economy moving forward,” said AAR Senior Vice President John T. Gray.
 Click on graph for larger image.
This graph shows U.S. average weekly rail carloads (NSA).
U.S. railroads originated 1,130,770 carloads in November 2012, down 4.0% (47,512 carloads) from November 2011 on a non-seasonally adjusted basis. November marked the 10th straight year-over-year monthly carload decline for U.S. railroads ...The second graph is for intermodal traffic (using intermodal or shipping containers):
Coal and grain were, again in November, the main reasons for the decline in total U.S. carloads. Coal carloads were down 12.8% (68,837 carloads) for the month; grain carloads were down 10.7% (9,141 carloads) for the month.
 Graphs reprinted with permission.
Intermodal traffic is near peak levels.
U.S. rail intermodal traffic totaled 934,595 containers and trailers in November 2012, up 1.2% (11,519 intermodal units) over November 2011 and an average of 233,649 per week ... As of November 2012, year-over-year U.S. rail intermodal traffic had risen for 36 straight months, but the 1.2% gain in November was the smallest such increase since August 2011. Part of the reason for that is a strike by harbor clerks at the Ports of Los Angeles and Long Beach that began on November 26 and was settled on December 5. The two ports are by far the first and second highest-volume container ports in the country and are the source and destination for large amounts of U.S. rail intermodal traffic.This suggests economic growth.
Earlier on employment:
• November Employment Report: 146,000 Jobs, 7.7% Unemployment Rate
• Employment Report: More Positives than Negatives
• All Employment Graphs
Employment Report: More Positives than Negatives
by Calculated Risk on 12/07/2012 11:28:00 AM
There were positives and negatives in the November employment report, and I'd like to start with two clear positives.
First, seasonal retail hiring was very strong in November (see 3rd graph below). There is a fairly strong correlation between seasonal hiring and holiday retail sales, and this record seasonal hiring suggests a solid holiday season.
Second, a key theme we've been discussing is that we are nearing the end of state and local government layoffs (see last graph). This has been ongoing for over 3 years, and it appears the drag from state and local governments is mostly over. Of course employment at the Federal level is still shrinking, and everyone expects more austerity in 2013.
Other positives include better than expected employment growth, the decline in the unemployment rate to 7.7% (the lowest level since December 2008), a decline in part time workers, and a decline in the long term unemployed (although this is still very high).
Negatives include the decline in the participation rate, the downward revision to payroll jobs in previous months, and no change in hours worked.
However, overall, I think there were more positives than negatives in this report. Here are a several more graphs...
Employment-Population Ratio, 25 to 54 years old
 Click on graph for larger image.
Since the participation rate has declined recently due to cyclical (recession) and demographic (aging population) reasons, an important graph is the employment-population ratio for the key working age group: 25 to 54 years old.
In the earlier period the employment-population ratio for this group was trending up as women joined the labor force. The ratio has been mostly moving sideways since the early '90s, with ups and downs related to the business cycle.
This ratio should probably move close to 80% as the economy recovers. The ratio declined in November to 75.7% from 76.0% in October. Not good news.
Percent Job Losses During Recessions

This graph shows the job losses from the start of the employment recession, in percentage terms - this time aligned at maximum job losses.
In the earlier post, the graph showed the job losses aligned at the start of the employment recession.
This financial crisis recession was much deeper than other post WWII recessions, and the recovery has been slower (the recovery from the 2001 recession was slow too). However, if we compare to other financial crisis recoveries, this recovery has actually been better than most.
Seasonal Retail Hiring
According to the BLS employment report, retailers hired seasonal workers at a record pace in November.
Typically retail companies start hiring for the holiday season in October, and really increase hiring in November. Here is a graph that shows the historical net retail jobs added for October, November and December by year.
This really shows the collapse in retail hiring in 2008. Since then seasonal hiring has increased back close to more normal levels. Note: I expect the long term trend will be down with more and more internet holiday shopping.
Retailers hired 465.5 thousand workers (NSA) net in November. The combined level for October and November is the highest ever. Note: this is NSA (Not Seasonally Adjusted).
This suggests retailers are fairly optimistic about the holiday season. There is a decent correlation between retail hiring and retail sales, see: Retail: Seasonal Hiring vs. Retail Sales
Part Time for Economic Reasons
 From the BLS report:
The number of persons employed part time for economic reasons (sometimes referred to as involuntary part-time workers), at 8.2 million in November, was little changed over the month. These individuals were working part time because their hours had been cut back or because they were unable to find a full-time job.The number of part time workers declined in November to 8.18 millon from 8.34 million in October.
These workers are included in the alternate measure of labor underutilization (U-6) that declined to 14.4% in November (from 14.6% in October).
Unemployed over 26 Weeks
 This graph shows the number of workers unemployed for 27 weeks or more.
 According to the BLS, there are 4.79 million workers who have been unemployed for more than 26 weeks and still want a job. This was down from 5.00 million in October, and is at the lowest level since June 2009. This is generally trending down, but is still very high. Long term unemployment remains one of the key labor problems in the US.
State and Local Government
This graph shows total state and government payroll employment since January 2007. State and local governments lost 129,000 jobs in 2009, 262,000 in 2010, and 230,000 in 2011. So far in 2012, state and local governments have actually added a few jobs, and state and local government employment increased by 4,000 in November.Note: The dashed line shows an estimate including the benchmark revision.
It appears most of the state and local government layoffs are over, however the Federal government layoffs are ongoing. Overall government employment has seen an unprecedented decline over the last 3+ years (not seen since the Depression).
Preliminary December Consumer Sentiment declines sharply to 74.5
by Calculated Risk on 12/07/2012 09:55:00 AM
Note: I'll have more on the employment report soon.
Click on graph for larger image.
The preliminary Reuters / University of Michigan consumer sentiment index for December declined to 74.5 from the November reading of 82.7.
This was way below the consensus forecast of 83.0. There are a number of factors that can impact sentiment including unemployment, gasoline prices and other concerns.
Back in August 2011, sentiment declined sharply due to the threat of default and the debt ceiling debate. Unfortunately we might be seeing a repeat of that debacle.


