by Calculated Risk on 12/07/2012 03:51:00 PM
Friday, December 07, 2012
AAR: Rail Traffic "mixed" in November
Once again rail traffic was "mixed". Most of the decline in rail carloads was due to fewer coal and grain shipments, and intermodal was up - but the strike at the ports of Los Angeles and Long Beach limited the increase.
From the Association of American Railroads (AAR): AAR Reports Mixed Rail Traffic for November
Intermodal traffic in November saw an increase for the 36th straight month, totaling 934,595 containers and trailers, up 1.2 percent (11,519 units) compared with November of 2011. Carloads originated in November totaled 1,130,770 carloads, down 4 percent (47,512 carloads) compared with the same month last year. Carloads excluding coal and grain were up 5.5 percent for the month, or 30,466 carloads, compared with the same month last year.
...
“Coal and grain together account for almost half of non-intermodal U.S. rail traffic, so they are obviously very important to railroads. But coal and grain carloads often rise or fall for reasons that have little or nothing to do with the economy. Other commodity categories like autos, lumber, and crushed stone, sand and gravel that are more highly correlated with economic growth have been growing, which we hope is a good sign for the economy moving forward,” said AAR Senior Vice President John T. Gray.
 Click on graph for larger image.
This graph shows U.S. average weekly rail carloads (NSA).
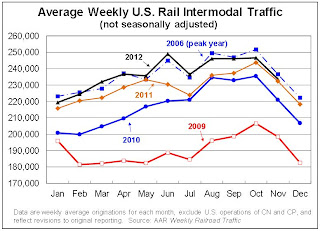
U.S. railroads originated 1,130,770 carloads in November 2012, down 4.0% (47,512 carloads) from November 2011 on a non-seasonally adjusted basis. November marked the 10th straight year-over-year monthly carload decline for U.S. railroads ...The second graph is for intermodal traffic (using intermodal or shipping containers):
Coal and grain were, again in November, the main reasons for the decline in total U.S. carloads. Coal carloads were down 12.8% (68,837 carloads) for the month; grain carloads were down 10.7% (9,141 carloads) for the month.
 Graphs reprinted with permission.
Intermodal traffic is near peak levels.
U.S. rail intermodal traffic totaled 934,595 containers and trailers in November 2012, up 1.2% (11,519 intermodal units) over November 2011 and an average of 233,649 per week ... As of November 2012, year-over-year U.S. rail intermodal traffic had risen for 36 straight months, but the 1.2% gain in November was the smallest such increase since August 2011. Part of the reason for that is a strike by harbor clerks at the Ports of Los Angeles and Long Beach that began on November 26 and was settled on December 5. The two ports are by far the first and second highest-volume container ports in the country and are the source and destination for large amounts of U.S. rail intermodal traffic.This suggests economic growth.
Earlier on employment:
• November Employment Report: 146,000 Jobs, 7.7% Unemployment Rate
• Employment Report: More Positives than Negatives
• All Employment Graphs


