 RSS Feed
 by Calculated Risk on 1/26/2012 10:05:00 PM
Thursday, January 26, 2012
GDP Report expected to show 3% annualized growth
On December New Home Sales:
• New Home Sales decline in December to 307,000 Annual Rate
• 2011: Record Low New Home Sales and 'Distressing Gap'
• New Home Sales graphs
Last week on Existing Home sales:
• Existing Home Sales in December: 4.61 million SAAR, 6.2 months of supply
• Existing Home Sales: Inventory and NSA Sales Graph
• Existing Home Sales graphs
 The BEA will release the Q4 advance GDP report Friday morning. The consensus is that real GDP increased 3.0% annualized in Q4.
This graph shows the quarterly GDP growth (at an annual rate) for the last 30 years. The Red column is the forecast for Q4 GDP.
At 3% this would be the fastest growth rate since Q2 2010, however PCE growth will probably still be weak and will probably be closer to 2% annualized.
Case Shiller House Price Forecasts: New Post-bubble lows Seasonally Adjusted
by Calculated Risk on 1/26/2012 05:07:00 PM
The Case Shiller house price indexes for November will be released next Tuesday. Here are a couple of forecasts:
• Zillow Forecast: November Case-Shiller Composite-20 Expected to Show 3.2% Decline from One Year Ago
Zillow predicts that the 20-City Composite Home Price Index (non-seasonally adjusted, NSA) will decline by 3.2 percent on a year-over-year basis, while the 10-City Composite Home Price Index (NSA) will show a year-over-year decline of 2.7 percent. The seasonally adjusted (SA) month-over-month change from October to November will be -0.2 percent and -0.1 percent for the 20 and 10-City Composite Home Price Index (SA), respectively.• From RadarLogic: Home Prices Declined at an Accelerating Rate in November as Sales Increased
The S&P/Case-Shiller Composite Home Price Indices for November 2011 will decline again on a month-over-month basis.Below is a summary table. Case-Shiller will probably report house prices are at a new post-bubble low seasonally adjusted, but still above the NSA (Not Seasonally Adjusted) levels of March 2011.
...
This month, we expect the November 2011 10-City composite index to be about 152 and the 20-City index to be roughly 138.
| Case Shiller Composite 10 | Case Shiller Composite 20 | ||||
|---|---|---|---|---|---|
| NSA | SA | NSA | SA | ||
| Case Shiller (actual) | Nov-10 | 157.5 | 156.44 | 143.77 | 142.77 |
| Oct-11 | 154.1 | 152.24 | 140.3 | 138.56 | |
| Zillow Forecast | YoY | -2.7% | -2.7% | -3.2% | -3.2% |
| MoM | -0.6% | -0.1% | -0.8% | -0.2% | |
| Zillow Forecasts1 | 153.2 | 152.2 | 139.2 | 138.2 | |
| RadarLogic Forecast | 152 | 138 | |||
| Post Bubble Lows2 | 150.44 | 152.24 | 137.64 | 138.56 | |
| 1Estimate based on Year-over-year and Month-over-month Zillow forecasts2NSA lows were in March 2011, SA lows were last month. | |||||
Misc: Tenth District manufacturing increases, Chicago Fed National Activity Index, State Coincident indexes
by Calculated Risk on 1/26/2012 02:31:00 PM
Catching up ...
• Kansas City Fed: Tenth District Manufacturing Activity Rebounded in January
The month-over-month composite index was 7 in January, up from revised totals of -2 in December and 4 in November. The composite index is an average of the production, new orders, employment, supplier delivery time, and raw materials inventory indexes. ... The production and shipments indexes jumped to their highest levels since June, and the new orders index climbed from -2 to 8.All of the regional manufacturing surveys have indicated stronger expansion in January (Empire state, Philly, Richmond and Kansas City). The Dallas Fed survey is scheduled to be released on Monday.
• The Chicago Fed released the national activity index (a composite index of other indicators): Index shows economic activity improved in December
Led by improvements in production- and employment-related indicators, the Chicago Fed National Activity Index increased to +0.17 in December from –0.46 in November. ...This graph shows the Chicago Fed National Activity Index (three month moving average) since 1967.
The index’s three-month moving average, CFNAI-MA3, increased from –0.19 in November to –0.08 in December—its highest value since March 2011. December’s CFNAI-MA3 suggests that growth in national economic activity was slightly below its historical trend. The economic slack reflected in this level of the CFNAI-MA3 suggests limited inflationary pressure from economic activity over the coming year.
 Click on graph for larger image.
According to the Chicago Fed:
A zero value for the index indicates that the national economy is expanding at its historical trend rate of growth; negative values indicate below-average growth; and positive values indicate above-average growth.• From the Philly Fed:
The Federal Reserve Bank of Philadelphia has released the coincident indexes for the 50 states for December 2011. In the past month, the indexes increased in 39 states, decreased in seven, and remained unchanged in four (Arizona, Nebraska, New York, and Wyoming) for a one-month diffusion index of 64.
 This is a graph is of the number of states with one month increasing activity according to the Philly Fed. This graph includes states with minor increases (the Philly Fed lists as unchanged).
In December, 42 states had increasing activity, down from 44 in November.
Note: These are coincident indexes constructed from state employment data. From the Philly Fed:
The coincident indexes combine four state-level indicators to summarize current economic conditions in a single statistic. The four state-level variables in each coincident index are nonfarm payroll employment, average hours worked in manufacturing, the unemployment rate, and wage and salary disbursements deflated by the consumer price index (U.S. city average). The trend for each state’s index is set to the trend of its gross domestic product (GDP), so long-term growth in the state’s index matches long-term growth in its GDP.
 Here is a map of the three month change in the Philly Fed state coincident indicators. This map was all red during the worst of the recession, and all green in early 2011 - but this is an improvement from last summer.
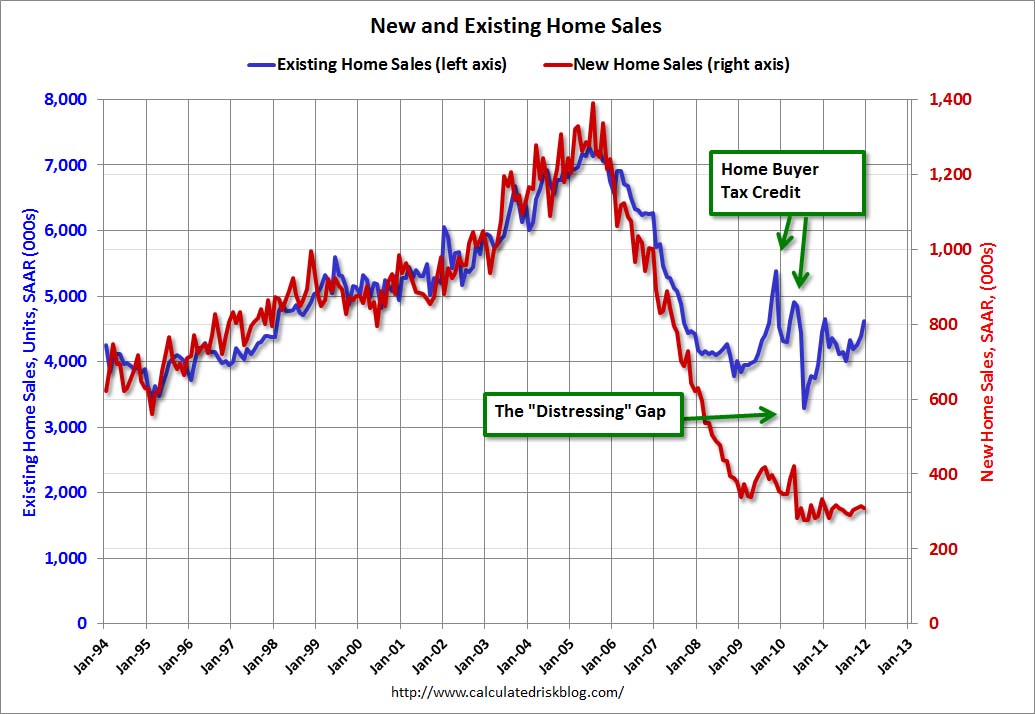
2011: Record Low New Home Sales and 'Distressing Gap'
by Calculated Risk on 1/26/2012 12:04:00 PM
2011 was the worst year for new home sales since the Census Bureau started tracking sales in 1963. The three worst years were 2011, 2010, and 2009 - and 2008 is also on the worst ten list. Although sales will probably increase in 2012, this year will probably be high in the list too.
See list at bottom.
The following graph shows existing home sales (left axis) and new home sales (right axis) through December. This graph starts in 1994, but the relationship has been fairly steady back to the '60s.
Following the housing bubble and bust, the "distressing gap" appeared mostly because of distressed sales. The flood of distressed sales has kept existing home sales elevated, and depressed new home sales since builders can't compete with the low prices of all the foreclosed properties.
 Click on graph for larger image.
I expect this gap to eventually close once the number of distressed sales starts to decline.
Note: Existing home sales are counted when transactions are closed, and new home sales are counted when contracts are signed. So the timing of sales is different.
On December New Home Sales:
• New Home Sales decline in December to 307,000 Annual Rate
• New Home Sales graphs
Last week on Existing Home sales:
• Existing Home Sales in December: 4.61 million SAAR, 6.2 months of supply
• Existing Home Sales: Inventory and NSA Sales Graph
• Existing Home Sales graphs
| Ten Worst Years for New Home Sales since 1963 | |
|---|---|
| Year | Sales (000s) |
| 2011 | 302 |
| 2010 | 323 |
| 2009 | 375 |
| 1982 | 412 |
| 1981 | 436 |
| 1969 | 448 |
| 1966 | 461 |
| 1970 | 485 |
| 2008 | 485 |
| 1967 | 487 |
New Home Sales decline in December to 307,000 Annual Rate
by Calculated Risk on 1/26/2012 10:00:00 AM
The Census Bureau reports New Home Sales in December were at a seasonally adjusted annual rate (SAAR) of 307 thousand. This was down from a revised 314 thousand in November (revised down from 315 thousand).
The first graph shows New Home Sales vs. recessions since 1963. The dashed line is the current sales rate.
Sales of new single-family houses in December 2011 were at a seasonally adjusted annual rate of 307,000 ... This is 2.2 percent (±13.2%) below the revised November rate of 314,000 and is 7.3 percent (±16.6%) below the December 2010 estimate of 331,000.
 Click on graph for larger image in graph gallery.
The second graph shows New Home Months of Supply.
Months of supply increased to 6.1 in December.
The all time record was 12.1 months of supply in January 2009.
 This is now close to normal (less than 6 months supply is normal).
The seasonally adjusted estimate of new houses for sale at the end of December was 157,000. This represents a supply of 6.1 months at the current sales rate.On inventory, according to the Census Bureau:
"A house is considered for sale when a permit to build has been issued in permit-issuing places or work has begun on the footings or foundation in nonpermit areas and a sales contract has not been signed nor a deposit accepted."Starting in 1973 the Census Bureau broke this down into three categories: Not Started, Under Construction, and Completed.
 This graph shows the three categories of inventory starting in 1973.
The inventory of completed homes for sale was at 61,000 units in December. The combined total of completed and under construction is at the lowest level since this series started.
The last graph shows sales NSA (monthly sales, not seasonally adjusted annual rate).
In December 2011 (red column), 21 thousand new homes were sold (NSA). This was the weakest December since this data has been tracked, and was below the previous record low for December of 23 thousand set in 1966 and tied in 2010. The high for December was 87 thousand in 2005.
 This was below the consensus forecast of 320 thousand, and was a new record low for the month of December (NSA).
 New home sales have averaged only 300 thousand SAAR over the 20 months since the expiration of the tax credit ... mostly moving sideways at a very low level.
Weekly Initial Unemployment Claims increase to 377,000
by Calculated Risk on 1/26/2012 08:30:00 AM
The DOL reports:
In the week ending January 21, the advance figure for seasonally adjusted initial claims was 377,000, an increase of 21,000 from the previous week's revised figure of 356,000. The 4-week moving average was 377,500, a decrease of 2,500 from the previous week's revised average of 380,000.The previous week was revised up to 356,000 from 352,000.
The following graph shows the 4-week moving average of weekly claims since January 2000.
 Click on graph for larger image.
The dashed line on the graph is the current 4-week average. The four-week average of weekly unemployment claims decreased this week to 377,500.
The 4-week moving average remains below 400,000.
And here is a long term graph of weekly claims:

Weekly claims have been bouncing around lately - January is a period with large seasonal adjustments and that can lead to some large swings - but the 4-week average of weekly claims have been mostly trending down.
Wednesday, January 25, 2012
California AG: Mortgage settlement 'inadequate'
by Calculated Risk on 1/25/2012 07:19:00 PM
From Alejandro Lazo at the LA Times: California calls $25-billion mortgage settlement 'inadequate'
Calif. Atty. Gen. Kamala D. Harris' office has called a proposed $25-billion settlement with the nation’s mortgage industry “inadequate.”
"We've reviewed the details of the latest settlement proposal from the banks, and we believe it is inadequate for California,” Shum Preston, a spokesman for Harris, said in a statement. “Our state has been clear about what any multistate settlement must contain: transparency, relief going to the most distressed homeowners and meaningful enforcement that ensures accountability. At this point, this deal does not suffice for California."
...
[As part of the settlement] attorneys general would agree to release the banks from further action related to the improper servicing of loans as well as claims against originating mortgages. Several attorneys general, including New York's Eric Schneiderman and California's Harris, have voiced concerns that those releases are overly broad and would preclude them from carrying out ongoing investigations.
Schneiderman was appointed Tuesday by President Obama as co-chairman of a new investigative effort that will try to coordinate existing federal and state probes into mortgage practices before the financial crisis. Schneiderman promised Wednesday to move aggressively.
A spokesman for Schneiderman said in a statement that the New York attorney general would not sign onto a foreclosure settlement that would limit his ability to carry out investigations of the mortgage crisis.
Analysis: Bernanke paves the way for QE3
by Calculated Risk on 1/25/2012 04:30:00 PM
A few quick thoughts ...
• Fed Chairman Ben Bernanke made it clear that no decision on additional asset purchases has been made and that any additional balance sheet expansion would be a "collective" decision, however ...
• Bernanke made it clear that maximum sustainable employment and stable prices (defined as 2% inflation of personal consumption expenditures) are on "equal footing".
• The current projections are for unemployment to be significantly too high for years and inflation to be at or below the Fed's target. That is a strong argument for additional monetary accommodation.
• In the Q&A, Bernanke made it clear that even if inflation moved above the target - and unemployment was still very high - the Fed would only slowly pursue policies to reduce the inflation rate.
• The minutes for the FOMC meeting will probably contain discussion of the outlook for the balance sheet and possible further asset purchases. Those minutes will be released in 3 weeks.
Although the FOMC might still wait until one of the two day meetings in April or June, the likelihood of QE3 being announced at the March 13th meeting has increased significantly.
FOMC: Sets 2% Inflation Target, January Summary of Economic Projections (SEP) and Press Briefing
by Calculated Risk on 1/25/2012 02:00:00 PM
Earlier the FOMC released a statement for the January meeting.
Here are the longer run projections
The Committee judges that inflation at the rate of 2 percent, as measured by the annual change in the price index for personal consumption expenditures, is most consistent over the longer run with the Federal Reserve's statutory mandate. ... FOMC participants' estimates of the longer-run normal rate of unemployment had a central tendency of 5.2 percent to 6.0 percent.Here are the updated forecasts from the January meeting. The key details are below the video.
Fed Chairman Ben Bernanke will hold a press briefing at 2:15 PM.
 Click on graph for larger image.
"The shaded bars represent the number of FOMC participants who project that the initial increase in the target federal funds rate (from its current range of 0 to ¼ percent) would appropriately occur in the specified calendar year."
Most participants project the first rate hike will appropriately occur in 2014 or later.
 "The dots represent individual policymakers’ projections of the appropriate federal funds rate target at the end of each of the next several years and in the longer run. Each dot in that chart represents one policymaker’s projection."
Most participants think the Fed Funds rate will be in the current range into 2014. Then there is some disagreement.
GDP projections were revised down.
| GDP projections of Federal Reserve Governors and Reserve Bank presidents | |||
|---|---|---|---|
| Change in Real GDP1 | 2012 | 2013 | 2014 |
| January 2012 Projections | 2.2 to 2.7 | 2.8 to 3.2 | 3.3 to 4.0 |
| November 2011 Projections | 2.5 to 2.9 | 3.0 to 3.5 | 3.0 to 3.9 |
Unemployment rate projections were also revised down.
| Unemployment projections of Federal Reserve Governors and Reserve Bank presidents | |||
|---|---|---|---|
| Unemployment Rate2 | 2012 | 2013 | 2014 |
| January 2012 Projections | 8.2 to 8.5 | 7.4 to 8.1 | 6.7 to 7.6 |
| November 2011 Projections | 8.5 to 8.7 | 7.8 to 8.2 | 6.8 to 7.7 |
And inflation projections were revised down.
| Inflation projections of Federal Reserve Governors and Reserve Bank presidents | |||
|---|---|---|---|
| PCE Inflation1 | 2012 | 2013 | 2014 |
| January 2012 Projections | 1.4 to 1.8 | 1.4 to 2.0 | 1.6 to 2.0 |
| November 2011 Projections | 1.4 to 2.0 | 1.5 to 2.0 | 1.5 to 2.0 |
Here is core inflation:
| Core Inflation projections of Federal Reserve Governors and Reserve Bank presidents | |||
|---|---|---|---|
| Core Inflation1 | 2012 | 2013 | 2014 |
| January 2012 Projections | 1.5 to 1.8 | 1.5 to 2.0 | 1.6 to 2.0 |
| November 2011 Projections | 1.5 to 2.0 | 1.4 to 1.9 | 1.5 to 2.0 |
If the economy under performs or even tracks the November projections, QE3 would seem likely at either of the two day meetings in April or June. Some have argued that QE3 could happen sooner, perhaps at the March meeting. Based on these projections, QE3 is very likely.
FOMC Statement: Rates likely exceptionally low through late 2014
by Calculated Risk on 1/25/2012 12:30:00 PM
Note: The Summary of Economic Projections (SEP) will be released around 2 PM ET (including the new FOMC forecasts for the federal funds rate), and Ben Bernanke will hold a press briefing starting at 2:15 PM.
FOMC Statement:
Information received since the Federal Open Market Committee met in December suggests that the economy has been expanding moderately, notwithstanding some slowing in global growth. While indicators point to some further improvement in overall labor market conditions, the unemployment rate remains elevated. Household spending has continued to advance, but growth in business fixed investment has slowed, and the housing sector remains depressed. Inflation has been subdued in recent months, and longer-term inflation expectations have remained stable.
Consistent with its statutory mandate, the Committee seeks to foster maximum employment and price stability. The Committee expects economic growth over coming quarters to be modest and consequently anticipates that the unemployment rate will decline only gradually toward levels that the Committee judges to be consistent with its dual mandate. Strains in global financial markets continue to pose significant downside risks to the economic outlook. The Committee also anticipates that over coming quarters, inflation will run at levels at or below those consistent with the Committee's dual mandate.
To support a stronger economic recovery and to help ensure that inflation, over time, is at levels consistent with the dual mandate, the Committee expects to maintain a highly accommodative stance for monetary policy. In particular, the Committee decided today to keep the target range for the federal funds rate at 0 to 1/4 percent and currently anticipates that economic conditions--including low rates of resource utilization and a subdued outlook for inflation over the medium run--are likely to warrant exceptionally low levels for the federal funds rate at least through late 2014.
The Committee also decided to continue its program to extend the average maturity of its holdings of securities as announced in September. The Committee is maintaining its existing policies of reinvesting principal payments from its holdings of agency debt and agency mortgage-backed securities in agency mortgage-backed securities and of rolling over maturing Treasury securities at auction. The Committee will regularly review the size and composition of its securities holdings and is prepared to adjust those holdings as appropriate to promote a stronger economic recovery in a context of price stability.
Voting for the FOMC monetary policy action were: Ben S. Bernanke, Chairman; William C. Dudley, Vice Chairman; Elizabeth A. Duke; Dennis P. Lockhart; Sandra Pianalto; Sarah Bloom Raskin; Daniel K. Tarullo; John C. Williams; and Janet L. Yellen. Voting against the action was Jeffrey M. Lacker, who preferred to omit the description of the time period over which economic conditions are likely to warrant exceptionally low levels of the federal funds rate.


