 RSS Feed
 by Calculated Risk on 8/16/2010 06:44:00 PM
Monday, August 16, 2010
One Year Supply of Houses? and other stuff
First on housing ...
"The Composite, which was reasonably flat in June, showed a marked decrease in July, falling more than half a percentage point (0.63%)."
Moody’s housing economist Celia Chen has released a forecast of housing that is pretty dire. If the U.S. enters a doubledip recession, writes Chen, home prices could fall another 20% before stabilizing in early 2012. That compares to a baseline forecast that calls for another 5% decline in home prices and a bottom early next year. Chen puts the odds of a near‐term double‐dip at one in four. As observers of the actual housing market, while we cannot say these numbers are right, we certainly support Chen’s concern. However, we think the order of events will be reversed: it is our belief that housing prices will decrease in the autumn, perhaps precipitously, and that may cause a second dip in the U.S. economy.
Other reports of interest ...
Sovereign Debt Part 5D: European Banks, What if Things Go Really Badly?
by Calculated Risk on 8/16/2010 03:28:00 PM
CR Note: This series is from reader "some investor guy".
Part 5D. What if Things Go Really Badly? More Than Half of Europe’s Banks Would Need Capital. A quarter would be insolvent. This part was moved a bit later to allow a more thorough analysis of the European Bank Stress Tests.
There are two questions I’ve been asked repeatedly since the European stress tests were announced.
Q1. Was there much sovereign stress in the European bank stress tests?
NO. The most glaring oversight, in the opinion of the author and many other analysts, is assuming there would be no sovereign defaults, and thus not showing any losses on the bank’s long term holdings (in the banking category vs the “trading book”). According to the Committee of European Banking Supervisors, the sovereign stress scenario results in “39 billion euro associated with valuation losses of sovereign exposures in the trading book “.
“The haircuts are applied to the trading book portfolios only, as no default assumption was considered, which would be required to apply haircuts to the held to maturity sovereign debt in the banking book.”
Yes, as you may have seen in other reports, the “sovereign stress scenario” contained no sovereign defaults. Why on earth would this be the stress case? “The setting up of the European Financial Stability Facility (EFSF) and the related commitment of all participating member States provides reassurance that the default of a member State will not occur, which implies that impairment losses on sovereign exposures in the available for sale and held-to-maturity in the banking book cannot be factored into the exercise.” (source).
For there to be no sovereign defaults: the EFSF and IMF plans would have to be big enough to subsidize a lot of sovereign problems, they would have to stay in place for a long time, member countries would have to continue to subsidize them for a long time, and (the worst vulnerability) countries like Hungary and Greece have to accept the conditions which come with the offers of support.
Plenty of countries have turned down potential IMF support over the years. Hungary turned down additional support from the IMF and the EU, the week before the stress test results were released, (source). Hungary continues to say “no”, and “Hungary's defiance could conceivably spread to other governments currently being squeezed by the IMF and European authorities.” (source).
At least four forms of defiance might lead to default. First, a country might say that they can’t or won’t do the requested steps like austerity. They would rather just default. Second, a country might claim or actually believe they don’t need help. Then if markets freeze up due to problems elsewhere, they might not be able to roll over their debt, and they could default. Third, a country with a lot over the counter derivatives might come up with a reason not to pay them (see Part 5C for some examples of how sovereigns might try to get out of commitments). That’s a big potential problem for some European banks that don’t have collateral from sovereigns on their interest rate and currency swaps. Fourth, someone already receiving considerable help from the EU or IMF might not repay it. For example, a new government might be elected (as happened in Hungary).
Here is a list of the 30 countries whose sovereign debt was included in the stress tests. Six of them already are receiving help from the IMF. Note that most of the IMF support agreements end before the end of the Stress Test period, 12/31/2011. Most of the amounts outstanding are due to be repaid to the IMF quarterly installments 3-5 years later.
| European Stress Test Participants and Existing IMF Support Agreements | ||||||
|---|---|---|---|---|---|---|
| As of August 5 2010, In Millions, source | ||||||
| Amount | Undrawn | |||||
| Type | Effective | Expires | Agreed | Balance | Outstanding | |
| Austria | ||||||
| Belgium | ||||||
| Bulgaria | ||||||
| Cyprus | ||||||
| Czech Republic | ||||||
| Denmark | ||||||
| Estonia | ||||||
| Finland | ||||||
| France | ||||||
| Germany | ||||||
| Greece | Standby | 5/9/2010 | 5/8/2013 | 26,433 | 21,627 | 4,806 |
| Hungary | Standby | 11/6/2008 | 10/5/2010 | 10,538 | 2,901 | 7,637 |
| Iceland | Standby | 11/19/2008 | 8/31/2011 | 1,400 | 630 | 770 |
| Ireland | ||||||
| Italy | ||||||
| Latvia | Standby | 12/23/2008 | 12/22/2011 | 1,522 | 629 | 892 |
| Liechtenstein | ||||||
| Lithuania | ||||||
| Luxembourg | ||||||
| Malta | ||||||
| Netherlands | ||||||
| Norway | ||||||
| Poland | Credit Line | 7/2/2010 | 7/1/2011 | 13,690 | 13,690 | 0 |
| Portugal | ||||||
| Romania | Standby | 5/4/2009 | 5/3/2011 | 11,443 | 2,412 | 9,031 |
| Slovakia | ||||||
| Slovenia | ||||||
| Spain | ||||||
| Sweden | ||||||
| United Kingdom | ||||||
| Count | 6 | Totals | 65,026 | 41,889 | 23,136 | |
Official Opinion. Jean-Claude Trichet, President of the European Central Bank, claims that the stress tests were “an important step forward in restoring market confidence.” (August 5, NY Times: Trichet Sees Reasons for Optimism in Europe). OK. Let’s see what the bond and CDS markets have done since July 23rd when the results were released.
What the market thinks. The CDS market believes that stress test member governments have about half a trillion dollars of expected default losses, about one third of the worldwide total. Big difference. And the CDS and bond markets didn’t move much since the announcement of the stress test results. Greece’s CDS prices for Greece show a 50% chance of default within 5 years. Before the stress test, it was 53%. In other words, the people with real money riding on these outcomes were not impressed. If everyone in the CDS market believed the assumptions used in the stress tests, that pricing should be near zero.
 Click on graph for larger image in new window.
CR Note: This graph of European bond spreads is from the Atlanta Fed weekly Financial Highlights (line added for stress tests).
Bond spreads would also have gotten much smaller, with debt from Greece, Spain, Portugal, and Italy having yields much closer to German debt. As can be seen from this CR chart from August 12, that isn’t occurring.
However, there some useful results of the stress tests. There is plenty of published data which is reasonably comparable from one bank to another. The regulators also put in general economic stresses like unemployment and slow growth, which caused a lot of losses to banks: 473 billion euros of impairment losses (source). That’s where the great majority of the losses in the stress tests arose.
Q2. How many European banks would fail a real sovereign stress test, or would fail in the Really Bad Scenario?
There are four sets of tests I would like to discuss:
1. The official European bank stress tests, from the Committee of European Banking Supervisors, where only 7 of 91 banks “failed” the tests, and would need more capital. Much of that data is here. As mentioned above, the official test doesn’t even match the expected level of sovereign losses, much less a real stress test.
2. Citi did a reanalysis if all of the banks’ sovereign bonds were marked to market and concluded that 24 of 91 banks would fail the Tier 1 capital test from the European regulators, on exactly the same economic assumptions as the regulators. In other words, about a quarter of the banks would need more capital to be considered solvent, according to Citi’s analysis.
3. Using a rather different method, and current credit default swap pricing, Some Investor Guy came to an almost identical conclusion as Citi, with an almost identical list of banks needing capital. Citi’s test can be regarded as a reasonable baseline.
Why is Citi’s scenario using the regulators’ haircuts and interest rate assumptions so close to Some Investor Guy’s scenario based on credit default swap data? Part of the reason is that both sets of losses were calculated from the same sovereign bond holdings for each bank.
I speculate that something else might also be occurring. Faced with political and public relations difficulties of having sovereign defaults of European countries despite a one trillion euro commitment that is supposed to prevent them, analysts at the central banks may have calibrated their sovereign stress assumptions to provide similar overall market value losses to what the CDS market currently expects. If so, the exact details are obscured by the stress tests using changes in ratings and yields (and multiple languages and currencies). If this is really what happened, I’m proud of the analyst(s) at CEBS who figured out how to set the sovereign assumptions and data collection so that someone like Citi or Some Investor Guy could easily do a real, expected value stress test. They keep their jobs, other people willing to wade through thousands of numbers get to do their own scenarios. Everybody’s happy.
4. In the Really Bad Scenario, the results are much worse for banks. 57 of 91 major European banks would need capital, and 23 of them would have their Tier 1 capital go below zero. In other words, they would be technically insolvent.
 In the Really Bad scenario, defaulted sovereigns include Belgium, Bulgaria, Cypress, Estonia, Greece, Hungary, Iceland, Ireland, Italy, Latvia, Lithuania, Malta, Poland, Portugal, Romania, and Spain. About $4 trillion of European sovereign debt would be in default, and losses to the European banking system would be about $568 billion, doubling the losses in the official stress tests. When added to the rest of the losses in the stress tests, losses to banks go to 1.041 trillion euros.
 In this scenario, there is a strong correlation between where a bank is based, and whether it needs capital. Banks tend to hold a very disproportionate amount of their sovereign bonds from their home country. Thus, banks from Greece, Hungary, Ireland, Italy, Poland, Portugal, Romania, and Spain encounter a disproportionate amount of the damage in this scenario. The portion of outstanding bonds held by banks varies a lot. More than half of Greek debt is held by banks, but only about 15% of Belgian and Italian debt is at banks.
Please note that for the Really Bad scenario, the exact same baseline numbers were used for everything except sovereign losses. Same unemployment, GDP growth, private sector losses, etc. With widespread sovereign default, in the short run there would probably be more unemployment and lower GDP growth.
In Banking Crises, an Equal Opportunity Menace, Reinhart and Rogoff show that the cost of banking crises are greater than has been commonly assumed. “Banking crises dramatically weaken fiscal positions…with government revenues invariably contracting, and fiscal expenditures often expanding sharply. Three years after a financial crisis central government debt increases, on average, by about 86 percent. Thus the fiscal burden of banking crisis extends far beyond the commonly cited cost of the bailouts.”
 Given the typical timing of banking and sovereign crises, it would take about 1-2 years for the crisis to reach its peak, and about 3 more years for recovery.
Chart source: page 40.
Full Disclosure: Some Investor Guy lives in the US and owns no sovereign debt from outside the US. He owns bonds from one of the banks involved in the stress tests. To his relief, that bank is solvent even in the Really Bad scenario. Since he didn’t name specific banks, it would be pointless to have modified the Really Bad scenario in any way to help that bank or the value of its bonds. This article is not an offer to buy or sell anything, but after all of the work assembling the data and doing calculations, Some Investor Guy might be persuaded to share the underlying analysis.
CR Note: This series is from "Some investor guy"
Series:
• Part 1: How Large is the Outstanding Value of Sovereign Bonds?
• Part 2. How Often Have Sovereign Countries Defaulted in the Past?
• Part 2B: More on Historic Sovereign Default Research
• Part 3. What are the Market Estimates of the Probabilities of Default?
• Part 4. What are Total Estimated Losses on Sovereign Bonds Due to Default?
• Part 5A. What Happens If Things Go Really Badly? $15 Trillion of Sovereign Debt in Default
• Part 5B. Part 5B. What Happens If Things Go Really Badly? More Things Can Go Badly: Credit Default Swaps, Interest Swaps and Options, Foreign Exchange
• Part 5C. Some Policy Options, Good and Bad
• Part 5D. European Banks, What if Things Go Really Badly?
Fed: Large banks ease lending standards slightly, demand still weak
by Calculated Risk on 8/16/2010 02:18:00 PM
From the Fed: July 2010 Senior Loan Officer Opinion Survey on Bank Lending Practices
The July survey indicated that, on net, banks had eased standards and terms over the previous three months on loans in some categories, particularly those categories affected by competitive pressures from other banks or from nonbank lenders. While the survey results suggest that lending conditions are beginning to ease, the improvement to date has been concentrated at large domestic banks. Most banks reported that demand for business and consumer loans was about unchanged.On residential real estate the pickup in demand was over the last three months (tax credit related) - just wait until Q3.
...
[commercial real estate] In the July survey, most respondents reported no change in their bank's standards for approving commercial real estate loans.
...
[residential real estate] On net, a small fraction of domestic banks reported having eased standards on prime residential mortgage loans; the few respondents that had eased standards were all large banks. The increase in demand over the past few months for prime residential mortgage loans reported by several respondents to the current survey marked a reversal of the net weakening of demand for such loans reported in the April survey.
CoreLogic: House Prices flat in June
by Calculated Risk on 8/16/2010 12:13:00 PM
Note: CoreLogic reports the year-over-year change. The headline for this post is for the change from May 2010 to June 2010.
From CoreLogic (formerly First American LoanPerformance): CoreLogic® Home Price Index Increases Decelerate in June
According to the CoreLogic HPI, national home prices, including distressed sales, increased by 1.4 percent in June 2010 compared to June 2009 and increased by 3.7 percent [revised] in May 2010 compared to May 2009. The June 2.3 percentage point deceleration from May is very large by historical standards. The deceleration was most pronounced in more expensive and distressed segments of the market. Excluding distressed sales, year-over-year prices only increased by 0.2 percent in June and May’s non-distressed HPI increased by 0.5 percent.”
...
“Home price volatility and collateral risk remain very high. The stabilization phase and policy intervention since the spring of 2009 has run its course. Prices are expected to further moderately decline as the economy remains weak through the fall” said Mark Fleming, chief economist for CoreLogic.
 Click on graph for larger image in new window.
 This graph shows the national LoanPerformance data since 1976. January 2000 = 100.
The index is up 1.4% over the last year, and off 28% from the peak.
CoreLogic expects prices to "moderately decline" (more negative view than last month). I expect that we will see lower prices on this index later this year and into 2011.
 The second graph is an update on the price-to-rent ratio similar to the approach used by Fed economist John Krainer and researcher Chishen Wei in 2004: House Prices and Fundamental Value. Kainer and Wei presented a price-to-rent ratio using the OFHEO house price index and the Owners' Equivalent Rent (OER) from the BLS.
This graph shows the price to rent ratio using the CoreLogic data (January 2000 = 1.0).
This suggests that house prices are much closer to the bottom than the top, but that prices still have a ways to fall on a national basis.
This data is for June and was still impacted by the tax credit. I've been expecting this index to start showing price declines in July as sales collapsed.
NAHB Builder Confidence falls in August to lowest since March 2009
by Calculated Risk on 8/16/2010 10:00:00 AM
The National Association of Home Builders (NAHB) reports the housing market index (HMI) was at 13 in August. This is down slightly from 14 in July and below expectations. The record low was 8 set in January 2009, and 13 is very low ...
Note: any number under 50 indicates that more builders view sales conditions as poor than good. Click on graph for larger image in new window.
This graph compares the NAHB HMI (left scale) with single family housing starts (right scale). This includes the August release for the HMI and the June data for starts (July starts will be released tomorrow).
This shows that the HMI and single family starts mostly move generally in the same direction - although there is plenty of noise month-to-month.
Press release from the NAHB: Builder Confidence Declines In August
Builder confidence in the market for newly built, single-family homes edged down for a third consecutive month in August, according to the latest National Association of Home Builders/Wells Fargo Housing Market Index (HMI), released today. The HMI declined one point to 13, its lowest level since March of 2009.
...
“Today’s report reflects single-family home builders’ concerns about current and future economic conditions and about the increasing hesitancy they are seeing among potential home buyers,” added NAHB Chief Economist David Crowe. “It also reflects the frustration that builders are feeling regarding the effects that foreclosed property sales are having on the new-homes market, with 87 percent of respondents reporting that their market has been negatively impacted by foreclosures.”
...
Two out of three of the HMI’s component indexes fell in August. The component gauging current sales conditions declined one point to 14, while the component gauging sales expectations for the next six months declined three points to 18. The component gauging traffic of prospective buyers held unchanged at 10.
NY Fed: Manufacturing Conditions improve "modestly" in August
by Calculated Risk on 8/16/2010 08:31:00 AM
From the NY Fed: Empire State Manufacturing Survey
The Empire State Manufacturing Survey indicates that conditions improved modestly in August for New York manufacturers. The general business conditions index rose 2 points from its July level, to 7.1.This was slightly below expectations. The decline in new orders is especially concerning.
...
The new orders index fell below zero for the first time in over a year, dropping 13 points to -2.7—an indication that, on balance, manufacturers saw orders decline slightly.
...
Employment indexes were positive and higher than in July, indicating that employment levels and the average workweek expanded in August. The index for number of employees had fallen in June and July, but climbed 6 points, to 14.3, this month.
Sunday, August 15, 2010
Weak economy and low yields are threat to retirement
by Calculated Risk on 8/15/2010 10:43:00 PM
Here is the summary of last week.
Here is the schedule for this week.
Is the economy threatening retirement plans, or is less spending from those saving for retirement threatening the economy? Probably both ...
This article from the WSJ takes the 2nd view: Another Threat to Economy: Boomers Cutting Back
Low yields present retirees with a difficult choice: Accept the lower income offered by safer bonds, or take the risk of staying in the stock market. Either way, their predicament could put a long-term damper on the consumer spending that typically drives U.S. growth.And the job market is tough for older workers too ...
...
As of 2008, the latest data available, people aged 65 to 74 were spending 12.3% less than they did ten years earlier, in inflation-adjusted terms.
Merle Hazard: Double Dippin'
by Calculated Risk on 8/15/2010 06:41:00 PM
Here is the summary of last week.
Here is the schedule for this week.
And some timely thread music ... a new song from Merle Hazard:
Weekly Schedule for August 15th
by Calculated Risk on 8/15/2010 03:20:00 PM
Note: Earlier I posted the summary of last week. I'm going to split the summary and schedule into two posts because it was getting too long!
Two key housing reports will be released this week: July housing starts (Tuesday) and August homebuilder confidence (Monday). Also the Fed will release July industrial production and capacity utilization (Tuesday).
8:30 AM ET: Empire State Manufacturing Survey (August). This index fell sharply over the last few months, although it still showed expansion. The consensus is for a slight increase in August to 8.0 from 5.1 in July.
10 AM: The August NAHB homebuilder survey. This index has collapsed since the expiration of the home buyer tax credit. The consensus is for a slight increase to 15 from 14 in July (still very depressed).
8:30 AM: Housing Starts for July. Housing starts collapsed in June following the expiration of the tax credit. The consensus is for a slight increase to 565K (SAAR) in July from 549K in June.
8:30 AM: Producer Price Index for July. The consensus is for a 0.2% increase, and +0.1% for core PPI.
9:15 AM: The Fed will release Industrial Production and Capacity Utilization for July. The consensus is for a 0.5% increase in Industrial Production, and an increase to 74.5% (from 74.1%) for Capacity Utilization.
9:00 AM to 1:30 PM: Conference on the Future of Housing Finance. According to the agenda: "This event will provide a forum for public input as the Administration continues its work developing a comprehensive housing finance reform proposal for delivery to Congress by January 2011."
12:30 PM: Minneapolis Fed President Narayana Kocherlakota speaks about the FOMC at Northern University of Michigan.
Note: The Q2 Quarterly Starts and Completions by Purpose and Design will also be released
Early: The AIA's Architecture Billings Index for July will be released (a leading indicator for commercial real estate). This has been showing ongoing contraction, and usually this leads investment in non-residential structures (hotels, malls, office) by 9 to 12 months.
7:00 AM: The Mortgage Bankers Association (MBA) will release the mortgage purchase applications index. This index declined sharply following the expiration of the tax credit, and the index has only recovered slightly over the last few weeks - suggesting reported home sales in July and August will be very weak.
8:30 AM: The initial weekly unemployment claims report will be released. Consensus is for a slight decrease to 480K from 484K last week. If so, this will push the 4-week average to the highest level this year.
10:00 AM: Conference Board's index of leading indicators for July. The consensus is for a 0.1% increase in this index.
10:00 AM: Philly Fed Survey for August. This survey declined sharply over the last two months, although was still showing expansion (at a slower pace). The consensus is for a slight increase to 7.0 from 5.1 in July (still expanding, but slowly).
Lunch: St Louis Federal President James Bullard speaks on the economic outlook, and Chicago Fed President Charles Evans speaks to reporters.
10:00 AM: the BLS will release the Regional and State Employment and Unemployment report for June.
After 4:00 PM: The FDIC will probably have another busy Friday afternoon ...
Making Home Affordable Program (HAMP) for July and the “Housing Scorecard”
CoreLogic House Price Index for June.
Moodys/REAL Commercial Property Price Index (CPPI) for June.
Weekly Summary August 15th
by Calculated Risk on 8/15/2010 11:45:00 AM
Note: I'm going to split the weekly summary and the schedule for the coming week into two posts - sometimes one post was too long!
The big story of last week was that the Fed acknowledged the weaker U.S. economy and announced that they will reinvest maturing MBS into Treasury securities.
From the FOMC statement:
[T]he pace of recovery in output and employment has slowed in recent months [and] the pace of economic recovery is likely to be more modest in the near term than had been anticipated.The Fed's goal (according to the technical note from the NY Fed) is to "maintain the face value of outright holdings of domestic securities" at approximately $2.054 trillion.
...
[T]he Committee will keep constant the Federal Reserve's holdings of securities at their current level by reinvesting principal payments from agency debt and agency mortgage-backed securities in longer-term Treasury securities.
 Click on graph for larger image in new window.
The red line on this graph is the amount of outright holdings on the Fed's balance sheet. The dashed line is the new target level for quantitative neutrality.
The outright holdings were expected to fall by about $200 billion by the end of 2011 (some have estimated as high as $400 billion), and that would represent tightening in the face of high unemployment and below target inflation.
NY Fed FAQs: Reinvestment of Principal Payments on Agency Debt and Agency Mortgage-Backed Securities in Treasuries
And from the NY Fed: New York Fed Plans to Buy $18 billion in Treasuries over the next month
On a monthly basis, retail sales increased 0.4% from June to July (seasonally adjusted, after revisions), and sales were up 5.5% from July 2009. Retail sales increased 0.2% ex-autos.
 This graph shows retail sales since 1992.
 This is monthly retail sales, seasonally adjusted (total and ex-gasoline).
Retail sales are up 8.1% from the bottom, but still off 4.5% from the pre-recession peak.
This was close to expectations, but retail sales are still below the March 2010 level (moving sideways for four months).
The combined REO (Real Estate Owned) inventory for Fannie, Freddie and the FHA increased by 13% in Q2 2010 from Q1 2010. The REO inventory (lender Real Estate Owned) increased 74% compared to Q2 2009 (year-over-year comparison).
 This graph shows the REO inventory for Fannie, Freddie and FHA through Q2 2010.
The REO inventory for the "Fs" has increased sharply over the last year, from 135,868 at the end of Q2 2009 to 236,338 at the end of Q2 2010.
This is a new record for Fannie and Freddie; the FHA's REO inventory decreased slightly in Q2 2010.
Remember this is just a portion of the total REO inventory. Private label securities (PLS) and banks and thrifts also hold a substantial number of REOs.
From Diana Olick at CNBC: Foreclosure Math: Shadow Inventory Adds Up
Moody's estimates that private label repossessions stand at 203,665. ... "My best guess right now is that REO held by Fannie, Freddie, and FHA, and other government entities, and banks and thrifts is just under 600-thousand, but unfortunately it is on the rise," says [Thomas] Lawler.
The Census Bureau reports:
[T]otal June exports of $150.5 billion and imports of $200.3 billion resulted in a goods and services deficit of $49.9 billion, up from $42.0 billion in May, revised.This graph shows the U.S. trade deficit, with and without petroleum, through June.
 The blue line is the total deficit, and the black line is the petroleum deficit, and the red line is the trade deficit ex-petroleum products.
The increase in the deficit in June was unrelated to oil as the trade gap with China increased to $26.15 billion in June - the highest level since October 2008 and up sharply from last year.
Once again the imbalances have returned ... and July will probably be worse (see LA Port Traffic: Imports increase, Exports Flat)
From the Association of American Railroads: Rail Time Indicators. The AAR reports traffic in July 2010 was up 4.1% compared to July 2009 - and traffic was 14.6% lower than in July 2008.
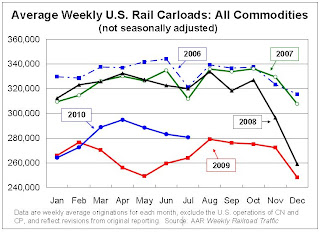 This graph shows U.S. average weekly rail carloads (NSA). Traffic increased in 14 of 19 major commodity categories year-over-year.
As the graph above shows, rail traffic collapsed in November 2008, and now, a year into the recovery, traffic has only recovered part way.
Seasonally there is usually a decline in traffic in July, so seasonally adjusted traffic increased last month. However traffic is only up 4.1% compared to July 2009.
From the National Federation of Independent Business (NFIB): Small Business Economic Trends
 NFIB reported its optimism index fell 0.9 point to 88.1 in July. (Graph from NFIB)
Note: A large percentage of small businesses are in real estate related fields and that will keep optimism down.
And once again the key problem is lack of demand.
Best wishes to all.


