 RSS Feed
 by Calculated Risk on 6/28/2010 12:48:00 PM
Monday, June 28, 2010
Fed's Warsh: Reluctant to do more
From Fed Governor Kevin Warsh: It's Greek to Me
In my view, any judgment to expand the balance sheet further should be subject to strict scrutiny. I would want to be convinced that the incremental macroeconomic benefits outweighed any costs owing to erosion of market functioning, perceptions of monetizing indebtedness, crowding-out of private buyers, or loss of central bank credibility. The Fed's institutional credibility is its most valuable asset, far more consequential to macroeconomic performance than its holdings of long-term Treasury securities or agency securities. That credibility could be meaningfully undermined if we were to take actions that were unlikely to yield clear and significant benefits."Perceptions of monetizing indebtedness"? Although this "perception" is widespread on the internet, it isn't showing up in the bond market.
Indeed, the Federal Reserve should continue to give careful consideration to the appropriate size and composition of its existing holdings. Actual sales will not take place in the near term. But, depending on the evolution of the economy and financial markets, we should consider a gradual, prospective exit--communicated well-in-advance--from our portfolio of mortgage-backed securities. In making this judgment, we should continue to assess investor demand for these assets. Ultimately, in my view, gradual, predictable asset sales by the Fed should facilitate improvements in mortgage finance and financial markets.
Any sale of assets need not signal that policy rates are soon moving higher. Our policy tools can indeed be used independently. I would note that the Fed successfully communicated and demonstrated its ability to exit from most of its extraordinary liquidity facilities over late 2009 and early 2010, even as it continued its policy of extraordinary accommodation.
I definitely agree with Warsh on this point:
"Subprime mortgages were not at the core of the global crisis; they were only indicative of the dramatic mispricing of virtually every asset everywhere in the world."Tanta said it better a few years ago: "We're all subprime now!"
Chicago Fed: Economic Activity increased in May
by Calculated Risk on 6/28/2010 10:00:00 AM
Note: This is a composite index based on a number of economic releases.
From the Chicago Fed: Index shows economic activity continued to expand in May
The index’s three-month moving average, CFNAI-MA3, rose to its highest level since March 2006, increasing to +0.28 in May from +0.05 in April. May’s CFNAI-MA3 suggests that growth in national economic activity was above its historical trend. Moving above +0.20, the index’s three-month moving average in May also reached a level historically associated with a mature economic recovery following a recession.
 Click on table for larger image in new window.
This graph shows the Chicago Fed National Activity Index (three month moving average) since 1967. According to the Chicago Fed:
A zero value for the index indicates that the national economy is expanding at its historical trend rate of growth; negative values indicate below-average growth; and positive values indicate above-average growth.This is the highest level in the index since March 2006, and indicates growth slightly above trend.
Personal Income up 0.4%, Spending Increases 0.2% in May
by Calculated Risk on 6/28/2010 08:30:00 AM
From the BEA: Personal Income and Outlays, April 2010
Personal income increased $53.7 billion, or 0.4 percent ... Personal consumption expenditures (PCE) increased $24.4 billion, or 0.2 percent.The following graph shows real Personal Consumption Expenditures (PCE) through May (2005 dollars). Note that the y-axis doesn't start at zero to better show the change.
...
Real PCE -- PCE adjusted to remove price changes -- increased 0.3 percent in May, in contrast to a decrease of less than 0.1 percent in April
...
Personal saving as a percentage of disposable personal income was 4.0 percent in May, compared with 3.8 percent in April.
 Click on graph for large image.
The quarterly change in PCE is based on the change from the average in one quarter, compared to the average of the preceding quarter.
Even with no growth in June, PCE growth in Q2 would be
The National Bureau of Economic Research (NBER) uses several measures to determine if the economy is in recession. One of the measures is real personal income less transfer payments (see NBER memo). This increased in May to $9,113.9 billion (SAAR) and is barely above the low of October 2009 ($8,987 billion).
 This graph shows real personal income less transfer payments since 1969.
This measure of economic activity is moving sideways - similar to what happened following the 2001 recession.
This month income increased faster than spending ... meaning the saving rate increased.
 This graph shows the saving rate starting in 1959 (using a three month trailing average for smoothing) through the May Personal Income report. The saving rate increased to 4.0% in April (increased to 3.7% using a three month average).
 I still expect the saving rate to rise over the next couple of years slowing the growth in PCE.
The increase in income was good news, but personal income less transfer payments are still only 1.4% above the low of last year.
Sunday, June 27, 2010
Krugman: "The Third Depression"
by Calculated Risk on 6/27/2010 11:59:00 PM
From Paul Krugman in the NY Times: The Third Depression
Recessions are common; depressions are rare. As far as I can tell, there were only two eras in economic history that were widely described as “depressions” at the time: the years of deflation and instability that followed the Panic of 1873 and the years of mass unemployment that followed the financial crisis of 1929-31.From CR: I'm not as pessimistic as Professor Krugman, but I do think with almost double digit unemployment, the focus of policymakers should be jobs, jobs, jobs ...
...
We are now, I fear, in the early stages of a third depression. It will probably look more like the Long Depression than the much more severe Great Depression. But the cost — to the world economy and, above all, to the millions of lives blighted by the absence of jobs — will nonetheless be immense.
Housing Supply Metrics
by Calculated Risk on 6/27/2010 08:13:00 PM
Here is a table of various housing supply measures (just putting this in one place with links to the source data).
Note: here is the Weekly Summary and a Look Ahead. It will be a busy week!
| Total delinquent loans1 | 7.3 million |
| Seriously delinquent loans1,2 | 5.0 million |
| Total REO Inventory3 | 0.5 million |
| Fannie, Freddie, FHA REO4 | 210 thousand |
| Homeowners with Negative Equity5 | 11.2 million |
| Homeowner vacancy rate6 | 2.6% |
| Rental vacancy rate6 | 10.6% |
| Excess Vacant Units6,7 | 1.7 million |
| Existing Home Inventory8 | 3.89 million |
| Existing Home Months of Supply8 | 8.3 months |
| New Home Inventory9 | 213 thousand |
| New Home Months of Supply9 | 8.5 months |
1 Source: estimate based on the Mortgage Bankers Association’s (MBA) Q1 2010 National Delinquency Survey. "MBA’s National Delinquency Survey covers about 44.4 million first lien mortgages on one-to four-unit residential properties ... The NDS is estimated to cover around 85 percent of the outstanding first-lien mortgages in the country."
2 This is based on the MBA's estimate of loans 90+ days delinquent or in the foreclosure process.
3 Source: Radarlogic and Barclays as of Feb 2010.
4 Source: Fannie Mae, Freddie Mac and FHA. Fannie, Freddie, FHA REO Inventory Surges 22% in Q1 2010
5 Source: CoreLogic Q1 2010 Negative Equity Report
6 Source: Census Bureau Residential Vacancies and Homeownership in the First Quarter 2010
7 CR calculation.
8 Source: National Association of Realtors
9 Source: Census Bureau New Residential sales
Housing Bust in the Exurbs
by Calculated Risk on 6/27/2010 04:45:00 PM
From Thomas Curwen in the LA Times: Undone by their dreams
In 2005:
Amid the imposing two-story designs, they settled on a modest single-story home — yet with 2,400 square feet, it was large enough for their growing family. The sales representatives told them ... if they put down a $3,000 deposit they could lock in the price at $365,000.And the result in 2009:
They could barely scrape together the deposit, and they didn't have a down payment for the mortgage. The sales representatives didn't seem worried. ... Countrywide Financial Corp. turned them down. [they had filed bankruptcy 4 years earlier] Freedom Plus Mortgage said yes.
...
Every weekday morning at 6:30, the family would get into the minivan and head over the Cajon Pass. The commute was a little more than an hour.
They spoke to the bank but were told that they didn't qualify for a loan modification ... In October, the house was sold for $125,000.The buyers could "barely scrape together" a 1% deposit, they could hardly qualify (even Countrywide turned them down!), their commute to work was more than an hour each way ... the 2,400 sq ft tract house could probably be built for under $150K today on land that is very cheap ...
Update: I've upped the cost estimate. This is very low end construction (the only "upgrade" was a microwave). Perhaps my original estimate was too low (based on info from a builder), but I've heard some very low quotes recently. This could still be low.
This was an interesting story of boom and bust, but the ending was very predictable.
Weekly Summary and a Look Ahead
by Calculated Risk on 6/27/2010 11:40:00 AM
The key economic report this week will be the June Employment Report to be released on Friday. It will be a busy week ...
On Monday, the BEA will release the May Personal Income and Outlays report. The consensus is for a 0.5% increase in income, and a 0.2% increase in spending. Also on Monday, the May Chicago Fed National Activity Index will be released at 8:30 AM. This is a composite index of other data.
On Tuesday, the April Case-Shiller house price index will be released at 9:00 AM. The consensus is for a slight decline in the house price index. At 10:00 AM, the Conference Board will release Consumer Confidence for June (consensus is for about the same as in May or 63.3).
On Wednesday, the ADP employment report will be released (consensus is for an increase of 60K private sector jobs, up from 55K in May). Also on Wednesday, the Chicago Purchasing Managers Index for June will be released. Consensus is for the PMI to be about the same as May, or 59.7.
Also on Wednesday, Altanta Fed President will speak to the Rotary Club of Baton Rouge at 1 PM ET on the economic outlook.
On Thursday, the closely watched initial weekly unemployment claims will be released. Consensus is for a decline to 450K from 457K last week. The automakers will report vehicle sales for June. Expectations are for about a 11.4 million SAAR for light vehicles in June – down slightly from the 11.6 million rate in May. Some forecasts are even lower, from Edmunds:
Edmunds.com forecasts June's Seasonally Adjusted Annualized Rate (SAAR) will be 11.2 million, down from 11.6 million in May, which was a weak month.Also on Thursday, at 10 AM, the ISM Manufacturing index for June will be released (expectations are for a decrease to 59.0 from 59.7 in May) and Construction Spending for April (consensus is for a slight decline in spending).
Also on Thursday, the NAR will release May Pending Home sales at 10 AM. The consensus is for a decline of around 15%. Take the under! Economist Tom Lawler writes:
[M]y “best guess” estimate is that pending sales in May will be down about 35% from April.And on Friday, the BLS will release the June Employment report at 8:30 AM. The consensus is for a loss of 100K payroll jobs in June, and for the unemployment rate to increase slightly to 9.8% (from 9.7%). Of course the minus 100K includes a substantial decline in the number of temporary hires for Census 2010 (May was the peak month). It will be important to remove the Census hiring to try to determine the underlying trend. Consensus is around a gain of 150K payroll jobs ex-Census. (see Employment Report Preview for more).
Also on Friday, the American Bankruptcy Institute will probably report personal bankruptcy filings for June. This will probably show another "surge" in filings.
And Friday afternoon will be another BFF (Bank Failure Friday) ...
And a summary of last week:
The Census Bureau reported that New Home Sales in May were at a seasonally adjusted annual rate (SAAR) of 300 thousand.
 Click on graph for larger image in new window.
This graph shows New Home Sales vs. recessions for the last 45 years.
Sales of new single-family houses in May 2010 were at a seasonally adjusted annual rate of 300,000 ... This is 32.7 percent (±9.9%) below the revised April rate of 446,000 and is 18.3 percent (±13.0%) below the May 2009 estimate of 367,000.The 300 thousand annual sales rate is a new all time record low. The previous record low annual sales rate was 338 thousand in September 1981.
 This graph shows existing home sales, on a Seasonally Adjusted Annual Rate (SAAR) basis since 1993.
 Sales in May 2010 (5.66 million SAAR) were 2.2% lower than last month, and were 19.2% higher than May 2009 (4.75 million SAAR).
The next graph shows the year-over-year (YoY) change in reported existing home inventory and months-of-supply. Inventory is not seasonally adjusted, so it is helpful to look at the YoY change.
 Inventory increased 1.1% YoY in May. This is the second consecutive month of a year-over-year increases in inventory. Although the YoY increase is small, I expect it will be higher later this year.
This increase in inventory is especially concerning because the reported inventory is already historically very high, and the 8.3 months of supply in May is well above normal. The months of supply will probably stay near this level in June, because of more tax credit related sales (reported at closing), but the months-of-supply could be close to double digits later this year.
And a double digit months-of-supply would be a really bad sign for house prices ...
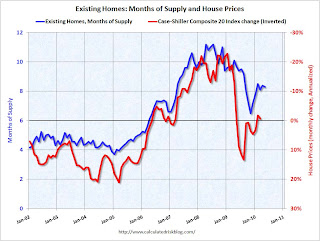 This graph show months of supply and the annualized change in the Case-Shiller Composite 20 house price index (inverted).
Below 6 months of supply (blue line) house prices are typically rising (red line, inverted).
Above 6 months of supply house prices are usually falling (although there were many programs to support house prices over the last year).
Later this year the months of supply will probably increase, and I expect house prices to fall further as measured by the Case-Shiller and CoreLogic repeat sales house price indexes.
 The American Institute of Architects’ Architecture Billings Index declined to 45.8 in May from 48.5 in April. Any reading below 50 indicates contraction.
According to the AIA, there is an "approximate nine to twelve month lag time between architecture billings and construction spending" on non-residential construction. So there will probably be further declines in CRE investment through all of 2010, and probably well into 2011.
Best wishes to all.
G-20 poised to issue Statement
by Calculated Risk on 6/27/2010 09:08:00 AM
From Alan Beattie at the Financial Times in 2008 (via Bruce Bartlett):
An ineffectual international organisation yesterday issued a stark warning about a situation it has absolutely no power to change, the latest in a series of self-serving interventions by toothless intergovernmental bodies.And on a more serious note, from Bloomberg: G-20 May Stress Need to Cut Deficits as Leaders Split on Urgency of Target
“We are seriously concerned about this most serious outbreak of seriousness,” said the head of the institution ...
Group of 20 leaders are poised to endorse targets to tackle deficits while giving nations flexibility on when to start balancing their books, according to officials with knowledge of drafts of the final statement.From the NY Times: Leaders at Summit Talks Turn Attention to Deficit Cuts
...
The draft of the statement includes targets championed by Canadian Prime Minister Stephen Harper for countries to halve deficits by 2013 and start to stabilize their debt-to-output ratios by 2016, the officials said.
Despite President Obama’s pitch at the summit meeting for developed nations here for continued stimulus measures to prevent another global economic downturn, the United States will go along with other leaders who are more concerned about rising debt and join in a commitment to cut their governments’ deficits in half by 2013, administration officials said on Saturday.
Saturday, June 26, 2010
Freddie Mac: 90+ Day Delinquency Rate steady in May
by Calculated Risk on 6/26/2010 09:51:00 PM
 Click on graph for larger image in new window.
Freddie Mac reported yesterday that the rate of serious delinquencies - at least 90 days behind - for conventional loans in its single-family guarantee business was steady at 4.06% in May, the same rate as April, and up sharply from 2.73% in May 2009.
"Single-family delinquencies are based on the number of mortgages 90 days or more delinquent or in foreclosure as of period end ..."
The "good" news is the delinquency rate has stopped rising rapidly. However some of the earlier increase was because of foreclosure mortatoriums, and distortions from modification programs - loans in trial mods were considered delinquent until the modifications were made permanent.
Even though Freddie Mac has started foreclosing, modifying loans, and accepting short sales, the number of new 90+ day delinquencies has kept pace.
The data from Fannie Mae will be released next week ...
Employment Report Preview
by Calculated Risk on 6/26/2010 06:26:00 PM
Just a few notes on the June employment report to be released on Friday, July 2nd:
Andrew Tilton of Goldman Sachs noted this in a research note yesterday:
"We are cautiously optimistic that June’s payroll report will show a pickup in private-sector payroll growth to around 150,000. In part, this is because there seems to be some “crowding out” of private sector payroll growth by short-term Census hiring—indeed, this may explain a good part of the payroll disappointment last month. Total payrolls should be down about 100,000 in June as a large portion of Census employment rolls off."There will be some preliminary reports on employment released during the coming week: the ADP employment report, the Chicago PMI, and the ISM surveys.
However it is concerning that the regional Fed manufacturing surveys were mixed on employment (manufacturing has been one of the stronger sectors):
In addition weekly initial unemployment claims have remained elevated. Initial weekly claims have averaged 464,000 thousand in June, almost the same level as each of the previous 5 months.
Here is a repeat of the graph showing percent job losses during recessions, aligned at the bottom:
 Click on graph for larger image.
This graph shows the job losses from the start of the employment recession, in percentage terms.
The dotted line shows the impact of Census hiring. In May, there were 564,000 temporary 2010 Census workers on the payroll. Just under half of those Census jobs will go away in June, and the two red lines will meet sometime later this year.


