 RSS Feed
 by Calculated Risk on 6/27/2010 11:40:00 AM
Sunday, June 27, 2010
Weekly Summary and a Look Ahead
The key economic report this week will be the June Employment Report to be released on Friday. It will be a busy week ...
On Monday, the BEA will release the May Personal Income and Outlays report. The consensus is for a 0.5% increase in income, and a 0.2% increase in spending. Also on Monday, the May Chicago Fed National Activity Index will be released at 8:30 AM. This is a composite index of other data.
On Tuesday, the April Case-Shiller house price index will be released at 9:00 AM. The consensus is for a slight decline in the house price index. At 10:00 AM, the Conference Board will release Consumer Confidence for June (consensus is for about the same as in May or 63.3).
On Wednesday, the ADP employment report will be released (consensus is for an increase of 60K private sector jobs, up from 55K in May). Also on Wednesday, the Chicago Purchasing Managers Index for June will be released. Consensus is for the PMI to be about the same as May, or 59.7.
Also on Wednesday, Altanta Fed President will speak to the Rotary Club of Baton Rouge at 1 PM ET on the economic outlook.
On Thursday, the closely watched initial weekly unemployment claims will be released. Consensus is for a decline to 450K from 457K last week. The automakers will report vehicle sales for June. Expectations are for about a 11.4 million SAAR for light vehicles in June – down slightly from the 11.6 million rate in May. Some forecasts are even lower, from Edmunds:
Edmunds.com forecasts June's Seasonally Adjusted Annualized Rate (SAAR) will be 11.2 million, down from 11.6 million in May, which was a weak month.Also on Thursday, at 10 AM, the ISM Manufacturing index for June will be released (expectations are for a decrease to 59.0 from 59.7 in May) and Construction Spending for April (consensus is for a slight decline in spending).
Also on Thursday, the NAR will release May Pending Home sales at 10 AM. The consensus is for a decline of around 15%. Take the under! Economist Tom Lawler writes:
[M]y “best guess” estimate is that pending sales in May will be down about 35% from April.And on Friday, the BLS will release the June Employment report at 8:30 AM. The consensus is for a loss of 100K payroll jobs in June, and for the unemployment rate to increase slightly to 9.8% (from 9.7%). Of course the minus 100K includes a substantial decline in the number of temporary hires for Census 2010 (May was the peak month). It will be important to remove the Census hiring to try to determine the underlying trend. Consensus is around a gain of 150K payroll jobs ex-Census. (see Employment Report Preview for more).
Also on Friday, the American Bankruptcy Institute will probably report personal bankruptcy filings for June. This will probably show another "surge" in filings.
And Friday afternoon will be another BFF (Bank Failure Friday) ...
And a summary of last week:
The Census Bureau reported that New Home Sales in May were at a seasonally adjusted annual rate (SAAR) of 300 thousand.
 Click on graph for larger image in new window.
This graph shows New Home Sales vs. recessions for the last 45 years.
Sales of new single-family houses in May 2010 were at a seasonally adjusted annual rate of 300,000 ... This is 32.7 percent (±9.9%) below the revised April rate of 446,000 and is 18.3 percent (±13.0%) below the May 2009 estimate of 367,000.The 300 thousand annual sales rate is a new all time record low. The previous record low annual sales rate was 338 thousand in September 1981.
 This graph shows existing home sales, on a Seasonally Adjusted Annual Rate (SAAR) basis since 1993.
 Sales in May 2010 (5.66 million SAAR) were 2.2% lower than last month, and were 19.2% higher than May 2009 (4.75 million SAAR).
The next graph shows the year-over-year (YoY) change in reported existing home inventory and months-of-supply. Inventory is not seasonally adjusted, so it is helpful to look at the YoY change.
 Inventory increased 1.1% YoY in May. This is the second consecutive month of a year-over-year increases in inventory. Although the YoY increase is small, I expect it will be higher later this year.
This increase in inventory is especially concerning because the reported inventory is already historically very high, and the 8.3 months of supply in May is well above normal. The months of supply will probably stay near this level in June, because of more tax credit related sales (reported at closing), but the months-of-supply could be close to double digits later this year.
And a double digit months-of-supply would be a really bad sign for house prices ...
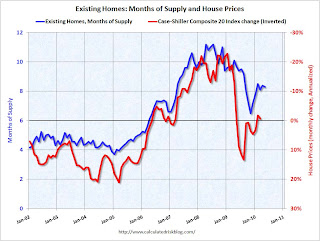 This graph show months of supply and the annualized change in the Case-Shiller Composite 20 house price index (inverted).
Below 6 months of supply (blue line) house prices are typically rising (red line, inverted).
Above 6 months of supply house prices are usually falling (although there were many programs to support house prices over the last year).
Later this year the months of supply will probably increase, and I expect house prices to fall further as measured by the Case-Shiller and CoreLogic repeat sales house price indexes.
 The American Institute of Architects’ Architecture Billings Index declined to 45.8 in May from 48.5 in April. Any reading below 50 indicates contraction.
According to the AIA, there is an "approximate nine to twelve month lag time between architecture billings and construction spending" on non-residential construction. So there will probably be further declines in CRE investment through all of 2010, and probably well into 2011.
Best wishes to all.


