 RSS Feed
 by Calculated Risk on 6/23/2010 11:59:00 PM
Showing posts with label auto. Show all posts
Showing posts with label auto. Show all posts
Wednesday, June 23, 2010
DOT: Vehicle Miles Driven increase in April
Note: on New Home sales, please see: New Home Sales collapse to Record Low in May
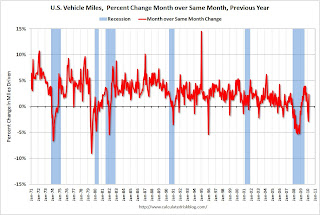
The Department of Transportation (DOT) reported that vehicle miles driven in April were up 1.2% from April 2009:
Travel on all roads and streets changed by +1.2% (3.1 billion vehicle miles) for April 2010 as compared with April 2009. Travel for the month is estimated to be 255.9 billion vehicle miles.
Cumulative Travel for 2010 changed by -0.2% (-1.6 billion vehicle miles).
 Click on graph for larger image in new window.
This graph shows the rolling 12 month total vehicle miles driven.
On a rolling 12 month basis, miles driven are still 2.0% below the peak - and only 0.6% above the recent low - suggesting a sluggish recovery.
Sunday, June 13, 2010
Concern about auto sales
by Calculated Risk on 6/13/2010 05:31:00 PM
From Neal Boudette and Sharon Terlep at the WSJ: Auto-Sales Optimism Fades
According to AutoData, light vehicle sales were up 17.2% over the first five months of 2010 - compared to the same period in 2009. This was an increase from 3.95 million to 4.63 million cars and light trucks.
However - according to Boudette and Terlep - fleet sales were up 32% during the first five months, and sales to individuals were only up 13%.
And without individual buyers it will be hard to maintain sales growth.
George Pipas, the top sales analyst at Ford Motor Co., said he is seeing evidence that consumers are deferring decisions on major purchases, in large part because home values and income growth haven't rebounded.It will be sometime before home values increase significantly (I expect further price declines later this year), and income growth in most industries will be muted with high unemployment. So we should probably expect the growth in auto sales to slow significantly.
"These are two things that really have to happen before you will see auto sales move up more significantly," Mr. Pipas said.
Wednesday, June 02, 2010
U.S. Light Vehicle Sales 11.6 Million SAAR in May
by Calculated Risk on 6/02/2010 03:54:00 PM
Based on an estimate from Autodata Corp, light vehicle sales were at a 11.63 million SAAR in May. This is up 18.1% from May 2009 (when sales were very low), and up 3.9% from the April sales rate. Click on graph for larger image in new window.
This graph shows the historical light vehicle sales (seasonally adjusted annual rate) from the BEA (blue) and an estimate for May (red, light vehicle sales of 11.63 million SAAR from Autodata Corp).
The second graph shows light vehicle sales since the BEA started keeping data in 1967. Note: dashed line is current month sales rate.
Auto sales have recovered from the low levels of early 2009, but are still at the lowest point of the '90/'91 recession (even with a larger number of registered drivers).
This was slightly above most forecasts of around 11.2 million SAAR.
General Motors: Sales up 16.6% compared to May 2009
by Calculated Risk on 6/02/2010 11:08:00 AM
From MarketWatch: GM posts 16.6% rise in May U.S. sales:
General Motors Co. on Wednesday reported a 16.6% rise in May U.S. sales from a year ago to 223,822 vehicles.This is based on an easy comparison: in May 2009 U.S. light vehicle sales fell 31% to 9.8 million (SAAR) from 14.2 million (SAAR) in May 2008. The sharp decline last year was due to the financial crisis, the recession, the Chrysler bankruptcy (Chrysler filed for bankruptcy at the end of April, 2009) and reports of the then impending bankruptcy of GM (GM filed for bankruptcy on June 1, 2009).
UPDATE: From Ford: Ford's U.S. May Sales Up 23 Percent
UPDATE2: From MarketWatch: Chrysler U.S. May sales rise 33% to 104,819 units (Chrysler was in BK last May).
UPDATE3: From MarketWatch: Toyota U.S. May sales up 6.7%
I'll add reports from the other major auto companies as updates to this post.
NOTE: Once all the reports are released, I'll post a graph of the estimated total May sales (SAAR: seasonally adjusted annual rate) - usually around 4 PM ET. Most estimates are for about the same level as April (11.2 million SAAR).
Monday, May 24, 2010
DOT: Vehicle Miles Driven increase in March
by Calculated Risk on 5/24/2010 09:05:00 PM
Note: On existing home sales, please see Inventory increases Year-over-Year and Existing Home Sales increase in April
The Department of Transportation (DOT) reported earlier today that vehicle miles driven in March were up from March 2009:
Travel on all roads and streets changed by +2.3% (5.8 billion vehicle miles) for March 2010 as compared with March 2009. Travel for the month is estimated to be 254.8 billion vehicle miles.So miles driven are still down for the year compared to 2009.
Cumulative Travel for 2010 changed by -0.7% (-4.8 billion vehicle miles).
Also miles driven in March were still 1.7% below March 2007.
 Click on graph for larger image in new window.
This graph shows the percent change from the same month of the previous year as reported by the DOT.
As the DOT noted, miles driven in March 2010 were up 2.3% compared to March 2009.
The YoY decline in February was blamed on the snow, and there might have been some extra driving in March once the weather improved. On a rolling 12 month basis, miles driven are still 2.1% below the peak - and only 0.5% above the recent low - suggesting a sluggish recovery.
Monday, May 03, 2010
U.S. Light Vehicle Sales 11.2 Million SAAR in April
by Calculated Risk on 5/03/2010 03:28:00 PM
Based on an estimate from Autodata Corp, light vehicle sales were at a 11.21 million SAAR in April. This is up 21.8% from April 2009 (when sales were at the lowest level in 30 years), and down 4.6% from the March sales rate that was driven by incentives. Click on graph for larger image in new window.
This graph shows the historical light vehicle sales (seasonally adjusted annual rate) from the BEA (blue) and an estimate for April (red, light vehicle sales of 11.21 million SAAR from Autodata Corp). The second graph shows light vehicle sales since the BEA started keeping data in 1967.
Auto sales have recovered from the low levels of early 2009, but are still below the lowest point of the '90/'91 recession (even with a larger number of registered drivers).
This was slightly below most forecasts of around 11.5 million SAAR.
General Motors: Sales up 6.4% compared to April 2009
by Calculated Risk on 5/03/2010 11:09:00 AM
From MarketWatch: GM April U.S. sales up 6.4% to 183,997 vehicles and from GM: Chevrolet-Buick-GMC-Cadillac Sales Increase 20 Percent in April
Note: GM discontinued several brands, so total vehicle sales were up 6.4%.
Update: From MarketWatch: Ford U.S. April sales jump 24.7% to 167,542 units
Update2: from MarketWatch: Chrysler U.S. April sales increase 25%
Update3: from MarketWatch: Toyota U.S. April sales up 24.4% to 157,439 units
This is based on a very easy comparison: in April 2009 U.S. light vehicle sales fell 36% to 9.2 million (SAAR) from 14.4 million (SAAR) in April 2008. The sharp decline last year was due to the financial crisis, the recession, and reports of the then impending bankruptcy of GM and Chrysler (Chrysler filed for bankruptcy at the end of April, 2009, GM filed for bankruptcy on June 1, 2009).
I'll add reports from the other major auto companies as updates to this post.
NOTE: Once all the reports are released, I'll post a graph of the estimated total April sales (SAAR: seasonally adjusted annual rate) - usually around 4 PM ET. Most estimates are for a slight decrease from the 11.75 million SAAR in March.
Saturday, April 24, 2010
Vehicle Sales: Fleet Turnover Ratio
by Calculated Risk on 4/24/2010 08:49:00 AM
Way back, during the darkest days of the recession, I wrote a couple of optimistic posts about auto sales - Vehicle Sales (Jan 2009) and Looking for the Sun (Feb 2009). By request, here is an update to the U.S. fleet turnover graph.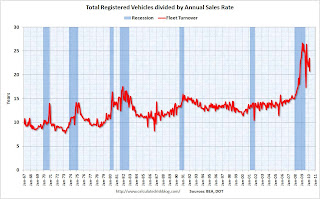 Click on graph for larger image in new window.
This graph shows the total number of registered vehicles in the U.S. divided by the sales rate through March 2010 - and gives a turnover ratio for the U.S. fleet (this doesn't tell you the age or the composition of the fleet).
The recent wild gyrations were due to the cash-for-clunkers program. Note: We are getting used to wild gyrations in economic numbers - just watch the housing numbers over the next few months!
The estimated ratio for March was just under 21 years - still very high, but well below the peak of almost 27 years. The turnover ratio will probably decline further over the next few years.
As expected some vehicles were removed from the fleet during the recession (scrappage exceeded sales), from RL Polk: Polk Finds More Vehicles Scrapped than Added to Fleet:
More than 14.8 million cars and light trucks were retired from the fleet between July 1, 2008 and September 30, 2009, compared to new registrations of slightly more than 13.6 million, resulting in an overall scrap rate of 6.1 percent. This includes thousands of units scrapped during last year’s CARS program, known as ‘Cash for Clunkers,’ and follows a trend seen by Polk over the past five years.Removing vehicles from the fleet reduces the turnover ratio, but most of the expected decline in the ratio will come from further increases in sales.
Polk also reports an increase in the average age of light vehicles on the road, up 21 percent in the past 14 years. The average age for all light vehicles during the 15-month period is 10.2 years ...
 The second graph shows light vehicle sales since the BEA started keeping data in 1967.
 Light vehicle sales were at a 11.8 million SAAR in March. To bring the turnover ratio down to more normal levels, unit sales will probably have to rise to 14 or 15 million SAAR eventually. Of course cars are lasting longer - note the general uptrend in the first graph - so the turnover ratio probably will not decline to the previous level. Also this says nothing about the composition of the fleet (perhaps smaller cars).
Thursday, April 01, 2010
U.S. Light Vehicle Sales 11.8 Million SAAR in March
by Calculated Risk on 4/01/2010 04:00:00 PM
 Click on graph for larger image in new window.
This graph shows the historical light vehicle sales (seasonally adjusted annual rate) from the BEA (blue) and an estimate for March (red, light vehicle sales of 11.78 million SAAR from AutoData Corp).
This is a 13.9% increase from the February sales rate. The second graph shows light vehicle sales since the BEA started keeping data in 1967.
Excluding August '09 (Cash-for-clunkers), this is the highest level since September 2008. The current level of sales are very low, and are at about the low point for the '90/'91 recession (even with a larger population now).
Most forecasts were for sales over 12 million (SAAR), so the sales rate is a little disappointing given all the incentive programs in March.
General Motors: March sales increase 20.6% compared to March 2009
by Calculated Risk on 4/01/2010 11:17:00 AM
From MarketWatch: General Motors U.S. March sales rise 20.6%
This is based on a very easy comparison: in March 2009 U.S. light vehicle sales fell 35% to 9.69 million (SAAR) from 14.9 million (SAAR) in March 2008. The sharp decline last year was due to the financial crisis, the recession, and reports of the then impending bankruptcy of GM and Chrysler (Chrysler filed for bankruptcy at the end of April, 2009, GM filed for bankruptcy on June 1, 2009).
I'll add reports from the other major auto companies as updates to this post.
UDDATE 1: From MarketWatch: Ford March U.S. sales rise 39.8% to 183,783 units
UPDATE 2: From MarketWatch: Chrysler U.S. March sales fall 8.3% to 92,623
UPDATE 3: From MarketWatch: Toyota March U.S. sales grow by nearly 41%
NOTE: Once all the reports are released, I'll post a graph of the estimated total March sales (SAAR: seasonally adjusted annual rate) - usually around 4 PM ET. Most estimates are for an increase to just over 12 million SAAR in March, from the 10.343 million SAAR in February.
Wednesday, March 31, 2010
California Gasoline Usage declines for 4th Consecutive Year
by Calculated Risk on 3/31/2010 06:55:00 PM
From David Baker at the San Francisco Chronicle: State gas usage falls for 4th straight year
Driven lower by high prices and the recession, gasoline sales in California fell for the fourth year in a row during 2009, state officials reported Tuesday.
...
Annual gas sales in California peaked at 15.9 billion gallons in 2005 and have tumbled 7 percent since then.
 Click on graph for larger image in new window.
This graph shows the percent change of taxable gallons of gasoline compared to the same quarter of the prior year.
In addition to gasoline usage being down for four straight years, driven by higher prices and then the recession, usage turned down again in Q4 2009 - probably because prices are up over $3 per gallon again.
Tuesday, March 02, 2010
U.S. Light Vehicle Sales 10.4 Million SAAR in February
by Calculated Risk on 3/02/2010 03:39:00 PM
 Click on graph for larger image in new window.
This graph shows the historical light vehicle sales (seasonally adjusted annual rate) from the BEA (blue) and an estimate for February (red, light vehicle sales of 10.4 million SAAR from AutoData Corp).
This is a 3.5% decline from the January sales rate. The second graph shows light vehicle sales since the BEA started keeping data in 1967.
This is the lowest level since September - when sales fell sharply after the "Cash-for-clunkers" program ended in August. The current level of sales are very low, and are still below the lowest point for the '90/'91 recession (even with a larger population).
Right now it looks like both seasonally adjusted auto sales and residential investment will be lower in Q1 than in Q4 2009.
General Motors: February Sales increase 12% compared to Feb 2009
by Calculated Risk on 3/02/2010 10:36:00 AM
From CNBC: GM's US Auto Sales Rise 11.5 Percent in February
General Motors says its February sales rose 11.5 percent compared with the same month last year ...This is based on a very easy comparison; in February 2009 U.S. light vehicle sales fell sharply to 9.143 million (SAAR) following the financial crisis and reports of the then impending bankruptcy of GM and Chrysler. February 2009 was the bottom for auto sales.
I'll add reports from the other major auto companies as updates to this post. Toyota will be especially interesting because of the quality issues.
Sunday, February 28, 2010
Auto Sales: Blame it on the Snow and Toyota
by Calculated Risk on 2/28/2010 07:25:00 PM
In the Weekly Summary and a Look Ahead post, I included a consensus forecast of a decline in light vehicle sales to 10.4 million units in February, on a seasonally adjusted annual rate (SAAR) basis. That may be a little high ...
From The Detroit News: Snowstorms, Toyota problems cut into February auto sales
When results are released Tuesday, automotive research firm Edmunds.com predicts retail sales will increase 14.2 percent from a year earlier, while research firm TrueCar.com expects a nearly 9 percent bump. ... [On a SAAR basis] Edmunds predicting 10.6 million U.S. sales ... while TrueCar.com anticipates 10.04 million
Friday, February 26, 2010
Tax Credits: Vehicle and Existing Home Sales
by Calculated Risk on 2/26/2010 01:29:00 PM
By request, here is a graph overlaying light vehicle sales and existing home sales - and showing the impact of "cash for clunkers" and the "first time home buyer" tax credit. (ht Brian) Click on graph for larger image in new window.
The red line (left axis) is vehicle sales. The blue line (right axis) is existing home sales since Jan 2008. Both are in millions of units at a Seasonally Adjusted Annual Rate (SAAR).
The Cash for Clunkers program was effective on July 1, 2009, but didn't really start until near the end of July. The program was expanded in early August, and ended on August 24th.
The First Time Home Buyer tax credit was passed in February with an initial deadline to close on the home by November 30, 2009. The home buyer tax credit was extended and expanded at the end of October, and now buyers must sign a contract by April 30, 2010, and close by June 30, 2010.
There will probably be another surge in existing home sales in May and June (reported when sales close). And then sales will probably decline again.
Tuesday, February 02, 2010
U.S. Light Vehicle Sales 10.8 Million SAAR in January
by Calculated Risk on 2/02/2010 04:00:00 PM
 Click on graph for larger image in new window.
This graph shows the historical light vehicle sales (seasonally adjusted annual rate) from the BEA (blue) and an estimate for January (red, light vehicle sales of 10.78 million SAAR from AutoData Corp). The second graph shows light vehicle sales since the BEA started keeping data in 1967.
This is the lowest level since October and below the levels of last July. Obviously sales were boosted significantly by the "Cash-for-clunkers" program in August and some in July.
The current level of sales are still very low, and are still below the lowest point for the '90/'91 recession (even with a larger population).
Ford: January sales rise 25% Compared to 2009
by Calculated Risk on 2/02/2010 12:00:00 PM
From MarketWatch: Ford U.S. January sales rise 25% to 116,534 units
Ford FORD KICKS OFF 2010 WITH 24 PERCENT SALES INCREASE.
This is based on an easy comparison; in January 2009 U.S. light vehicle sales fell sharply to 9.6 million (SAAR) following the financial crisis and reports of the then impending bankruptcy of GM and Chrysler.
I'll add reports from the other major auto companies as updates to this post. Toyota will be especially interesting because of the shutdown related to quality issues.
Update: MarketWatch: GM January U.S. sales rise 14% to 146,825 units
Update2: MarketWatch: Chrysler U.S. Jan. sales fall 8.1% to 57,143 units
Update3: MarketWatch: Toyota Jan. U.S. sales down 15.8% to 98,796 units
NOTE: Once all the reports are released, I'll post a graph of the estimated total January sales (SAAR: seasonally adjusted annual rate) - usually around 4 PM ET. Most estimates are for a decline into the mid 10s from the 11.2 million SAAR in December.
Tuesday, January 05, 2010
U.S. Light Vehicle Sales 11.25 Million SAAR in December
by Calculated Risk on 1/05/2010 03:48:00 PM
 Click on graph for larger image in new window.
This graph shows the historical light vehicle sales (seasonally adjusted annual rate) from the BEA (blue) and an estimate for December (red, light vehicle sales of 11.25 million SAAR from AutoData Corp). The second graph shows light vehicle sales since the BEA started keeping data in 1967.
Obviously sales were boosted significantly by the "Cash-for-clunkers" program in August and some in July.
Excluding August, December was the strongest month since September 2008 (12.5 million SAAR) before sales fell off the final cliff.
The current level of sales are still very low, and are still below the lowest point for the '90/'91 recession (even with a larger population). On an annual basis, 2009 sales were probably just above the level of 1982 (10.357 million light vehicles).
Ford: December U.S. Sales up 32.8% Compared to 2008
by Calculated Risk on 1/05/2010 12:01:00 PM
From MarketWatch: Ford December U.S. sales up 32.8% to 184,655 units
From CNBC: Ford December Sales Jump 23.3%
Ford Press Release.
We need to see the details to see why the two reports are different, but this is based on an easy comparison; in December 2008 U.S. light vehicle sales fell sharply to 10.3 million (SAAR) following the financial crisis.
I'll add the other major reports as updates to this post.
UPDATE: From MarketWatch: Chrysler Dec. U.S. sales fall 3.7% to 86,523
UPDATE2: GM posts 6.1% decline in December U.S. sales
UPDATE3: Toyota Dec. U.S. auto sales up 32% to 187,860
Once all the reports are released, I'll post a graph of the estimated total December sales (SAAR: seasonally adjusted annual rate) - usually around 4 PM ET.
Tuesday, December 01, 2009
Light Vehicle Sales 10.9 Million SAAR in November
by Calculated Risk on 12/01/2009 03:52:00 PM
 Click on graph for larger image in new window.
This graph shows the historical light vehicle sales (seasonally adjusted annual rate) from the BEA (blue) and an estimate for November (red, light vehicle sales of 10.93 million SAAR from AutoData Corp). The second graph shows light vehicle sales since the BEA started keeping data in 1967.
Obviously sales were boosted significantly by the "Cash-for-clunkers" program in August and some in July.
Excluding July and August, this was the strongest month since October 2008 (12.5 million SAAR) before sales fell off the final cliff.
The current level of sales are still very low, and are below the lowest point for the '90/'91 recession (even with a larger population).


