 RSS Feed
 by Calculated Risk on 4/24/2010 08:49:00 AM
Saturday, April 24, 2010
Vehicle Sales: Fleet Turnover Ratio
Way back, during the darkest days of the recession, I wrote a couple of optimistic posts about auto sales - Vehicle Sales (Jan 2009) and Looking for the Sun (Feb 2009). By request, here is an update to the U.S. fleet turnover graph.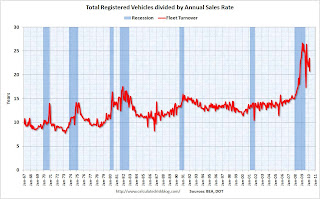 Click on graph for larger image in new window.
This graph shows the total number of registered vehicles in the U.S. divided by the sales rate through March 2010 - and gives a turnover ratio for the U.S. fleet (this doesn't tell you the age or the composition of the fleet).
The recent wild gyrations were due to the cash-for-clunkers program. Note: We are getting used to wild gyrations in economic numbers - just watch the housing numbers over the next few months!
The estimated ratio for March was just under 21 years - still very high, but well below the peak of almost 27 years. The turnover ratio will probably decline further over the next few years.
As expected some vehicles were removed from the fleet during the recession (scrappage exceeded sales), from RL Polk: Polk Finds More Vehicles Scrapped than Added to Fleet:
More than 14.8 million cars and light trucks were retired from the fleet between July 1, 2008 and September 30, 2009, compared to new registrations of slightly more than 13.6 million, resulting in an overall scrap rate of 6.1 percent. This includes thousands of units scrapped during last year’s CARS program, known as ‘Cash for Clunkers,’ and follows a trend seen by Polk over the past five years.Removing vehicles from the fleet reduces the turnover ratio, but most of the expected decline in the ratio will come from further increases in sales.
Polk also reports an increase in the average age of light vehicles on the road, up 21 percent in the past 14 years. The average age for all light vehicles during the 15-month period is 10.2 years ...
 The second graph shows light vehicle sales since the BEA started keeping data in 1967.
 Light vehicle sales were at a 11.8 million SAAR in March. To bring the turnover ratio down to more normal levels, unit sales will probably have to rise to 14 or 15 million SAAR eventually. Of course cars are lasting longer - note the general uptrend in the first graph - so the turnover ratio probably will not decline to the previous level. Also this says nothing about the composition of the fleet (perhaps smaller cars).


