by Calculated Risk on 2/03/2009 06:47:00 PM
Tuesday, February 03, 2009
Looking for the Sun
2009 will be a grim economic year. The unemployment rate will rise all year, house prices will fall, commercial real estate (CRE) will get crushed ... but there might be a few rays of sunshine too.
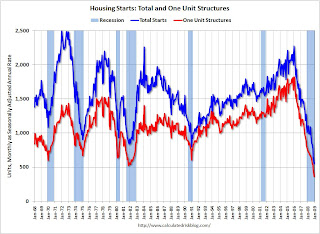
Look at these three charts of Cliff Diving: Click on graph for larger image in new window.
The first graph shows monthly vehicle sales (autos and trucks) as reported by the BEA at a Seasonally Adjusted Annual Rate (SAAR).
Based on the sales reports today from Ford, GM, Toyota and Chrysler, it looks like vehicle sales were below 10 million units (SAAR) for the first time since the early '80s. My estimate is vehicle sales were at a 9.2 million SAAR in January. Ouch! The second cliff diving graph shows New Home Sales for the last 45 years.
Sales of new one-family houses in December 2008 were at 331 thousand (SAAR). This is the lowest level ever recorded by the Census Bureau (data collection started in 1963).
And the third graph shows total and single family housing starts since 1959.  Total starts were at 550 thousand (SAAR) in December, by far the lowest level since the Census Bureau began tracking housing starts in 1959. Single-family starts were at 398 thousand in December; also the lowest level ever recorded (since 1959). Single-family permits were at 363 thousand in November, suggesting single family starts may fall even further next month!
And none of this data is adjusted for changes in population.
No sunshine here. But wait ... we all know this cliff diving will stop sometime, and probably not at zero.
First, look at auto sales ... This graph shows the total number of registered vehicles in the U.S. divided by the sales rate - and gives a turnover ratio for the U.S. fleet (this doesn't tell you the age of the fleet).
The estimated ratio for January is 27 years, by far the highest ever. The actual in December was close to 24 years. This is an unsustainable level, and the ratio will probably decline over the next few years. This could happen with vehicles being removed from the fleet, but more likely because of an increase in sales. (For more analysis, see: Vehicle Sales)
This suggests vehicle sales have fallen too far. And if vehicle sales just stablize, the auto companies can stop laying off workers, and the drag on GDP will stop.
New home sales is a little more difficult because of the huge overhang of excess inventory that needs to be worked off. But some people will always buy new homes, and we can be pretty sure that sales won't fall another 270 thousand in 2009 (like in 2008), because that would put sales at 60 thousand SAAR in December 2009. That is not going to happen.
So, at the least, the pace of decline in new home sales will slow in 2009. More likely sales will find a bottom - to the surprise of many.
And we know for certain that single family starts will not fall as far in 2009 as in 2008, because starts can't go negative! So, once again, the pace of decline will at least slow. And more likely starts will find a bottom too (although any rebound will be weak because of the excess inventory problem).
Even though most of the economic news will be ugly in 2009, my guess is all three of these series will find a bottom (or at least the pace of decline will slow significantly). This means that the drag on employment in these industries, and the drag on GDP, will slow or stop.
These will be rays of sunshine in a very dark season. That doesn't mean a thaw, but it will be a beginning ...


