 RSS Feed
 by Calculated Risk on 5/12/2009 08:31:00 AM
Showing posts with label Trade Deficit. Show all posts
Showing posts with label Trade Deficit. Show all posts
Tuesday, May 12, 2009
U.S. March Trade Deficit: $27.6 billion
The Census Bureau reports:
The ... total March exports of $123.6 billion and imports of $151.2 billion resulted in a goods and services deficit of $27.6 billion, up from $26.1 billion in February, revised. March exports were $3.0 billion less than February exports of $126.6 billion. March imports were $1.6 billion less than February imports of $152.8 billion.
 Click on graph for larger image.
The first graph shows the monthly U.S. exports and imports in dollars through March 2009.
Both imports and exports declined in March, although it appears the cliff diving in trade might be over.
On a year-over-year basis, exports are off 17.4% and imports are off 27%!
The second graph shows the U.S. trade deficit, with and without petroleum, through March.
 The blue line is the total deficit, and the black line is the petroleum deficit, and the red line is the trade deficit ex-petroleum products.
 Import oil prices increased slightly to $41.36 in March following eight consecutive monthly declines. Spot prices have increased since March, so it appears the decline in the trade deficit due to lower oil prices is over for now.
The trade deficit is mostly oil and China now, so any further significant decline in the deficit is unlikely in the short term. Although the NY Times reports: Chinese Exports Fall 22.6% in April
Exports from mainland China slumped 22.6 percent in April from a year earlier, official statistics showed — a fall that was not only larger than economists had expected but also bigger than that in March, when overseas shipments declined 17.1 percent.
Tuesday, April 14, 2009
Los Angeles Port Traffic Rebounds
by Calculated Risk on 4/14/2009 02:54:00 PM
Update note: this is just one month of data, and not seasonally adjusted.
Port traffic gives us an early hint of changes in the trade deficit. Usually I wait until both Los Angeles and Long Beach ports report monthly traffic, but this rebound might be significant. (I'll add Long Beach when the data is released) Click on graph for larger image in new window.
This graph shows the loaded inbound and outbound traffic at the port of Los Angeles in TEUs (TEUs: 20-foot equivalent units or 20-foot-long cargo container). Although containers tell us nothing about value, container traffic does give us an idea of the volume of goods being exported and imported.
Inbound traffic was 6% below last March and 35% above last month.
Outbound traffic was 9.8% below March 2008, and 25% above February.
We have to be careful because of the impact of the Chinese New Year on trade in February, but there does appear to be a significant rebound after trade collapsed in February.
Thursday, April 09, 2009
U.S. Trade Deficit: Lowest Since 1999
by Calculated Risk on 4/09/2009 08:44:00 AM
The collapse in trade continues to be an important story.
The Census Bureau reports:
[T]otal February exports of $126.8 billion and imports of $152.7 billion resulted in a goods and services deficit of $26.0 billion, down from $36.2 billion in January, revised. February exports were $2.0 billion more than January exports of $124.7 billion. February imports were $8.2 billion less than January imports of $160.9 billion.
 Click on graph for larger image.
The first graph shows the monthly U.S. exports and imports in dollars through February 2009. The recent rapid decline in foreign trade continued in February. Note that a large portion of the recent decline in imports was related to the fall in oil prices, however the decline in February was mostly non-oil related.
The second graph shows the U.S. trade deficit, with and without petroleum, through February.
 The blue line is the total deficit, and the black line is the petroleum deficit, and the red line is the trade deficit ex-petroleum products.
 Import oil prices fell slightly to $39.22 in February, from $39.81 in January, and import quantities decreased too - so the petroleum deficit declined by $1 billion.
However most of the decline in the trade deficit was non-oil related.
I suppose a collapse in U.S. imports is one way to rebalance the world economy ...
Friday, March 13, 2009
LA Port Import Traffic Collapses in February
by Calculated Risk on 3/13/2009 06:03:00 PM
Earlier today the Census Bureau reported that both imports and exports continued to decline in January. But February is looking even worse. Last week China reported exports had collapsed in February. And from the Journal of Commerce Online today: St. Petersburg TEU Traffic Plunges
The First Container Terminal in St. Petersburg, Russia’s biggest box terminal, reported traffic in February plunged 27.3 percent from a year ago as imports collapsed.Now we have data from the Port of Los Angeles for February (usually I wait until Long Beach reports too and combine the two ports, but this collapse is stunning).
The terminal handled 61,301 TEUs in February, taking volume for the first two months of the year to 124,608 TEUs, a drop of 24.7 percent on the same period in 2008.
The decline “is a direct result of the unfolding economic downturn which is affecting Russian importers in every possible way,” said Egor Govorukhin, vice president sales and marketing at National Container Co., the terminal’s owner.
 Click on graph for larger image in new window.
This graph shows the loaded inbound and outbound traffic at the port of Los Angeles in TEUs (TEUs: 20-foot equivalent units or 20-foot-long cargo container). Although containers tell us nothing about value, container traffic does give us an idea of the volume of goods being exported and imported.
Inbound traffic was 35% below last February and 35% below last month.
The Port of Los Angeles put up a special message explaining the collapse:
Contributing factors:We have to be careful because of the impact of the Chinese New Year on trade, but it does appear trade collapsed in February.Continued worldwide economic crisis contributing to a decline in trade volumes.
Consumer sales are down due to high unemployment rates. 15 less vessel calls this February due to this decline and the consolidation of services in order to fill up the existing services. Chinese factories closed for an extended periods of time (beyond the normal time period) for Chinese New Year. Due to the lack of volume and Chinese New Year, Maersk 6700 TEU/week vessel did not make any calls in LA during the month of February (which is traditionally a low volume month). Anticipate this year’s volumes will continue to be below last year’s volumes because sales are still slow with most economists predicting there will not be any recovery before the second half of the year.
U.S. Trade: Exports and Imports Decline Sharply in January
by Calculated Risk on 3/13/2009 08:30:00 AM
The sharp decline in both imports and exports continues to be an important story.
The Census Bureau reports:
[T]otal January exports of $124.9 billion and imports of $160.9 billion resulted in a goods and services deficit of $36.0 billion, down from $39.9 billion in December, revised. January exports were $7.6 billion less than December exports of $132.5 billion. January imports were $11.5 billion less than December imports of $172.4 billion..
 Click on graph for larger image.
The first graph shows the monthly U.S. exports and imports in dollars through January 2009. The recent rapid decline in foreign trade continued in January. Note that a large portion of the decline in imports is related to the fall in oil prices - but not all.
The graph includes both goods and services. The import and export of services has held up pretty well; most of the collapse in trade has been in goods. Imports of goods has declined by one third from the peak of last July!
The second graph shows the U.S. trade deficit, with and without petroleum, through January.
 The blue line is the total deficit, and the black line is the petroleum deficit, and the red line is the trade deficit ex-petroleum products.
 Import oil prices fell to $39.81 in January, and import quantities decreased too - so the petroleum deficit declined by $4 billion.
The trade deficit is now mostly China ($20.6 billion NSA in January) and oil.
Wednesday, March 11, 2009
Setser on the Decline in China's Exports
by Calculated Risk on 3/11/2009 10:51:00 AM
From Brad Setser: The fall in China’s exports caught up with the fall in China’s imports, at least for now
After soaring for most of this decade — the pace of China’s export growth clearly turned up in 2002 or 2003 and then stayed at a very high pace — China’s exports are falling back to earth. The surge in China’s exports could prove to be as unsustainable as the rise in US (and some European) home prices. They might end up being mirror images … as Americans and Europeans could only import so much from China so long as they could borrow against rising home prices.
emphasis added

Historically there has been a strong correlation between household mortgage equity withdrawal (MEW) in the U.S. and the U.S. trade deficit. Now that MEW is essentially over, the U.S. trade deficit has declined sharply too.
As Setser suggests, the surge in China's exports were very dependent on the U.S. and European housing bubbles - and MEW.
Note: Q4 MEW will probably be available next week (the Fed's Flow of Funds report will be released tomorrow).
Wednesday, February 18, 2009
LA Area Ports: Exports Decline in January
by Calculated Risk on 2/18/2009 04:46:00 PM
The LA area port traffic data, released today, suggests U.S. exports continued to decline in January. Click on graph for larger image in new window.
This graph shows the combined loaded inbound and outbound traffic at the ports of Long Beach and Los Angeles in TEUs (TEUs: 20-foot equivalent units or 20-foot-long cargo container). Although containers tell us nothing about value, container traffic does give us an idea of the volume of goods being exported and imported.
Inbound traffic was 14% below last January. This slowdown in imports (inbound traffic to the U.S.) is hitting Asian countries hard. There was a slight increase from December to January, but that appears to be mostly seasonal (the data is NSA).
For the LA area ports, outbound traffic continued to decline in January, and was 28% below the level of January 2008. Export traffic is now at about the same level as in 2005. The suggest U.S. exports continued to decline in January after declining sharply in the 2nd half of 2008.
Thursday, February 12, 2009
Setser on Trade and the Current Account Deficit
by Calculated Risk on 2/12/2009 05:42:00 PM
Brad Setser asks: Can the improvement in the US trade balance continue?
The US trade deficit — which is a good proxy for the current account balance (the income surplus offsets a transfers deficit) — is now around $40b a month. At its peak it was more like around $60b a month. That implies, if nothing changes, the 2009 current account deficit would be around $500b, down from a peak of $700b.That is an important point, but I'd like to focus on another comment from Brad:
In fact, if nothing changes the trade balance balance might improve a bit more. ...
Remember this the next time someone argues that the US will be borrowing more from the rest of the world to finance its fiscal deficit: the total amount the US borrows from the world is defined by the current account deficit and the current account deficit clearly went down in the fourth quarter even as the US fiscal deficit (and the Treasury’s borrowing need) soared. That is because the rise in government borrowing offset a contraction in private investment and a rise in private savings.
Forecasts that the US deficit will fall to 2.5% to 3% of GDP strike me as optimistic.Back in 2005, I argued that the trade deficit would start to decline as a percent of GDP - but I haven't forecast how much further the deficit would decline.
The net result: I expect a slowing global economy to take a toll on US exports and do not expect much additional improvement in the US current account balance. I’ll be watching closely to see if the markets are willing to finance a growing deficit …. and, for that matter, if China is willing to finance a growing US deficit and add to its already considerable exposure.
 Click on graph for larger image.
This graph shows the U.S. trade deficit / surplus as a percent of GDP since 1960 through Q4 2008.
The trade deficit as a percent of GDP started declining in 2006, even with the rapid increase in oil prices. Now, with oil prices declining sharply, the trade deficit has plunged to 3.7% of GDP in Q4.
The oil deficit will fall further in January, and if all else stays the same, the trade deficit might fall close to $30 billion per month in Q1 2009. At that pace, the deficit as a percent of GDP would be in the 2.5% to 3.0% range.
So although I agree with Brad that I'd prefer the rebalancing was because of "strong growth abroad not a collapse in private US demand", I think the deficit will fall to 3% of GDP sometime in 2009.
Wednesday, February 11, 2009
U.S. Trade: Exports and Imports Decline Sharply
by Calculated Risk on 2/11/2009 08:36:00 AM
The big trade story is the continuing sharp decline in both imports and exports.
The Census Bureau reports:
[T]otal December exports of $133.8 billion and imports of $173.7 billion resulted in a goods and services deficit of $39.9 billion, down from $41.6 billion in November, revised. December exports were $8.5 billion less than November exports of $142.3 billion. December imports were $10.2 billion less than November imports of $183.9 billion.
 Click on graph for larger image.
The first graph shows the monthly U.S. exports and imports in dollars through December 2008. The recent rapid decline in foreign trade continued in December. Note that a large portion of the decline in imports is related to the fall in oil prices - but not all.
The second graph shows the U.S. trade deficit, both with and without petroleum through December.
 The blue line is the total deficit, and the black line is the petroleum deficit, and the red line is the trade deficit ex-petroleum products.
 Import oil prices fell to $49.93 in December, although import quantities increased in December - so the petroleum deficit only declined slightly. Import oil prices will probably fall further in January.
Excluding petroleum, the trade deficit has been falling since early 2006. The rebalancing of trade continues, although the sharp declines in both imports and exports is very concerning.
Saturday, January 24, 2009
U.S. Trade Deficit Graphs
by Calculated Risk on 1/24/2009 08:06:00 PM
“President Obama — backed by the conclusions of a broad range of economists — believes that China is manipulating its currency.”I'm just thinking about some trades issues, and here a few graphs that might be helpful:
Treasury Secretary nominee Tim Geithner, Jan 22, 2009
 Click on graph for larger image.
The first graph shows the monthly U.S. exports and imports in dollars through November 2008 (most recent data). The recent rapid decline in foreign trade is clear. Note that a large portion of the decline in imports is related to the fall in oil prices.
Looking at port traffic data, exports and imports collapsed further in December.
 The second graph shows the U.S. trade deficit / surplus as a percent of GDP since 1960 through Q3 2008.
The trade deficit as a percent of GDP started declining in 2006, even with the rapid increase in oil prices. Now, with oil prices falling rapidly, the trade deficit as a percent of GDP will decline sharply in Q4 2008 and Q1 2009.
 The third graph shows the U.S. trade deficit, both with and without petroleum through November.
 The blue line is the total deficit, and the black line is the petroleum deficit, and the red line is the trade deficit ex-petroleum products.
So, excluding petroleum, the trade deficit has been falling since early 2006.
 This graph compares monthly U.S. spot oil prices from the Energy Information Administration (EIA) with import oil prices from the Census Bureau trade report.
Obviously the two price series track very well. This implies that import oil prices will drop sharply in the December and January reports, from $67 per barrel in November to around $37 per barrel in January.
Based on this decline in oil prices, and looking back at the third graph, the oil deficit will probably fall from around $19 billion in November to close to $10 billion in January (the actual decline depends on volumes in addition to price). All else being equal, this would push the trade deficit down to $30 billion in January.
And this brings us back to the quote at the top from Geithner. The trade deficit with China was $23 billion in November alone, and even with declining imports from China, the deficit with China will probably account for well over half of the U.S. trade deficit in January.
Just some thoughts ... For some excellent discussion of trade issues (especially with China) see Brad Setser's blog: Follow the Money
Thursday, January 15, 2009
LA Area Port Traffic Collapses in December
by Calculated Risk on 1/15/2009 09:05:00 PM
Both imports and exports declined sharply in November, but just wait until we see the December trade numbers. Based on LA area port traffic numbers released today, trade volumes collapsed in December. Click on graph for larger image in new window.
This graph shows the combined loaded inbound and outbound traffic at the ports of Long Beach and Los Angeles in TEUs (TEUs: 20-foot equivalent units or 20-foot-long cargo container). Although containers tell us nothing about value, container traffic does give us an idea of the volume of goods being exported and imported.
Inbound traffic was 19% below last December. This slowdown in exports (inbound traffic to the U.S.) is hitting Asian countries hard.
But even more shocking and important for the U.S. economy is that export traffic has collapsed. For the LA area ports, outbound traffic continued to decline in December, and was 30% below the level of December 2007. Export traffic is now at about the same level as in late 2005. So much for the export boom!
Now it is the export bust.
Tuesday, January 13, 2009
Trade Deficit Declines Sharply
by Calculated Risk on 1/13/2009 08:45:00 AM
Both exports and imports are declining, but the decline in the trade deficit was mostly about oil prices. Petroleum import prices fell from $92 per barrel in October to under $67 per barrel in November - and will fall further in December.
The Census Bureau reports:
[T]otal November exports of $142.8 billion and imports of $183.2 billion resulted in a goods and services deficit of $40.4 billion, down from $56.7 billion in October, revised. November exports were $8.7 billion less than October exports of $151.5 billion. November imports were $25.0 billion less than October imports of $208.2 billion.
 Click on table for larger image in new window.
This graph from the Census Bureau shows that both imports and exports are declining.
Although the trade deficit is declining - and will probably decline further in December because of the continued decline in oil prices - growth in export related businesses will probably no longer be a positive for the U.S. economy as the global economy slides into recession too.
This graph shows the U.S. trade deficit through November. The blue line is the total deficit, and the black line is the petroleum deficit, and the red line is the trade deficit ex-petroleum products. The current recession is marked on the graph.The oil deficit declined sharply in November and will decline further in December. But even ex-petroleum, the trade deficit is still declining.
Wednesday, December 10, 2008
Setser: On Global Trade and China
by Calculated Risk on 12/10/2008 11:40:00 AM
From Brad Setser: Global trade is shrinking, fast
China’s November trade data (a 2.2% year over year fall in exports; a 17.9% year over year fall in imports — see Andrew Batson of the Wall Street Journal) suggests that global trade is contracting quite rapidly. And since trade accounts for a rising share of global activity, it suggests that the global economy has stalled — and perhaps is contracting.But China may still run a strong surplus, because the decline in imports (because of falling commodity prices) will more than offset the decline in exports:
The fall in China’s exports suggests global demand is falling. And the fall in China’s imports on first blush seems larger than can be explained just by the fall in demand for imported components for China’s exports and sliding commodity prices: it suggests that Chinese domestic demand is quite weak ...
The November data from Korea and Taiwan tells a similar story. All experienced far larger falls in year over year falls in their exports than China did.
[R]ight now there isn’t any much reason to think that China’s trade surplus will shrink in 2009. Exports will fall. But so will imports. And the fall in commodity prices implies that the terms of trade have shifted in China’s favor.See Brad's post for more. The recession has gone global.
Sunday, November 16, 2008
Slowing Exports and Residential Investment
by Calculated Risk on 11/16/2008 02:46:00 PM
From Dr. Setser: Ut-oh …. exports are starting to fall fast.
[T]he non-petrol goods deficit is now moving in the wrong direction. It increased from $29.3b in June to $35.6b in August. Non-petrol exports fell by $9.9b over the last two months, while non-petrol imports fell by “only” $3.7 billion.Although Brad Setser is concerned about the global impact of slowing U.S. exports, I think there is another interesting relationship: net exports vs. residential investment. Let me add a couple of graphs ...
...
And remember this is the September data. Since then the global outlook has deteriorated — and the dollar has strengthened substantially. That isn’t going to help US exports.
 Click on graph for larger image in new window.
The first graph shows real residential investment (from the BEA) and real net exports. These are historically countercyclical; as residential investment increases the trade deficit tends to increase, and as residential investment falls, the trade deficit declines.
 The second graph shows this as a contribution to GDP (rolling 4 quarters to smooth the data).
This shows that residential investment and net exports are countercyclical and tend to offset each other somewhat as far the impact on GDP. This is important because slowing exports could mean that there is nothing to offset a further decline in residential investment.
The good news is the trade deficit will decline sharply over the next few months (because of the decline in oil prices), and residential investment might bottom sometime in the next few quarters.
The bad news is the trade deficit might start increasing again - after the oil price adjustment - because of the stronger dollar and weak global economies. And residential investment might bottom, but any recovery will probably be anemic because of the huge overhang of surplus inventory. So it is unlikely that residential investment will offset any possible rise in the trade deficit.
Just something to add to Setser's post ...
Friday, November 14, 2008
LA Ports in October: Export Traffic Below 2007
by Calculated Risk on 11/14/2008 09:20:00 AM
 Click on graph for larger image in new window.
This graph shows the combined loaded inbound and outbound traffic at the ports of Long Beach and Los Angeles in TEUs (TEUs: 20-foot equivalent units or 20-foot-long cargo container). Although containers tell us nothing about value, container traffic does give us an idea of the volume of goods being exported and imported.
Inbound traffic has peaked for the year as retailers have already imported most of the goods for the holiday season. Inbound traffic is about 7% below last October.
This slowdown in exports (inbound traffic to the U.S.) is hitting countries like China hard, from the NY Times: Factories Shut, China Workers Are Suffering
[A]n export slowdown that began earlier this year and that has been magnified by the global financial crisis of recent months is contributing to the shutdown of tens of thousands of small and mid-size factories here and in other coastal regions, forcing laborers to scramble for other jobs or return home to the countryside.But even more concerning for the U.S. is that export traffic is declining. For the LA area ports, outbound traffic fell off a cliff in September, and was even lower in October. Outbound traffic was about 8% below the level of October 2007.
The key supports for the economy earlier this year - consumer spending, exports, and investment in non-residential structures - are all declining sharply now.
Thursday, November 13, 2008
Trade Deficit Declines to $56.5 Billion in September
by Calculated Risk on 11/13/2008 09:03:00 AM
A few points from the trade report:
The Census Bureau reports:
[T]otal September exports of $155.4 billion and imports of $211.9 billion resulted in a goods and services deficit of $56.5 billion, down from $59.1 billion in August, revised. September exports were $9.9 billion less than August exports of $165.3 billion. September imports were $12.5 billion less than August imports of $224.4 billion.
 Click on table for larger image in new window.
This graph from the Census Bureau shows that both imports and exports are declining.
Although the trade deficit is declining - and will decline more in coming months because of the decline in oil prices - growth in export related business will probably no longer be a positive for the U.S. economy as the global economy slides into recession too.
 This graph shows the U.S. trade deficit through September. The blue line is the total deficit, and the black line is the petroleum deficit, and the red line is the trade deficit ex-petroleum products. The current recession is marked on the graph.
The oil deficits is starting to decline and will decline much further in October and November. Note that the trade deficit ex-petroleum is really a China problem now (the trade deficit with China was a record $27.8 billion in September).
Saturday, November 01, 2008
The Possible Impact of Contracting Manufacturing in China
by Calculated Risk on 11/01/2008 04:48:00 PM
From Bloomberg: China Manufacturing Contracts as Crisis Trims Exports
The Purchasing Managers' Index fell to a seasonally adjusted 44.6 last month from 51.2 in September, the China Federation of Logistics and Purchasing said today ... That was the lowest since the gauge was launched in July 2005. A reading below 50 reflects a contraction, above 50 an expansion.As China tries to stimulate their economy, this could have an adverse impact on U.S. interest rates. Let me explain ...
China's cabinet has pledged extra infrastructure spending to stimulate the world's fourth-biggest economy amid the global slowdown. ... ``The government needs effective stimulus measures to spur growth,'' said Wang Qian, a Hong Kong-based economist at JPMorgan Chase & Co. ``The external economic outlook is worsening rapidly.''
Manufacturing contracted in July for the first time since the survey began in 2005. It also shrank in August. The October index was a record low.
First, here is an excerpt from a post I wrote in March 2005:
There is a strong correlation between increases in mortgage debt and increases in the trade deficit. Although the correlation is high, it is very possible that there is no direct linkage, instead the same economic causes that led to higher trade deficits also led to more household borrowing. However, in recent years, with the dramatic increases in mortgage borrowing (far exceeding the increases in GDP) it is reasonable to expect that some of that money is flowing to imports.This led me to correctly predict that as the housing bust picked up steam in the U.S., the trade deficit would peak as a percent of GDP. I also mused about another potential impact of a declining trade deficit - rising intermediate to long term interest rates in the U.S. Here are some diagrams I presented in early 2005:
The implications are important: if the housing market slows down, it will negatively impact both the domestic economy and the economies of our export driven trading partners: China, Japan, S. Korea and others.
Perhaps we have seen a Virtuous Cycle as depicted in the following diagram:
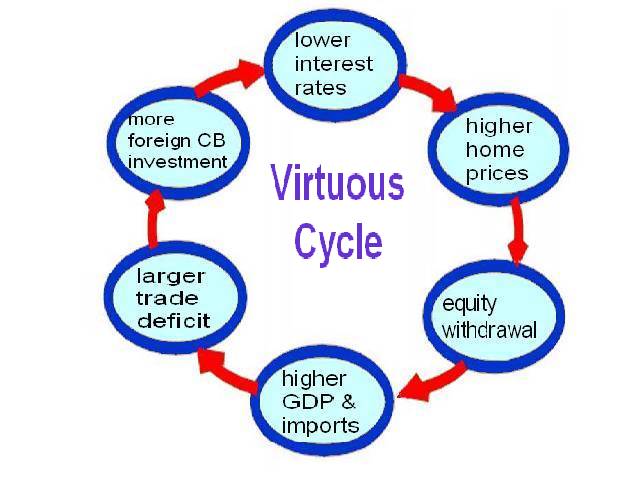 Click on graph for larger image in new window.
Starting from the top ... lower interest rates have led to an increase in housing prices. And those higher housing prices have led to an ever increasing equity withdrawal by homeowners. ... it is reasonable to assume that a large percentage of this equity withdrawal has flowed to consumption, increasing both GDP and imports over the last few years. ... it appears mortgage equity withdrawal has been a meaningful contributor to the ever widening trade and current account deficits.
To finance the current account deficit, foreign Central Banks (CBs) have been investing heavily in dollar denominated securities. Some analysts have suggested that these investments have lowered interest rates by between 40 bps and 200 bps (Roubini and Setser: "Will the Bretton Woods 2 Regime Unravel Soon? The Risk of a Hard Landing in 2005-2006")
If these analysts are correct, and foreign CB intervention is lowering treasury yields, then this has also lowered mortgage interest rates ... and the cycle repeats. The result: a Virtuous Cycle with higher housing prices, more consumption and lower interest rates.
As a result of the rapidly increasing housing prices, we are now seeing significant speculation, excessive leverage and poor credit quality of new homebuyers; all the signs of an overheated market. ... What happens if the housing market cools down?
The Vicious Cycle
The following diagram depicts the possible unwinding of the current cycle.
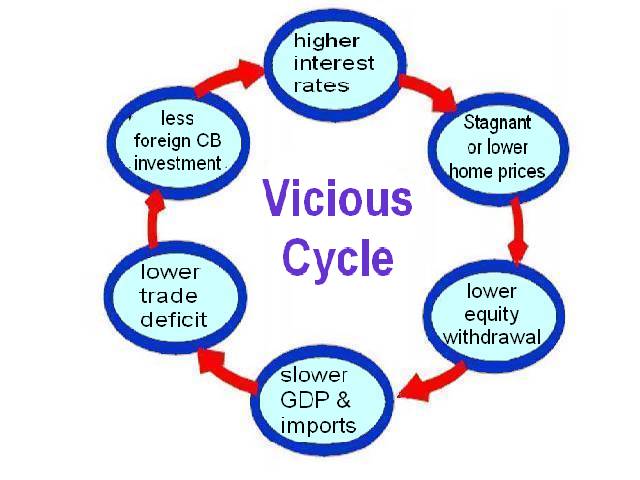 In the possible vicious cycle that I diagrammed, lower home prices would lead to lower equity withdrawal (equity withdrawal has collapsed, see: Q2 2008: Mortgage Equity Withdrawal Plunges to Near Zero) and this would lead to a slow down in GDP growth and lower imports.
GDP in the U.S. is now contracting, and imports are falling and the trade deficit is shrinking. And as foreign CB invest less in dollar denominated assets (and also try to stimulate their domestic economies) this could lead to higher interest rates for intermediate and long term U.S. assets. As I noted in 2005, the result could be a vicious cycle with higher intermediate and long term rates further depressing the U.S. housing market and consumption.
Although this is very speculative, higher intermediate and long term interest rates in the U.S. for a short period wouldn't be helpful during a recession. This is something to think about as the Chinese economy slows ...
Friday, October 24, 2008
Port Traffic Declines Sharply in September
by Calculated Risk on 10/24/2008 02:29:00 PM
 Click on graph for larger image in new window.
This graph shows the combined loaded inbound and outbound traffic at the ports of Long Beach and Los Angeles in TEUs (TEUs: 20-foot equivalent units or 20-foot-long cargo container). Although containers tell us nothing about value, container traffic does give us an idea of the volume of goods being exported and imported.
Inbound traffic should be peaking for the year as retailers prepare for the holiday season. Inbound traffic is off from August, and about 12% below last September.
Outbound traffic fell off a cliff in September, and is 17% below August 2008, and at about the same level as a year ago.
From the WSJ: Reliance on Exports Hurts Asia
The meltdown in Asian stock prices on Friday stemmed in part from the growing realization that the heavy reliance on exports that has driven Asia's powerful growth is now turning into the its worst enemy.So much for decoupling. It's hard to believe this comes as a surprise ...
The evaporation of consumer spending in the U.S. and Europe is starting to hit deeply at Asian manufacturing titans that thrive on sales to the rest of the world, and that are now rapidly scaling down their capital spending.
Thursday, October 09, 2008
Trade Deficit and Oil
by Calculated Risk on 10/09/2008 07:06:00 PM
Something a little different ...
Tomorrow morning the Department of Commerce will release the trade deficit report for August. Some people might be looking at this report to see the impact of falling oil prices and slowing export growth.
It is helpful to remember that oil prices peaked in July, but there is a lag between spot price and import prices. Therefore I expect import oil prices to be a little higher for August than July. Click on table for larger image in new window.
This graph, based on data from the EIA, shows the weekly spot prices for oil weighted by import volume.
I expect that the collapse in oil prices will not show up until the September trade deficit report.
Oil prices fell even further today, from the AP: Demand destruction: Oil prices drop to 1-year low.
And export growth may be slowing, but I don't expect to see much evidence in the August report. If we look at container traffic at the Los Angeles area ports, exports were still strong in August.
So the trade deficit tomorrow probably won't show either the impact from falling oil prices or slowing export growth. Just something to remember when we read the news reports.
Thursday, September 04, 2008
The Import Slowdown: Los Angeles Area Ports
by Calculated Risk on 9/04/2008 07:47:00 PM
This is an update to an earlier post in April. Click on graph for larger image in new window.
This graph shows the loaded containers per month - inbound and outbound - for the ports of Los Angeles and Long Beach combined.
Note: container traffic doesn't tell us about value, but it gives us a general idea on import and export volumes. We have to wait for the monthly trade deficit report for dollar values.
Imports have been surging for years, but import traffic started to decrease last year. For the last two month, import traffic averaged a decrease of 12.1% year-over-year.
Recently exports have picked up, and for the last two months export traffic has increased an average of 17.8% year-over-year.
Although this is just two Los Angeles area ports, this fits with the declining trade deficit (see 2nd graph). For export businesses in the U.S., these have been good times. However, as San Francisco Fed President Dr. Yellen noted this morning, the global slowdown might start to impact exports:
"[E]xport growth alone contributed one-half of the total real GDP growth registered in the second quarter. This element has been an important source of strength in our economy for over a year, being buoyed by strong growth abroad and by the weakening of the dollar. However ... in recent months the dollar has risen somewhat and economic growth in many of our industrialized trading partners has slowed or even turned negative, suggesting that we can no longer count on exports as an important source of strength."
 Here is a graph of the trade deficit (June is the most recent data).
The red line is the trade deficit excluding petroleum products. (Blue is the total deficit, and black is the petroleum deficit). The oil deficits in July and probably August will be ugly, but it now looks like the oil deficit will decline sharply later this year. Note: import oil prices are calculated when oil is delivered, so there is a lag between future prices and import prices.
The ex-petroleum deficit is already falling fairly rapidly with weak imports and strong exports.
Back in April I asked what would be the impact of slowing imports on China and on oil prices? I noted the dramatic decline in the Shanghai index:
 The Shanghai SSE composite index is now below 2,277, the lowest since the amazing run up started in 2006. The index is off over 61% from the peak. This suggests a slowdown in the Chinese economy, and probably less business investment in China.
And the SSE index will probably fall further tonight after the 344 decline in the DOW today.
And as far as oil prices, the decline has been sharp, with prices now down by about one third from the peak. This could have serious implications for OPEC, see the NY Times: As Oil Prices Fall, OPEC Faces a Balancing Act and my speculation back in March: Petroleum Prices and GCC Spending
There is no longer any discussion of decoupling of the U.S. and world economies (something that never made sense to me). Now the questions are: Will U.S. exports continue to grow as economic growth slows or turns negative for U.S. trading partners? And will a combination of some U.S. export growth and lower oil prices provide enough of a cushion to keep the U.S. out of a severe recession? I think so, but the next several quarters will be especially ugly in the U.S. with rising unemployment, less business investment, and probably negative Personal Consumption Expenditures (PCE), or in Dr. Yellen's words "decidedly subpar" (and she wasn't discussing golf).


