by Calculated Risk on 2/11/2009 08:36:00 AM
Wednesday, February 11, 2009
U.S. Trade: Exports and Imports Decline Sharply
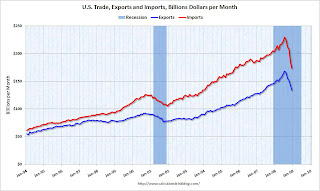
The big trade story is the continuing sharp decline in both imports and exports.
The Census Bureau reports:
[T]otal December exports of $133.8 billion and imports of $173.7 billion resulted in a goods and services deficit of $39.9 billion, down from $41.6 billion in November, revised. December exports were $8.5 billion less than November exports of $142.3 billion. December imports were $10.2 billion less than November imports of $183.9 billion.
 Click on graph for larger image.
The first graph shows the monthly U.S. exports and imports in dollars through December 2008. The recent rapid decline in foreign trade continued in December. Note that a large portion of the decline in imports is related to the fall in oil prices - but not all.
The second graph shows the U.S. trade deficit, both with and without petroleum through December.
 The blue line is the total deficit, and the black line is the petroleum deficit, and the red line is the trade deficit ex-petroleum products.
 Import oil prices fell to $49.93 in December, although import quantities increased in December - so the petroleum deficit only declined slightly. Import oil prices will probably fall further in January.
Excluding petroleum, the trade deficit has been falling since early 2006. The rebalancing of trade continues, although the sharp declines in both imports and exports is very concerning.


