 RSS Feed
 by Calculated Risk on 12/09/2010 04:20:00 PM
Showing posts with label CRE. Show all posts
Showing posts with label CRE. Show all posts
Thursday, December 09, 2010
Hotels: RevPAR up 5.3% compared to same week in 2009
A weekly update on hotels from HotelNewsNow.com: STR: Orlando leads weekly performance
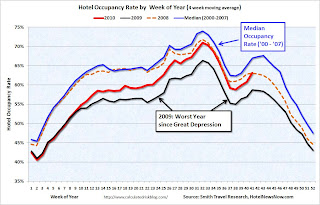
Overall, the U.S. hotel industry’s occupancy increased 4.7% to 49.9%, ADR was up 0.5% to US$96.87, and RevPAR ended the week up 5.3% to US$48.31.The following graph shows the four week moving average for the occupancy rate by week for 2008, 2009 and 2010 (and a median for 2000 through 2007).
 Click on graph for larger image in new window.
Notes: the scale doesn't start at zero to better show the change. The graph shows the 4-week average, not the weekly occupancy rate.
On a 4-week basis, occupancy is up 7.8% compared to last year and 4.6% below the median for 2000 through 2007.
Note: Last week RevPAR (revenue per available room) was up compared to the same week two years ago (in 2008) for the first time this year. This week RevPAR is down 5.9% compared to 2008.
Data Source: Smith Travel Research, Courtesy of HotelNewsNow.com
Wednesday, December 08, 2010
CB Richard Ellis: Office Vacancy rate to peak in Q2 2011
by Calculated Risk on 12/08/2010 08:54:00 PM
According to Reis, the office vacancy rate hit a 17 year high in Q3, but the rate of increase has slowed.
Today CB Richard Ellis released a forecast for the office market: U.S. Office Real Estate Vacancy Rate expected to decline modestly in 2011
CBRE-EA forecasts that the office vacancy rate will peak in 2Q2011 at 16.8%, up from the 16.6% level at 3Q2010. ... The U.S. office market vacancy rate is expected to slowly decline over the next two years, falling to 16.4% by the end of 2011 and to 15.3% by the end of 2012 ...This forecast sounds about right. It appears leasing has started to increase a little, and investment in office structures is at a record low as percent of GDP - so the office vacancy rate will probably peak soon.
“The recent increase in leasing is a step in the right direction but activity is uneven across markets and generally tenant footprints are not increasing,” said Arthur Jones, Senior Economist, CBRE-EA. “Since office space is the "economy in a box", continued job growth is key to the market‟s ongoing recovery.”
... the recovery will take longer to gain traction in depressed housing markets such as California and Arizona ...
“While vacancy is starting to improve, the high levels indicate that the rent recovery will be measured in terms of years,” said Mr. Jones. “The process will take time and the outlook over the next year will remain subdued with little upward movement in rent.”
However, with the vacancy rate near 17%, it will be some time before there is an increase in new office investment (and the associated construction jobs).
Thursday, December 02, 2010
Hotels: RevPAR up 10.1% compared to same week in 2009
by Calculated Risk on 12/02/2010 11:50:00 PM
From HotelNewsNow.com: STR: Upscale segment reports strong weekly gains
Overall, the industry’s occupancy increased 7.0% to 43.6%, ADR was up 2.9% to US$87.53, and RevPAR ended the week up 10.1% to US$38.16.The following graph shows the four week moving average for the occupancy rate by week for 2008, 2009 and 2010 (and a median for 2000 through 2007).
 Click on graph for larger image in new window.
Notes: the scale doesn't start at zero to better show the change. The graph shows the 4-week average, not the weekly occupancy rate.
On a 4-week basis, occupancy is up 8.2% compared to last year and 4.2% below the median for 2000 through 2007.
Note: For the first time this year, RevPAR (revenue per available room) was up compared to the same week two years ago (in 2008).
Data Source: Smith Travel Research, Courtesy of HotelNewsNow.com
Monday, November 22, 2010
Moody's: Commercial Real Estate Prices increase in September
by Calculated Risk on 11/22/2010 11:52:00 AM
Moody's reported today that the Moody’s/REAL All Property Type Aggregate Index increased 4.3% in September. This reverses the sharp decline in August. Note: Moody's CRE price index is a repeat sales index like Case-Shiller - but there are far fewer commercial sales - and that can impact prices and make the index very volatile.
Below is a comparison of the Moodys/REAL Commercial Property Price Index (CPPI) and the Case-Shiller composite 20 index. Beware of the "Real" in the title - this index is not inflation adjusted.
 Click on graph for larger image in new window.
CRE prices only go back to December 2000.
The Case-Shiller Composite 20 residential index is in blue (with Dec 2000 set to 1.0 to line up the indexes).
It is important to remember that the number of transactions is very low and there are a large percentage of distressed sales.
From Bloomberg: Commercial Property Prices in U.S. Increase the Most on Record, Moody Says
U.S. commercial property prices rose 4.3 percent in September from the previous month ... “Each of the summer months this year recorded declines in the 3 percent to 4 percent range, followed by this month’s sizeable uptick,” Nick Levidy, a Moody’s managing director in New York, said in the statement. “The relatively large swings seen in the index recently are due in part to the uncertain macroeconomic environment and the effects of a thin market with low transaction volumes.”The headline for the Bloomberg article is a little misleading - there was a large reported increase in September, but that was pretty minor compared to the price declines over the summer.
Thursday, November 18, 2010
Hotels: RevPAR up 14.1% compared to same week in 2009
by Calculated Risk on 11/18/2010 02:51:00 PM
From HotelNewsNow.com: STR: Chain scales report strong weekly results
Overall, the industry’s occupancy increased 11.1% to 58.4%, ADR was up 2.7% to US$98.77, and RevPAR ended the week up 14.1% to US$57.65.The following graph shows the four week moving average for the occupancy rate by week for 2008, 2009 and 2010 (and a median for 2000 through 2007).
 Click on graph for larger image in new window.
Notes: the scale doesn't start at zero to better show the change. The graph shows the 4-week average, not the weekly occupancy rate.
On a 4-week basis, occupancy is up 9.2% compared to last year and 6.1% below the median for 2000 through 2007.
Note: Even though the occupancy rate is above the level of the same week in 2008, and RevPAR (revenue per available room) is up 14.1% compared to the same week in 2009 - RevPAR is still down 3.7% compared to the same week in 2008 - and the 2nd half of 2008 was a very difficult period for the hotel industry.
This suggests some increase in business travel - and probably a little more business confidence (the spring and fall are mostly business travel).
Data Source: Smith Travel Research, Courtesy of HotelNewsNow.com
Tuesday, November 16, 2010
AIA: Architecture Billings Index shows contraction in October
by Calculated Risk on 11/16/2010 11:59:00 PM
Note: This index is a leading indicator for new Commercial Real Estate (CRE) investment.
Reuters reports that the American Institute of Architects’ Architecture Billings Index decreased to 48.7 in October from 50.4 in September. Any reading below 50 indicates contraction.
The ABI press release is not online yet.
 Click on graph for larger image in new window.
This graph shows the Architecture Billings Index since 1996. The index showed expansion in September (above 50) for the first time since Jan 2008, however the index is indicating contraction again in October.
Note: Nonresidential construction includes commercial and industrial facilities like hotels and office buildings, as well as schools, hospitals and other institutions.
According to the AIA, there is an "approximate nine to twelve month lag time between architecture billings and construction spending" on non-residential construction. So there will probably be further declines in CRE investment for the next 9 to 12 months.
Thursday, November 11, 2010
Hotels: RevPAR up 8.2% compared to same week in 2009
by Calculated Risk on 11/11/2010 06:15:00 PM
Hotel occupancy is one of several industry specific indicators I follow ...
Important: Even though the occupancy rate is close to the weak 2008 levels, and RevPAR (revenue per available room) is up 8.2% compared to the same week in 2009 - RevPAR is still down 3% compared to the same week in 2008 - and the 2nd half of 2008 was a very difficult period for the hotel industry.
From HotelNewsNow.com: STR: Midscale with F&B reports strong weekly results
Overall, the total U.S. hotel industry’s occupancy increased 6.2% to 58.2%, average daily rate was up 1.9% to US$99.29, and RevPAR ended the week up 8.2% to US$57.75.The following graph shows the four week moving average for the occupancy rate by week for 2008, 2009 and 2010 (and a median for 2000 through 2007).
 Click on graph for larger image in new window.
Notes: the scale doesn't start at zero to better show the change. The graph shows the 4-week average, not the weekly occupancy rate.
On a 4-week basis, occupancy is up 8.6% compared to last year and 5.8% below the median for 2000 through 2007.
The occupancy rate is slightly above the levels of 2008, but RevPAR is still down 3% compared to the same week in 2008.
Data Source: Smith Travel Research, Courtesy of HotelNewsNow.com
Friday, October 29, 2010
Commercial Real Estate: "Normal market conditions years away"
by Calculated Risk on 10/29/2010 10:03:00 PM
From Buck Wargo at the Las Vegas Sun: Commercial real estate’s slide likely at an end
The commercial real estate market led by the office sector appears to have halted its slide ... analysts said.It is possible the office vacancy rate has peaked - or is near the peak as the the Reis vacancy data suggests - but it will take a long time to absorb all the excess office space. And that means non-residential investment in office buildings will be low for some time.
...
With little construction and the demand for space outpacing those who are giving it up, it appears the office market isn’t going to worsen, [Jake Joyce, a project manager with Applied Analysis] said.
“While it’s easy to latch on to even the smallest bright spot, the return to more normal market conditions is years away, but must start somewhere,” Joyce said.
But you do have to start somewhere ...
Wednesday, October 20, 2010
AIA: Architecture Billings Index shows expansion, first time since Jan 2008
by Calculated Risk on 10/20/2010 12:00:00 AM
Note: This index is a leading indicator for new Commercial Real Estate (CRE) investment.
Reuters reports that the American Institute of Architects’ Architecture Billings Index increased to 50.4 in September from 48.2 in August. Any reading above 50 indicates expansion.
"The strong upturn in design activity in the commercial and industrial sector certainly suggests that this upturn can possibly be sustained," said Kermit Baker, AIA's chief economist. "But we will need to see consistent improvement over the next few months in order to feel comfortable about the state of the design and construction industry."The ABI press release is not online yet.
 Click on graph for larger image in new window.
This graph shows the Architecture Billings Index since 1996. This is the first time the index has been above 50 since Jan 2008.
Note: Nonresidential construction includes commercial and industrial facilities like hotels and office buildings, as well as schools, hospitals and other institutions.
According to the AIA, there is an "approximate nine to twelve month lag time between architecture billings and construction spending" on non-residential construction. So, if the index stays at 50 or above, this suggests there will probably be further declines in CRE investment for the next 9 to 12 months.
Thursday, October 14, 2010
Hotel Performance: RevPAR up 8.8% compared to same week in 2009
by Calculated Risk on 10/14/2010 12:43:00 PM
Hotel occupancy is one of several industry specific indicators I follow ...
Important: Even though the occupancy rate is close to 2008 levels, 2010 is a much more difficult year for the hotel industry than 2008. RevPAR (revenue per available room) is up 8.8% compared to 2009, but still down 4.1% compared to 2008 - and 2008 was a very difficult year for the hotel industry.
From HotelNewsNow.com: STR: Economy ADR performance falls short
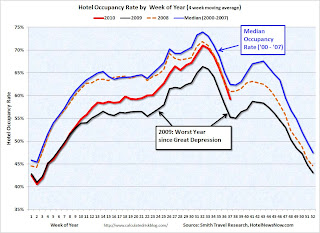
Overall, the industry’s occupancy increased 6.5% to 63.6%, ADR was up 2.2% to US$101.58, and revenue per available room ended the week up 8.8% to US$64.62.The following graph shows the four week moving average for the occupancy rate by week for 2008, 2009 and 2010 (and a median for 2000 through 2007).
 Click on graph for larger image in new window.
Notes: the scale doesn't start at zero to better show the change. The graph shows the 4-week average, not the weekly occupancy rate.
On a 4-week basis, occupancy is up 7.4% compared to last year (the worst year since the Great Depression) and 5.8% below the median for 2000 through 2007.
The occupancy rate is about at the levels of 2008, but RevPAR is still down 4.1%.
Data Source: Smith Travel Research, Courtesy of HotelNewsNow.com
Thursday, October 07, 2010
Reis: Mall vacancy rate declines slightly in Q3
by Calculated Risk on 10/07/2010 02:13:00 AM
 Click on graph for larger image in new window.
From Reuters: U.S. mall vacancy rate dips for first time in 3 years
The national vacancy rate for large regional malls fell to 8.8 percent in the third quarter from 9.0 percent in the second ... Asking rents were unchanged at $38.72 per square foot after declining for seven straight quarters ... At the strip malls ... vacancy was 10.9 percent.At regional malls, the record vacancy rate was 9.0% in Q2 2010 (Reis started tracking regional malls in 2000). The record vacancy rate for strip malls was in 1990 at 11.1%.
"While retail properties were offered a reprieve from massive deterioration, it is too early to say that the market has bottomed," said Victor Calanog, Reis director of research.
Many retailers have long-term leases that expire soon. The weak U.S. economy may prompt retail tenants not to renew, pushing up vacancy again, he said.
Wednesday, October 06, 2010
CoStar: Commercial Real Estate Prices decline in August
by Calculated Risk on 10/06/2010 11:35:00 AM
This is the new repeat sales index for commercial real estate. Previously I've only been using the Moodys/REAL Commercial Property Price Index (CPPI) for commercial real estate.
From CoStar: CoStar Commercial Repeat-Sale Indices
General commercial real estate and the broad-based CoStar composite index for all commercial real estate reversed the positive trend reported in last month’s findings and came in at -3.48% and -1.38% respectively for the month of August. ...
Repeat sales values for investment grade commercial property reversed their negative trend from July and moved positive again with a 3.73% climb in August. We continue to see a significant spread in cap rates and prices from the larger property in prime core markets to the property in second- and third-tier broader markets. Even with tighter financing, there appears to be plenty of institutional and REIT capital oriented to the lower-risk core markets.
For the past three months, all three indices are negative at -3.92% for the broad general index, -3.24% for investment grade and -3.92% for the composite. For the past 12 months, all three indices are down approximately 10% to 11%.
One reason for the volatility of these indices discussed here is the proportion of distress sales, which are continuing to climb in absolute levels, although as a percentage of sales they have leveled since June. This volume of distressed sales, while certainly not a tsunami, is still significant especially among lodging and multifamily properties.
emphasis added
 Click on graph for larger image in new window.
This graph from CoStar shows the indexes for investment grade, general commercial and a composite index. The investment grade index had been increasing since the beginning of the year, but the overall index is still declining.
It is important to remember that there are very few CRE transactions (compared to residential), and that there is a high percentage of distressed sales.
On the number of transactions:
The CCRSI September report is based on sales data through the end of August. In August, 559 sales pairs were recorded.
...
Distress continues to be a significant factor in the index results. Since 2007, the ratio of distressed sales to overall sales has increased from approximately 1% to approximately 23% currently. Discounts on distressed property sales (REOs and short sales) compared to non-distressed sales are running an average of 40% for multifamily, 20% for office and industrial and 17% for retail property based on 2010 data to date.
Tuesday, October 05, 2010
Reis: Apartment Vacancy Rates decline sharply in Q3
by Calculated Risk on 10/05/2010 11:59:00 PM
From Ilaina Jonas at Reuters: US apartment vacancy rate drops sharply in 3rd qtr
The national vacancy rate fell to 7.2 percent from 7.8 percent in the second quarter ...This is a significant decline from record vacancy rate set in Q1 at 7.9%. This decline fits with the recent survey from the NMHC that showed lower apartment vacancies.
Factoring months of free rent and other concessions landlords used to lure tenants, effective rent was up 0.6 percent to $980 per month, Reis said.
It appears the vacancy rate for large apartment buildings (and rents) bottomed early this year. This is something to watch - and indicates the excess housing inventory (that includes both vacant homes and apartments) is being absorbed.
Note: the Reis numbers are for cities. The overall vacancy rate from the Census Bureau was at a near record 10.6% in Q2 2010.
Monday, October 04, 2010
Reis: Office Vacancy Rate at 17 Year High
by Calculated Risk on 10/04/2010 11:59:00 PM
 Click on graph for larger image in new window.
This graph shows the office vacancy rate starting in 1991.
Reis is reporting the vacancy rate rose to 17.5% in Q3 2010, up from 17.4% in Q2 2010, and up from 16.6% in Q3 2009. The peak following the previous recession was 16.9%.
From the WSJ Signs of Recovery For Office Market
[O]ffice buildings in 79 metropolitan areas tracked by Reis lost 1.9 million square feet of occupied space in the third quarter, pushing the national office vacancy rate to 17.5%, the highest level since 1993.It appears the rate of increase in the vacancy rate has slowed - and rents may be stabilizing.
...
Average effective rents ... fell by just a penny in the last three months, the smallest quarterly decline since 2008.
Reis should release the Mall and Apartment vacancy rates over the next few days, and those will probably be at record levels.
Thursday, September 30, 2010
Hotel Occupancy Rate: Slightly below 2008 Levels
by Calculated Risk on 9/30/2010 09:04:00 PM
Hotel occupancy is one of several industry specific indicators I follow ...
From HotelNewsNow.com: STR: Chain scales report strong RevPAR gains
Overall, the U.S. hotel industry rose 7.5% in occupancy to 64.2%, average daily rate was up 2.6% to US$103.09, and RevPAR ended the week up 10.3% to US$66.15.The following graph shows the four week moving average for the occupancy rate by week for 2008, 2009 and 2010 (and a median for 2000 through 2007).
 Click on graph for larger image in new window.
Notes: the scale doesn't start at zero to better show the change. The graph shows the 4-week average, not the weekly occupancy rate.
On a 4-week basis, occupancy is up 6.0% compared to last year (the worst year since the Great Depression) and 5.2% below the median for 2000 through 2007.
The occupancy rate is slightly below the levels of 2008 - and 2008 was a tough year for the hotel industry!
Important: Even though the occupancy rate is close to 2008 levels, 2010 is a much more difficult year. The average daily rate (ADR) is off close to 8% from 2008 levels - so even with the similar occupancy rates, hotel room revenue is off sharply compared to two years ago.
Data Source: Smith Travel Research, Courtesy of HotelNewsNow.com
Thursday, September 23, 2010
Hotel Occupancy Rate: Just below 2008 levels
by Calculated Risk on 9/23/2010 02:03:00 PM
Hotel occupancy is one of several industry specific indicators I follow ...
From HotelNewsNow.com: STR: US hotels back on track in weekly results
Overall, the industry’s occupancy increased 6.7% to 63.5%, average daily rate was up 1.8% to US$100.25, and revenue per available room ended the week up 8.6% to US$63.66.The following graph shows the four week moving average for the occupancy rate by week for 2008, 2009 and 2010 (and a median for 2000 through 2007).
 Click on graph for larger image in new window.
Notes: the scale doesn't start at zero to better show the change. The graph shows the 4-week average, not the weekly occupancy rate.
On a 4-week basis, occupancy is up 6.8% compared to last year (the worst year since the Great Depression) and 5.7% below the median for 2000 through 2007.
The occupancy rate has fallen below the levels of 2008 again - and 2008 was a tough year for the hotel industry!
Important: Even though the occupancy rate is close to 2008 levels, 2010 is a much more difficult year. The average daily rate (ADR) is off more than 10% from 2008 levels - so even with the similar occupancy rates, hotel room revenue is off sharply compared to two years ago.
Data Source: Smith Travel Research, Courtesy of HotelNewsNow.com
Wednesday, September 22, 2010
AIA: Architecture Billings Index shows contraction in August
by Calculated Risk on 9/22/2010 08:30:00 AM
Note: This index is a leading indicator for new Commercial Real Estate (CRE) investment.
Reuters reports that the American Institute of Architects’ Architecture Billings Index increased to 48.2 in August from 47.9 in July. Any reading below 50 indicates contraction.
Project cancellations continue to be the main roadblock to recovery for the construction sector, the group said.The ABI press release is not online yet.
 Click on graph for larger image in new window.
This graph shows the Architecture Billings Index since 1996. The index has remained below 50, indicating falling demand, since January 2008.
Note: Nonresidential construction includes commercial and industrial facilities like hotels and office buildings, as well as schools, hospitals and other institutions.
According to the AIA, there is an "approximate nine to twelve month lag time between architecture billings and construction spending" on non-residential construction. So there will probably be further declines in CRE investment into 2011.
Monday, September 20, 2010
Moody's: Commercial Real Estate Price Index declined 3.1% in July
by Calculated Risk on 9/20/2010 01:08:00 PM
Moody's reported today that the Moody’s/REAL All Property Type Aggregate Index declined 3.1% in July. This is a repeat sales measure of commercial real estate prices.
Below is a comparison of the Moodys/REAL Commercial Property Price Index (CPPI) and the Case-Shiller composite 20 index.
Notes: Beware of the "Real" in the title - this index is not inflation adjusted. Moody's CRE price index is a repeat sales index like Case-Shiller - but there are far fewer commercial sales - and that can impact prices. Click on graph for larger image in new window.
CRE prices only go back to December 2000.
The Case-Shiller Composite 20 residential index is in blue (with Dec 2000 set to 1.0 to line up the indexes).
It is important to remember that the number of transactions is very low and there are a large percentage of distressed sales.
Thursday, September 16, 2010
Hotel Occupancy Rate: "Bumpy Week"
by Calculated Risk on 9/16/2010 01:57:00 PM
Hotel occupancy is one of several industry specific indicators I follow ...
From HotelNewsNow.com: STR: US hotel industry has bumpy week
The U.S. hotel industry reported a decrease in average daily rate ADR for the first time in 13 consecutive weeks for the week of 5-11 September 2010, according to data from STR.The following graph shows the four week moving average for the occupancy rate by week for 2008, 2009 and 2010 (and a median for 2000 through 2007).
ADR fell 2.0% to US$92.84, occupancy increased 2.7% to 54.2%, and revenue per available room ended the week virtually flat with a 0.7% increase to US$50.32.
 Click on graph for larger image in new window.
Notes: the scale doesn't start at zero to better show the change. The graph shows the 4-week average, not the weekly occupancy rate.
On a 4-week basis, occupancy is up 7.2% compared to last year (the worst year since the Great Depression) and 5.1% below the median for 2000 through 2007.
The occupancy rate has fallen below the levels of 2008 again - and 2008 was a tough year for the hotel industry!
Important: Even with the occupancy rate close to 2008 levels, 2010 is a much more difficult year. The average daily rate (ADR) is off 14% from 2008 levels - so even with the similar occupancy rates, hotel room revenue is off sharply.
Data Source: Smith Travel Research, Courtesy of HotelNewsNow.com
Friday, September 10, 2010
Hotel Occupancy Rate: Just above 2008 levels
by Calculated Risk on 9/10/2010 03:08:00 PM
Hotel occupancy is one of several industry specific indicators I follow ...
From HotelNewsNow.com: STR: US hotel results week ending 4 Sept. 2010
In year-over-year comparisons, occupancy increased 7.5 percent to 57.4 percent, average daily rate was up 2.1 percent to US$94.37, and revenue per available room rose 9.7 percent to US$54.16.The following graph shows the four week moving average for the occupancy rate by week for 2008, 2009 and 2010 (and a median for 2000 through 2007).
This was the 13th consecutive week the U.S. reported overall ADR increases. Before this trend emerged, ADR in decreased 74 of the past 76 weeks.
 Click on graph for larger image in new window.
Notes: the scale doesn't start at zero to better show the change. The graph shows the 4-week average, not the weekly occupancy rate.
On a 4-week basis, occupancy is up 8.1% compared to last year (the worst year since the Great Depression) and 3.5% below the median for 2000 through 2007.
The occupancy rate is just above the levels of 2008 - but 2008 was a tough year for the hotel industry!
Data Source: Smith Travel Research, Courtesy of HotelNewsNow.com


