 RSS Feed
 by Calculated Risk on 1/31/2025 07:38:00 PM
Friday, January 31, 2025
January 31st COVID Update: COVID in Wastewater Increasing
 Note: Mortgage rates are from MortgageNewsDaily.com and are for top tier scenarios.
For deaths, I'm currently using 4 weeks ago for "now", since the most recent three weeks will be revised significantly.
Note: "Effective May 1, 2024, hospitals are no longer required to report COVID-19 hospital admissions, hospital capacity, or hospital occupancy data." So I'm no longer tracking hospitalizations.
| COVID Metrics | ||||
|---|---|---|---|---|
| Now | Week Ago | Goal | ||
| Deaths per Week🚩 | 773 | 628 | ≤3501 | |
| 1my goals to stop weekly posts. 🚩 Increasing number weekly for Deaths. ✅ Goal met. | ||||
 Click on graph for larger image.
This graph shows the weekly (columns) number of deaths reported since Jan 2023.
Although weekly deaths met the original goal to stop posting, I'm continuing to post now that deaths are above the goal again - and at a minimum, I'll continue to post through the Winter.
Weekly deaths have been increasing, and weekly deaths are well above the low of 313 in early June 2024.
 This appears to be a leading indicator for COVID hospitalizations and deaths.
Nationally COVID in wastewater is "High" according to the CDC.
Initial Q1 GDP Tracking: Mid-to-high 2% Range
by Calculated Risk on 1/31/2025 02:09:00 PM
From Goldman:
We launched our Q1 GDP tracking estimate at +2.6% (quarter-over-quarter annualized) and our Q1 domestic final sales estimate at +2.3%. We launched our past-quarter GDP tracking estimate at +2.3%, in line with the advance reading. [Jan 31st estimate]And from the Atlanta Fed: GDPNow
emphasis added
The initial GDPNow model estimate for real GDP growth (seasonally adjusted annual rate) in the first quarter of 2025 is 2.9 percent on January 31. The initial estimate of last quarter's real GDP growth rate released by the US Bureau of Economic Analysis on January 30 was 2.3 percent, the same as the final GDPNow model nowcast after rounding. [Jan 31st estimate]
Freddie Mac House Price Index Increased in December; Up 4.0% Year-over-year
by Calculated Risk on 1/31/2025 10:42:00 AM
Today, in the Calculated Risk Real Estate Newsletter: Freddie Mac House Price Index Increased in December; Up 4.0% Year-over-year
A brief excerpt:
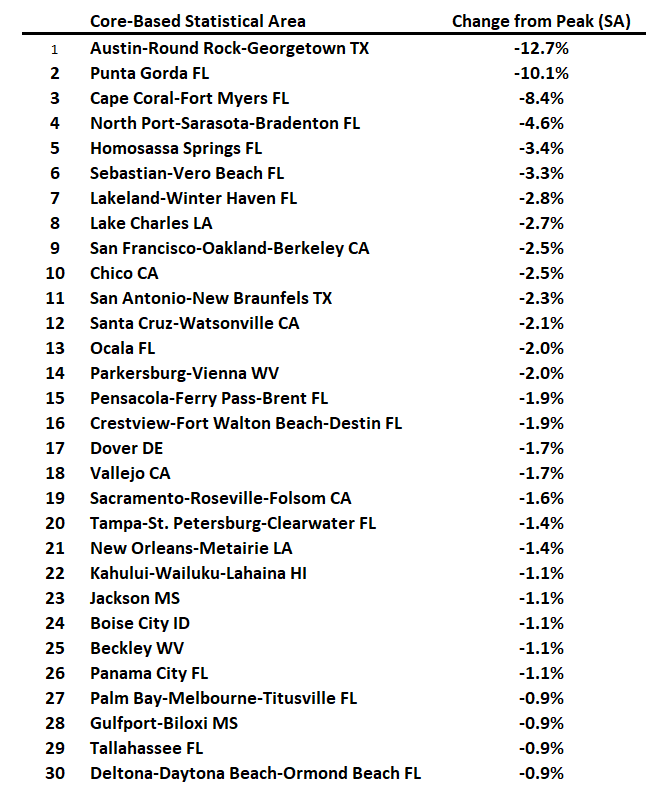
Freddie Mac reported that its “National” Home Price Index (FMHPI) increased 0.54% month-over-month on a seasonally adjusted (SA) basis in December. On a year-over-year basis, the National FMHPI was up 4.0% in December, up from up 3.9% YoY in November. The YoY increase peaked at 19.0% in July 2021, and for this cycle, bottomed at up 0.9% YoY in May 2023. ...There is much more in the article!
For cities (Core-based Statistical Areas, CBSA), here are the 30 cities with the largest declines from the peak, seasonally adjusted. Austin continues to be the worst performing city. However, 6 of the 7 cities with the largest price declines are in Florida (and Florida has 14 of the 30 cities with the largest price declines).
Personal Income increased 0.4% in December; Spending increased 0.7%
by Calculated Risk on 1/31/2025 08:30:00 AM
The BEA released the Personal Income and Outlays report for December:
Personal income increased $92.0 billion (0.4 percent at a monthly rate) in December, according to estimates released today by the U.S. Bureau of Economic Analysis. Disposable personal income (DPI)—personal income less personal current taxes—increased $79.7 billion (0.4 percent) and personal consumption expenditures (PCE) increased $133.6 billion (0.7 percent).The December PCE price index increased 2.6 percent year-over-year (YoY), up from 2.4 percent YoY in November, and down from the recent peak of 7.0 percent in June 2022.
Personal outlays—the sum of PCE, personal interest payments, and personal current transfer payments—increased $129.5 billion in December. Personal saving was $843.2 billion in December and the personal saving rate—personal saving as a percentage of disposable personal income—was 3.8 percent.
emphasis added
The PCE price index, excluding food and energy, increased 2.8 percent YoY, unchanged from 2.8 percent in November, and down from the recent peak of 5.4 percent in February 2022.
The following graph shows real Personal Consumption Expenditures (PCE) through December 2024 (2017 dollars). Note that the y-axis doesn't start at zero to better show the change.
 Click on graph for larger image.
The dashed red lines are the quarterly levels for real PCE.
Personal income was at expectations, and PCE was slightly above expectations.
Inflation was slightly above expectations.
Thursday, January 30, 2025
Friday: Personal Income and Outlays
by Calculated Risk on 1/30/2025 07:30:00 PM
 Note: Mortgage rates are from MortgageNewsDaily.com and are for top tier scenarios.
Friday:
• At 8:30 AM ET, 8:30 AM ET: Personal Income and Outlays for December. The consensus is for a 0.4% increase in personal income, and for a 0.5% increase in personal spending. And for the Core PCE price index to increase 0.2%. PCE prices are expected to be up 2.5% YoY, and core PCE prices up 2.8% YoY.
• At 9:45 AM, Chicago Purchasing Managers Index for January. The consensus is for a reading of 39.7, up from 36.9 in December.
Las Vegas in 2024: Visitor Traffic Up 2.1% YoY; Convention Traffic Unchanged YoY
by Calculated Risk on 1/30/2025 03:59:00 PM
From the Las Vegas Visitor Authority: December 2024 Las Vegas Visitor Statistics
Closing out the year with Dec visitation of 3.4M visitors (+0.2% YoY), Las Vegas hosted approx. 41.7M visitors for the year, up 2.1% from last year’s 40.8M visitors.
With a strong December to end the year, Las Vegas convention attendance reached roughly 6.0M for the year, matching last year's tally.
December occupancy reached 81.9%, up 2.0 pts with ADR and RevPAR seeing YoY increases of +3.7% and +6.3% respectively. For the year, Hotel occupancy landed at 83.6%, just ahead of last year (up 0.1 pts) with annual Weekend occupancy of 90.8% (up 0.1 pts) and annual Midweek occupancy of 80.4%, also up 0.1 pts. Annual ADR reached $193 (+1.0% YoY) with annual RevPAR of $161 (+1.1% YoY).
emphasis added
 Click on graph for larger image.
 The first graph shows visitor traffic for 2019 (Black), 2020 (dark blue), 2021 (light blue), 2022 (light orange), 2023 (dark orange) and 2024 (red).
Visitor traffic was up 0.2% compared to last December. Visitor traffic was down 3.2% compared to December 2019.
Annual visitor traffic was down 2.0% compared to 2019.
The second graph shows convention traffic.

Convention traffic was up 42.7% compared to December 2023, and down 9.1% compared to December 2019. 
Annual convention traffic was down 9.8% compared to 2019.
Final Look at Local Housing Markets in December and a Look Ahead to January Sales
by Calculated Risk on 1/30/2025 12:55:00 PM
Today, in the Calculated Risk Real Estate Newsletter: Final Look at Local Housing Markets in December and a Look Ahead to January Sales
A brief excerpt:
After the National Association of Realtors® (NAR) releases the monthly existing home sales report, I pick up additional local market data that is reported after the NAR. This is the final look at local markets in December.There is much more in the article.
The big story for December was that existing home sales increased year-over-year (YoY) for the third consecutive month following year-over-year declines every month since July 2021. However, sales in December, at 4.24 million on a seasonally adjusted annual rate basis (SAAR) were still historically low. Sales averaged almost 5.4 million SAAR in December 2017, 2018, and 2019. So, sales were still about 21% below pre-pandemic levels.
...
Here is a look at months-of-supply using NSA sales. Since this is NSA data, it is likely this will be the seasonal low for months-of-supply.
Miami is off the charts!
...
More local data coming in February for activity in January!

NAR: Pending Home Sales Decrease 5.5% in December; Down 5.0% Year-over-year
by Calculated Risk on 1/30/2025 10:00:00 AM
From the NAR: Pending Home Sales Fell 5.5% in December
Pending home sales retracted 5.5% in December – following four consecutive months of increases – according to the National Association of REALTORS®. All four U.S. regions experienced month-over-month losses in transactions, with the most significant fall in the West. Year-over-year, contract signings reduced in all four U.S. regions, with the Midwest seeing the largest decrease.Note: Contract signings usually lead sales by about 45 to 60 days, so this would usually be for closed sales in January and February.
The Pending Home Sales Index (PHSI)* – a forward-looking indicator of home sales based on contract signings – slid 5.5% to 74.2 in December. Year-over-year, pending transactions declined 5.0%. Last year’s cyclical low point occurred in July 2024 at 70.2. An index of 100 is equal to the level of contract activity in 2001.
“After four straight months of gains in contract signings, one step back is not welcome news, but it is not entirely surprising,” said NAR Chief Economist Lawrence Yun. “Economic data never moves in a straight line. High mortgage rates have not significantly dented housing demand due to greater numbers of cash transactions.”
...
The Northeast PHSI fell 8.1% from last month to 62.3, down 1.3% from December 2023. The Midwest index shrunk 4.9% to 74.3 in December, down 6.9% from the previous year.
The South PHSI slipped 2.7% to 90.6 in December, down 5.1% from a year ago. The West index tumbled by 10.3% from the prior month to 57.7, down 5.1% from December 2023.
emphasis added
BEA: Real GDP increased at 2.3% Annualized Rate in Q4
by Calculated Risk on 1/30/2025 08:37:00 AM
From the BEA: Gross Domestic Product, 4th Quarter and Year 2024 (Advance Estimate)
Real gross domestic product (GDP) increased at an annual rate of 2.3 percent in the fourth quarter of 2024 (October, November, and December), according to the advance estimate released by the U.S. Bureau of Economic Analysis. In the third quarter, real GDP increased 3.1 percent.PCE increased at a 4.2% annual rate, and residential investment increased at a 5.3% rate. The advance Q4 GDP report, with 2.3% annualized increase, was below expectations.
The increase in real GDP in the fourth quarter primarily reflected increases in consumer spending and government spending that were partly offset by a decrease in investment. Imports, which are a subtraction in the calculation of GDP, decreased.
Compared to the third quarter, the deceleration in real GDP in the fourth quarter primarily reflected downturns in investment and exports. Imports turned down.
The price index for gross domestic purchases increased 2.2 percent in the fourth quarter, compared with an increase of 1.9 percent in the third quarter. The personal consumption expenditures (PCE) price index increased 2.3 percent, compared with an increase of 1.5 percent. Excluding food and energy prices, the PCE price index increased 2.5 percent, compared with an increase of 2.2 percent.
...
Real GDP increased 2.8 percent in 2024 (from the 2023 annual level to the 2024 annual level), compared with an increase of 2.9 percent in 2023. The increase in real GDP in 2024 reflected increases in consumer spending, investment, government spending, and exports. Imports increased.
The price index for gross domestic purchases increased 2.3 percent in 2024, compared with an increase of 3.3 percent in 2023. The PCE price index increased 2.5 percent, compared with an increase of 3.8 percent. Excluding food and energy prices, the PCE price index increased 2.8 percent, compared with an increase of 4.1 percent. emphasis added
I'll have more later ...
Weekly Initial Unemployment Claims Decrease to 207,000
by Calculated Risk on 1/30/2025 08:30:00 AM
The DOL reported:
In the week ending January 25, the advance figure for seasonally adjusted initial claims was 207,000, a decrease of 16,000 from the previous week's unrevised level of 223,000. The 4-week moving average was 212,500, a decrease of 1,000 from the previous week's unrevised average of 213,500.The following graph shows the 4-week moving average of weekly claims since 1971.
emphasis added
 Click on graph for larger image.
The dashed line on the graph is the current 4-week average. The four-week average of weekly unemployment claims decreased to 212,500.
The previous week was unrevised.
Weekly claims were below the consensus forecast.
Wednesday, January 29, 2025
Thursday: GDP, Unemployment Claims, Pending Home Sales
by Calculated Risk on 1/29/2025 08:08:00 PM
 Note: Mortgage rates are from MortgageNewsDaily.com and are for top tier scenarios.
Thursday:
• At 8:30 AM ET, Gross Domestic Product, 4th quarter and Year 2024 (Advance estimate). The consensus is that real GDP increased 2.6% annualized in Q4.
• Also at 8:30 AM, The initial weekly unemployment claims report will be released. The consensus is for a increase to 228 thousand from 223 thousand last week.
• At 10:00 AM, Pending Home Sales Index for December. The consensus is for a 1.0% decrease in the index.
FOMC Statement: No Change to Fed Funds Rate
by Calculated Risk on 1/29/2025 02:00:00 PM
Fed Chair Powell press conference video here or on YouTube here, starting at 2:30 PM ET.
FOMC Statement:
Recent indicators suggest that economic activity has continued to expand at a solid pace. The unemployment rate has stabilized at a low level in recent months, and labor market conditions remain solid. Inflation remains somewhat elevated.
The Committee seeks to achieve maximum employment and inflation at the rate of 2 percent over the longer run. The Committee judges that the risks to achieving its employment and inflation goals are roughly in balance. The economic outlook is uncertain, and the Committee is attentive to the risks to both sides of its dual mandate.
In support of its goals, the Committee decided to maintain the target range for the federal funds rate at 4-1/4 to 4-1/2 percent. In considering the extent and timing of additional adjustments to the target range for the federal funds rate, the Committee will carefully assess incoming data, the evolving outlook, and the balance of risks. The Committee will continue reducing its holdings of Treasury securities and agency debt and agency mortgage‑backed securities. The Committee is strongly committed to supporting maximum employment and returning inflation to its 2 percent objective.
In assessing the appropriate stance of monetary policy, the Committee will continue to monitor the implications of incoming information for the economic outlook. The Committee would be prepared to adjust the stance of monetary policy as appropriate if risks emerge that could impede the attainment of the Committee's goals. The Committee's assessments will take into account a wide range of information, including readings on labor market conditions, inflation pressures and inflation expectations, and financial and international developments.
Voting for the monetary policy action were Jerome H. Powell, Chair; John C. Williams, Vice Chair; Michael S. Barr; Michelle W. Bowman; Susan M. Collins; Lisa D. Cook; Austan D. Goolsbee; Philip N. Jefferson; Adriana D. Kugler; Alberto G. Musalem; Jeffrey R. Schmid; and Christopher J. Waller.
emphasis added
Inflation Adjusted House Prices 1.1% Below 2022 Peak; Price-to-rent index is 7.8% below 2022 peak
by Calculated Risk on 1/29/2025 10:17:00 AM
Today, in the Calculated Risk Real Estate Newsletter: Inflation Adjusted House Prices 1.1% Below 2022 Peak
Excerpt:
It has been over 18 years since the housing bubble peak. In the November Case-Shiller house price index released yesterday, the seasonally adjusted National Index (SA), was reported as being 77% above the bubble peak in 2006. However, in real terms, the National index (SA) is about 12% above the bubble peak (and historically there has been an upward slope to real house prices). The composite 20, in real terms, is 3% above the bubble peak.There is much more in the article!
People usually graph nominal house prices, but it is also important to look at prices in real terms. As an example, if a house price was $300,000 in January 2010, the price would be $436,000 today adjusted for inflation (45% increase). That is why the second graph below is important - this shows "real" prices.
The third graph shows the price-to-rent ratio, and the fourth graph is the affordability index. The last graph shows the 5-year real return based on the Case-Shiller National Index.
...
The second graph shows the same two indexes in real terms (adjusted for inflation using CPI).
In real terms (using CPI), the National index is 1.1% below the recent peak, and the Composite 20 index is 1.3% below the recent peak in 2022. The real National index and the Composite 20 index increased slightly in real terms in November.
It has now been 30 months since the real peak in house prices. Typically, after a sharp increase in prices, it takes a number of years for real prices to reach new highs (see House Prices: 7 Years in Purgatory)

MBA: Mortgage Applications Decreased in Weekly Survey
by Calculated Risk on 1/29/2025 07:00:00 AM
From the MBA: Mortgage Applications Decrease in Latest MBA Weekly Survey
Mortgage applications decreased 2.0 percent from one week earlier, according to data from the Mortgage Bankers Association’s (MBA) Weekly Mortgage Applications Survey for the week ending January 24, 2025. This week’s results include an adjustment for the Martin Luther King holiday.
The Market Composite Index, a measure of mortgage loan application volume, decreased 2.0 percent on a seasonally adjusted basis from one week earlier. On an unadjusted basis, the Index decreased 9 percent compared with the previous week. The Refinance Index decreased 7 percent from the previous week and was 5 percent higher than the same week one year ago. The seasonally adjusted Purchase Index decreased 0.4 percent from one week earlier. The unadjusted Purchase Index decreased 4 percent compared with the previous week and was 7 percent lower than the same week one year ago.
“Mortgage rates were mixed last week, and the 30-year fixed rate remained unchanged at 7.02 percent. Application activity was slightly weaker, primarily because of a 7 percent decline in refinancing across both conventional and government loans,” said Joel Kan, MBA’s Vice President and Deputy Chief Economist. “Purchase activity decreased slightly, but applications for FHA purchase loans were a bright spot, increasing by 2 percent. New and existing-home sales ended 2024 on a strong note, and if mortgage rates continue to stabilize and for-sale inventory loosens, we expect a gradual pick up in purchase activity in the coming months.”
...
The average contract interest rate for 30-year fixed-rate mortgages with conforming loan balances ($766,550 or less) remained unchanged at 7.02 percent, with points increasing to 0.63 from 0.62 (including the origination fee) for 80 percent loan-to-value ratio (LTV) loans.
emphasis added
 Click on graph for larger image.
The first graph shows the MBA mortgage purchase index.
According to the MBA, purchase activity is down 7% year-over-year unadjusted.
Red is a four-week average (blue is weekly).
Purchase application activity is up about 30% from the lows in late October 2023 and is now 8% above the lowest levels during the housing bust.

The second graph shows the refinance index since 1990.
The refinance index is very low.
Tuesday, January 28, 2025
Wednesday: FOMC Statement
by Calculated Risk on 1/28/2025 07:59:00 PM
 Note: Mortgage rates are from MortgageNewsDaily.com and are for top tier scenarios.
Wednesday:
• At 7:00 AM ET, The Mortgage Bankers Association (MBA) will release the mortgage purchase applications index.
• At 2:00 PM, FOMC Meeting Announcement. No change to policy is expected.
• At 2:30 PM, Fed Chair Jerome Powell holds a press briefing following the FOMC announcement.
MBA: Delinquency Rates for Commercial Properties Increased in Fourth-Quarter 2024
by Calculated Risk on 1/28/2025 01:31:00 PM
From the MBA: Delinquency Rates for Commercial Properties Increased in Fourth-Quarter 2024
Delinquency rates for mortgages backed by commercial properties increased during the fourth quarter of 2024, according to the Mortgage Bankers Association's (MBA) latest commercial real estate finance (CREF) Loan Performance Survey.
"The delinquency rate for commercial mortgages increased during the final three months of 2024, with increases across most capital sources and property types,” said Mike Fratantoni, MBA’s SVP and Chief Economist. “The challenges facing different sectors vary – with office properties perhaps facing the most challenging combination of weaker fundamentals and stubbornly high interest rates. However, despite the current conditions, other property types continue to benefit from a relatively strong economy.”
 Click on graph for larger image.
The balance of commercial mortgages that are not current increased slightly in the fourth quarter of 2024.
• The share of loans that were delinquent increased for some property types, particularly office, lodging, retail, and multifamily. Delinquencies decreased for industrial properties.
• Among capital sources, CMBS loan delinquency rates saw the highest levels but were flat during the quarter.
• 5.3% of CMBS loan balances were 30 days or more delinquent, up from 4.8% at the end of last quarter.
• Non-current rates for other capital sources remained more moderate.
• 1.0% of FHA multifamily and health care loan balances were 30 days or more delinquent, up from 0.87% at the end of last quarter.
• 0.86% of life company loan balances were delinquent, down from 0.94%.
• 0.6% of GSE loan balances were delinquent, up from 0.5% the previous quarter.
Newsletter: Case-Shiller: National House Price Index Up 3.8% year-over-year in November
by Calculated Risk on 1/28/2025 10:03:00 AM
Today, in the Calculated Risk Real Estate Newsletter: Case-Shiller: National House Price Index Up 3.8% year-over-year in November
Excerpt:
S&P/Case-Shiller released the monthly Home Price Indices for November ("November" is a 3-month average of September, October and November closing prices). November closing prices include some contracts signed in July, so there is a significant lag to this data. Here is a graph of the month-over-month (MoM) change in the Case-Shiller National Index Seasonally Adjusted (SA).There is much more in the article.
The MoM increase in the seasonally adjusted (SA) Case-Shiller National Index was at 0.44% (a 5.3% annual rate), This was the 22nd consecutive MoM increase in the seasonally adjusted index.
On a seasonally adjusted basis, prices increased month-to-month in 18 of the 20 Case-Shiller cities (prices declined in Seattle and Tampa seasonally adjusted). San Francisco has fallen 6.42% from the recent peak, Phoenix is down 2.1% from the peak, and Denver down 1.7%.

Case-Shiller: National House Price Index Up 3.8% year-over-year in November
by Calculated Risk on 1/28/2025 09:00:00 AM
S&P/Case-Shiller released the monthly Home Price Indices for November ("November" is a 3-month average of September, October and November closing prices).
This release includes prices for 20 individual cities, two composite indices (for 10 cities and 20 cities) and the monthly National index.
From S&P S&P CoreLogic Case-Shiller Index Records 3.8% Annual Gain in November 2024
The S&P CoreLogic Case-Shiller U.S. National Home Price NSA Index, covering all nine U.S. census divisions, reported a 3.8% annual return for November, up from a 3.6% annual gain in the previous month. The 10-City Composite saw an annual increase of 4.9%, recording the same annual increase in the previous month. The 20-City Composite posted a year-over-year increase of 4.3%, up from a 4.2% increase in the previous month. New York again reported the highest annual gain among the 20 cities with a 7.3% increase in November, followed by Chicago and Washington with annual increases of 6.2% and 5.9%, respectively. Tampa posted the lowest return, falling 0.4%.
...
The pre-seasonally adjusted U.S. National, 20-City, and 10-City Composite Indices’ upward trends continued to reverse in November, with a -0.1% drop for the national index, while the 20-City Composite saw a -0.1% decline and the 10-City Composite was unchanged.
After seasonal adjustment, the U.S. National, 20-City, and 10-City Composite Indices all posted a month-over-month increase of 0.4%.
“With the exception of pockets of above-trend performance, national home prices are trending below historical averages,” says Brian D. Luke, CFA, Head of Commodities, Real & Digital Assets. “Markets in New York, Washington, D.C., and Chicago are well above norms, with New York leading the way. Unsurprisingly, the Northeast was the fastest growing region, averaging a 6.1% annual gain. However, markets out west and in once red-hot Florida are trending well below average growth. Tampa’s decline is the first annual drop for any market in over a year. Returns for the Tampa market and entire Southern region rank in the bottom quartile of historical annual gains, with data going back to 1988.
“Despite below-trend growth, our National Index hit its 18th consecutive all-time high on a seasonally adjusted basis,” Luke continued. “Again, with the exception of Tampa, all markets rose monthly with seasonal adjustment. With New York leading the nation for the seventh consecutive month and U.S. banks reporting strong Q4 earnings, this could set the Big Apple up as we close out the year.”
emphasis added
 Click on graph for larger image.
 The first graph shows the nominal seasonally adjusted Composite 10, Composite 20 and National indices (the Composite 20 was started in January 2000).
The Composite 10 index was up 0.4% in November (SA). The Composite 20 index was up 0.4% (SA) in November.
The National index was up 0.4% (SA) in November.
 The second graph shows the year-over-year change in all three indices.
The Composite 10 SA was up 4.9% year-over-year. The Composite 20 SA was up 4.3% year-over-year.
The National index SA was up 3.8% year-over-year.
Annual price changes were close to expectations. I'll have more later.
Monday, January 27, 2025
Tuesday: Durable Goods, Case-Shiller House Prices
by Calculated Risk on 1/27/2025 07:17:00 PM
 From Matthew Graham at Mortgage News Daily: Mortgage Rates Only Moderately Lower After Tech Rout
Even though there is some uncertainty about the near-term Fed rate outlook and even though we have a Fed meeting coming up on Wednesday, today was all about conventional wisdom for interest rates. Tech stocks plummeted on news of a cheap, competent, Chinese AI competitor. ...Tuesday:
Whether investors were simply looking for places to park the proceeds from that stock selling or legitimately betting on economic fallout, bond buying ramped up in a major way. The average mortgage lender is now back in line with the lowest levels since late December, but just barely. [30 year fixed 7.07%]
emphasis added
• At 8:30 AM ET, Durable Goods Orders for December. The consensus is for a 0.8% increase in durable goods.
• Also at 9:00 AM, FHFA House Price Index for November. This was originally a GSE only repeat sales, however there is also an expanded index.
• At 9:00 AM, S&P/Case-Shiller House Price Index for November. The National Index was up 3.6% YoY in October and is expected to be up about the same in November.
• Also at 10:00 AM, Richmond Fed Survey of Manufacturing Activity for January. This is the last of the regional Fed manufacturing surveys for January.
• At 10:00 AM, State Employment and Unemployment (Monthly) for December 2024
Hotels: Occupancy Rate Increased 6.7% Year-over-year
by Calculated Risk on 1/27/2025 02:23:00 PM
On the positive side of the MLK Day calendar shift, the U.S. hotel industry reported positive year-over-year comparisons, according to CoStar’s latest data through 18 January. ...The following graph shows the seasonal pattern for the hotel occupancy rate using the four-week average.
12-18 January 2025 (percentage change from comparable week in 2024):
• Occupancy: 55.8% (+6.7%)
• Average daily rate (ADR): US$155.81 (+10.0%)
• Revenue per available room (RevPAR): US$86.93 (+17.4%)
emphasis added
 Click on graph for larger image.
The red line is for 2025, blue is the median, and dashed light blue is for 2024. Dashed purple is for 2018, the record year for hotel occupancy.
The 4-week average of the occupancy rate is tracking both last year and the median rate for the period 2000 through 2024 (Blue).
Note: Y-axis doesn't start at zero to better show the seasonal change.
This is the weakest period of the year for hotel occupancy and the 4-week average will increase seasonally for the next several months.
Newsletter: New Home Sales Increase to 698,000 Annual Rate in December
by Calculated Risk on 1/27/2025 10:48:00 AM
Today, in the Calculated Risk Real Estate Newsletter: New Home Sales Increase to 698,000 Annual Rate in December
Brief excerpt:
The Census Bureau reported New Home Sales in December were at a seasonally adjusted annual rate (SAAR) of 698 thousand. The previous three months were revised down slightly, combined.There is much more in the article.
...
The next graph shows new home sales for 2023 and 2024 by month (Seasonally Adjusted Annual Rate). Sales in December 2024 were up 6.7% from December 2023.
New home sales, seasonally adjusted, have increased year-over-year in 19 of the last 21 months. This is essentially the opposite of what happened with existing home sales that had been down year-over-year every month for 3+ years (existing home sales have been up year-over-year for the last 3 months).

New Home Sales Increase to 698,000 Annual Rate in December
by Calculated Risk on 1/27/2025 10:00:00 AM
The Census Bureau reports New Home Sales in December were at a seasonally adjusted annual rate (SAAR) of 698 thousand.
The previous three months were revised down slightly, combined.
Sales of new single-family houses in December 2024 were at a seasonally adjusted annual rate of 698,000, according to estimates released jointly today by the U.S. Census Bureau and the Department of Housing and Urban Development. This is 3.6 percent above the revised November rate of 674,000 and is 6.7 percent above the December 2023 estimate of 654,000.
An estimated 683,000 new homes were sold in 2024. This is 2.5 percent above the 2023 figure of 666,000.
emphasis added
 Click on graph for larger image.
The first graph shows New Home Sales vs. recessions since 1963. The dashed line is the current sales rate.
New home sales were at pre-pandemic levels.
The second graph shows New Home Months of Supply.
 The months of supply decreased in December to 8.5 months from 8.7 months in November.
 The all-time record high was 12.2 months of supply in January 2009. The all-time record low was 3.3 months in August 2020.
This is well above the top of the normal range (about 4 to 6 months of supply is normal).
"The seasonally-adjusted estimate of new houses for sale at the end of December was 494,000. This represents a supply of 8.5 months at the current sales rate. "Sales were above expectations of 670 thousand SAAR, however sales for the three previous months were revised down, combined. I'll have more later today.
Housing Jan 27th Weekly Update: Inventory Up 0.7% Week-over-week, Up 26.5% Year-over-year
by Calculated Risk on 1/27/2025 08:11:00 AM
Altos reports that active single-family inventory was up 1.2% week-over-week.
Inventory always declines seasonally in the Winter and usually bottoms in late January or February. If two weeks ago was the seasonal bottom, that would be very early in the year, but that has happened before.
The first graph shows the seasonal pattern for active single-family inventory since 2015.
 Click on graph for larger image.
The red line is for 2024. The black line is for 2019.
Inventory was up 26.5% compared to the same week in 2024 (last week it was up 24.8%), and down 23.0% compared to the same week in 2019 (last week it was down 23.4%).
Back in June 2023, inventory was down almost 54% compared to 2019, so the gap to more normal inventory levels has closed significantly!
 This second inventory graph is courtesy of Altos Research.
As of Jan 24th, inventory was at 637 thousand (7-day average), compared to 632 thousand the prior week.
Mike Simonsen discusses this data regularly on Youtube
Sunday, January 26, 2025
Monday: New Home Sales
by Calculated Risk on 1/26/2025 07:27:00 PM
Weekend:
• Schedule for Week of January 26, 2025
Monday:
• At 8:30 AM ET, Chicago Fed National Activity Index for December. This is a composite index of other data.
• At 10:00 AM, New Home Sales for December from the Census Bureau. The consensus is for 670 thousand SAAR, up from 664 thousand in November.
• At 10:30 AM, Dallas Fed Survey of Manufacturing Activity for January.
From CNBC: Pre-Market Data and Bloomberg futures S&P 500 are down 35 and DOW futures are down 115 (fair value).
Oil prices were up over the last week with WTI futures at $74.66 per barrel and Brent at $78.50 per barrel. A year ago, WTI was at $78, and Brent was at $83 - so WTI oil prices are down about 5% year-over-year.
Here is a graph from Gasbuddy.com for nationwide gasoline prices. Nationally prices are at $3.11 per gallon. A year ago, prices were at $3.11 per gallon, so gasoline prices are unchanged year-over-year.
FOMC Preview: No Change to Policy
by Calculated Risk on 1/26/2025 12:01:00 PM
Most analysts expect no change to FOMC policy at the meeting this week, keeping the target range at 4 1/4 to 4 1/2 percent. Market participants currently expect the FOMC to be on hold at the January, March and May meetings, with the next rate cut in May.
From BofA:
We expect the Fed to stay on hold at its January meeting. The focus will be on the March decision and the Trump agenda. Powell is likely to retain maximal optionality by continuing to stress data dependence and insist that the Fed will not pre-judge or preempt policy.From Goldman:
emphasis added
The January FOMC meeting is unlikely to offer much new information. The statement might note that the labor market appears to have stabilized but is unlikely to provide strong guidance about the March meeting or the timeline for further cuts. ... Our baseline forecast calls for two 25bp cuts this year in June and December and one more in 2026 because we expect inflation to keep falling and do not expect tariffs to restrain the FOMC indefinitely.
Projections will not be released at this meeting. For review, here are the December projections.
The BEA's third estimate for Q3 GDP showed real growth at 3.1% annualized, following 3.0% annualized real growth in Q2, and 1.6% in Q1. Current estimates for Q4 GDP are around 2.6%. That would put real growth in 2024, Q4 over Q4, at 2.6% - above the top end of the December FOMC projections.
| GDP projections of Federal Reserve Governors and Reserve Bank presidents, Change in Real GDP1 | ||||
|---|---|---|---|---|
| Projection Date | 2024 | 2025 | 2026 | 2027 |
| Dec 2024 | 2.4 to 2.5 | 1.8 to 2.2 | 1.9 to 2.1 | 1.8 to 2.0 |
| Sept 2024 | 1.9 to 2.1 | 1.8 to 2.2 | 1.9 to 2.3 | 1.8 to 2.1 |
The unemployment rate was at 4.1% in December and average 4.15% for Q4.
| Unemployment projections of Federal Reserve Governors and Reserve Bank presidents, Unemployment Rate2 | ||||
|---|---|---|---|---|
| Projection Date | 2024 | 2025 | 2026 | 2027 |
| Dec 2024 | 4.2 | 4.2 to 4.5 | 4.1 to 4.4 | 4.0 to 4.4 |
| Sept 2024 | 4.3 to 4.4 | 4.2 to 4.5 | 4.0 to 4.4 | 4.0 to 4.4 |
As of November 2024, PCE inflation increased 2.4 percent year-over-year (YoY). PCE inflation is expected to increase to 2.5% YoY in the December report. This is in the December projection range.
| Inflation projections of Federal Reserve Governors and Reserve Bank presidents, PCE Inflation1 | ||||
|---|---|---|---|---|
| Projection Date | 2024 | 2025 | 2026 | 2027 |
| Dec 2024 | 2.4 to 2.5 | 2.3 to 2.6 | 2.0-2.2 | 2.0 |
| Sept 2024 | 2.2 to 2.4 | 2.1 to 2.2 | 2.0 | 2.0 |
PCE core inflation increased 2.8 percent YoY in November. Core PCE inflation is expected to increase 2.8% YoY in the December report. This is in the range of FOMC projections for Q4.
| Core Inflation projections of Federal Reserve Governors and Reserve Bank presidents, Core Inflation1 | ||||
|---|---|---|---|---|
| Projection Date | 2024 | 2025 | 2026 | 2027 |
| Dec 2024 | 2.8 to 2.9 | 2.5 to 2.7 | 2.0-2.3 | 2.0 |
| Sept 2024 | 2.6 to 2.7 | 2.1 to 2.3 | 2.0 | 2.0 |
Saturday, January 25, 2025
January 25th COVID Update: COVID in Wastewater Decreasing
by Calculated Risk on 1/25/2025 11:31:00 PM
 Note: Mortgage rates are from MortgageNewsDaily.com and are for top tier scenarios.
SPECIAL NOTE: The CDC has stopped releasing health data (hopefully temporarily).
For deaths, I'm currently using 4 weeks ago for "now", since the most recent three weeks will be revised significantly.
Note: "Effective May 1, 2024, hospitals are no longer required to report COVID-19 hospital admissions, hospital capacity, or hospital occupancy data." So I'm no longer tracking hospitalizations.
| COVID Metrics | ||||
|---|---|---|---|---|
| Now | Week Ago | Goal | ||
| Deaths per Week | 518 | 524 | ≤3501 | |
| 1my goals to stop weekly posts. 🚩 Increasing number weekly for Deaths. ✅ Goal met. | ||||
 Click on graph for larger image.
This graph shows the weekly (columns) number of deaths reported since Jan 2020.
Although weekly deaths met the original goal to stop posting, I'm continuing to post now that deaths are above the goal again - and at a minimum, I'll continue to post through the Winter.
Weekly deaths have mostly been declining, however weekly deaths are still above the low of 313 in early June 2024.
 This appears to be a leading indicator for COVID hospitalizations and deaths.
Nationally COVID in wastewater is "Moderate" according to the CDC but is now declining.
Real Estate Newsletter Articles this Week: Existing-Home Sales Increased to 4.24 million SAAR in December
by Calculated Risk on 1/25/2025 02:11:00 PM
At the Calculated Risk Real Estate Newsletter this week:
 Click on graph for larger image.
• NAR: Existing-Home Sales Increased to 4.24 million SAAR in December
• NMHC on Apartments: "Looser market conditions for the tenth consecutive quarter
• 1.73 million Total Housing Completions in 2024 including Manufactured Homes; Most Since 2006
• 4th Look at Local Housing Markets in December
• 3rd Look at Local Housing Markets in December
This is usually published 4 to 6 times a week and provides more in-depth analysis of the housing market.
Schedule for Week of January 26, 2025
by Calculated Risk on 1/25/2025 08:11:00 AM
The key reports scheduled for this week are the advance estimate of Q4 GDP, December New Home sales, December Personal Income and Outlays and November Case-Shiller house prices.
The FOMC meets this week, and no change to policy is expected.
8:30 AM: Chicago Fed National Activity Index for December. This is a composite index of other data.
 10:00 AM: New Home Sales for December from the Census Bureau.
 This graph shows New Home Sales since 1963.
The dashed line is the sales rate for last month.
The consensus is for 670 thousand SAAR, up from 664 thousand in November.
10:30 AM: Dallas Fed Survey of Manufacturing Activity for January.
8:30 AM: Durable Goods Orders for December. The consensus is for a 0.8% increase in durable goods.
9:00 AM: FHFA House Price Index for November. This was originally a GSE only repeat sales, however there is also an expanded index.
 9:00 AM ET: S&P/Case-Shiller House Price Index for November.
This graph shows the Year over year change in the nominal seasonally adjusted National Index, Composite 10 and Composite 20 indexes through the most recent report (the Composite 20 was started in January 2000).
The National Index was up 3.6% YoY in October and is expected to be up about the same in November.
10:00 AM: Richmond Fed Survey of Manufacturing Activity for January. This is the last of the regional Fed manufacturing surveys for January.
10:00 AM: State Employment and Unemployment (Monthly) for December 2024
7:00 AM ET: The Mortgage Bankers Association (MBA) will release the mortgage purchase applications index.
2:00 PM: FOMC Meeting Announcement. No change to policy is expected.
2:30 PM: Fed Chair Jerome Powell holds a press briefing following the FOMC announcement.
8:30 AM: Gross Domestic Product, 4th quarter and Year 2024 (Advance estimate). The consensus is that real GDP increased 2.6% annualized in Q4.
8:30 AM: The initial weekly unemployment claims report will be released. The consensus is for a increase to 228 thousand from 223 thousand last week.
10:00 AM: Pending Home Sales Index for December. The consensus is for a 1.0% decrease in the index.
8:30 AM ET: Personal Income and Outlays for December. The consensus is for a 0.4% increase in personal income, and for a 0.5% increase in personal spending. And for the Core PCE price index to increase 0.2%. PCE prices are expected to be up 2.5% YoY, and core PCE prices up 2.8% YoY.
9:45 AM: Chicago Purchasing Managers Index for January. The consensus is for a reading of 39.7, up from 36.9 in December.
Friday, January 24, 2025
Q4 GDP Tracking: 2.3% to 3.0% Range
by Calculated Risk on 1/24/2025 05:10:00 PM
From BofA:
Since our last weekly publication, our 4Q GDP tracking estimate has moved up two-tenths to 2.3% q/q saar. [Jan 24th estimate]From Goldman:
emphasis added
We left our Q4 GDP tracking and domestic final sales estimates unchanged, each at +2.6% (quarter-over-quarter annualized). [Jan 24th estimate]And from the Atlanta Fed: GDPNow
The GDPNow model estimate for real GDP growth (seasonally adjusted annual rate) in the fourth quarter of 2024 is 3.0 percent on January 17, unchanged from January 16 after rounding. [Jan 17th estimate]
January Vehicle Forecast: Sales Decline to 15.6 million SAAR, Up 4% YoY
by Calculated Risk on 1/24/2025 02:11:00 PM
From WardsAuto: Some Letdown but January U.S. Light-Vehicle Sales Continue Q4-2024's Growth (pay content). Brief excerpt:
While demand in the middle of the month was negatively impacted by extreme weather conditions across most of the country, with a week remaining in January there is upside to the outlook. On the flipside, there could be pause among some consumers, as they wait to see how the apparent revamping of federal policies and institutions by the new administration plays out. Regardless, sales are tracking to their fourth straight increase in January.
emphasis added
 Click on graph for larger image.
This graph shows actual sales from the BEA (Blue), and Wards forecast for January (Red).
On a seasonally adjusted annual rate basis, the Wards forecast of 15.6 million SAAR, would be down 7.1% from last month, and up 3.8% from a year ago.
Newsletter: Existing-Home Sales Increased to 4.24 million SAAR in December
by Calculated Risk on 1/24/2025 10:49:00 AM
Today, in the CalculatedRisk Real Estate Newsletter: NAR: Existing-Home Sales Increased to 4.24 million SAAR in December
Excerpt:
Sales in December (4.24 million SAAR) were up 2.2% from the previous month and were 9.3% above the December 2023 sales rate. This was the third consecutive month with a year-over-year increase after declining YoY every month for over 3 years.There is much more in the article.
...
Sales Year-over-Year and Not Seasonally Adjusted (NSA)
The fourth graph shows existing home sales by month for 2023 and 2024.
Sales increased 9.3% year-over-year compared to December 2023. On an annual basis, existing home sales were at 4.06 million in 2024, down from 4.09 million in 2023, and the lowest level since 1995.

NAR: Existing-Home Sales Increased to 4.24 million SAAR in December
by Calculated Risk on 1/24/2025 10:00:00 AM
From the NAR: Existing-Home Sales Ascended 2.2% in December
Existing-home sales climbed in December, according to the National Association of Realtors®. Sales advanced in three major U.S. regions and slipped in the Midwest. Year-over-year, sales accelerated in all four regions.
On an annual basis, existing-home sales (4.06 million) declined to the lowest level since 1995, while the median price reached a record high of $407,500 in 2024.
Total existing-home sales – completed transactions that include single-family homes, townhomes, condominiums and co-ops – elevated 2.2% from November to a seasonally adjusted annual rate of 4.24 million in December. Year-over-year, sales swelled 9.3% (up from 3.88 million in December 2023).
...
Total housing inventory registered at the end of December was 1.15 million units, down 13.5% from November but up 16.2% from one year ago (990,000). Unsold inventory sits at a 3.3-month supply at the current sales pace, down from 3.8 months in November but up from 3.1 months in December 2023.
emphasis added
Click on graph for larger image.This graph shows existing home sales, on a Seasonally Adjusted Annual Rate (SAAR) basis since 1994.
Sales in December (4.24 million SAAR) were up 2.2% from the previous month and were 9.3% above the December 2023 sales rate. This was the third consecutive year-over-year increase after declining YoY every month for over 3 years.
The second graph shows nationwide inventory for existing homes.
 According to the NAR, inventory decreased to 1.15 million in December from 1.33 million the previous month.
 According to the NAR, inventory decreased to 1.15 million in December from 1.33 million the previous month.
Headline inventory is not seasonally adjusted, and inventory usually decreases to the seasonal lows in December and January, and peaks in mid-to-late summer.
The last graph shows the year-over-year (YoY) change in reported existing home inventory and months-of-supply. Since inventory is not seasonally adjusted, it really helps to look at the YoY change. Note: Months-of-supply is based on the seasonally adjusted sales and not seasonally adjusted inventory.
 Inventory was up 16.2% year-over-year (blue) in December compared to December 2023.
Months of supply (red) decreased to 3.3 months in December from 3.8 months the previous month.
The sales rate was above the consensus forecast. I'll have more later.
The last graph shows the year-over-year (YoY) change in reported existing home inventory and months-of-supply. Since inventory is not seasonally adjusted, it really helps to look at the YoY change. Note: Months-of-supply is based on the seasonally adjusted sales and not seasonally adjusted inventory.
 Inventory was up 16.2% year-over-year (blue) in December compared to December 2023.
 Months of supply (red) decreased to 3.3 months in December from 3.8 months the previous month.
The sales rate was above the consensus forecast. I'll have more later.
LA Ports: Inbound Traffic Increased Sharply Year-over-year in December
by Calculated Risk on 1/24/2025 08:11:00 AM
Container traffic gives us an idea about the volume of goods being exported and imported - and usually some hints about the trade report since LA area ports handle about 40% of the nation's container port traffic.
The following graphs are for inbound and outbound traffic at the ports of Los Angeles and Long Beach in TEUs (TEUs: 20-foot equivalent units or 20-foot-long cargo container).
To remove the strong seasonal component for inbound traffic, the first graph shows the rolling 12-month average.
 Click on graph for larger image.
On a rolling 12-month basis, inbound traffic increased 1.7% in December compared to the rolling 12 months ending in November. Outbound traffic decreased 0.5% compared to the rolling 12 months ending the previous month.
The 2nd graph is the monthly data (with a strong seasonal pattern for imports).
 Usually imports peak in the July to October period as retailers import goods for the Christmas holiday and then decline sharply and bottom in the Winter depending on the timing of the Chinese New Year.
 Usually imports peak in the July to October period as retailers import goods for the Christmas holiday and then decline sharply and bottom in the Winter depending on the timing of the Chinese New Year.
 Imports were up 24% YoY in December, and exports were down 6% YoY.
This was a very strong July through December period as importers were likely stockpiling goods prior to the increase in tariffs.
Thursday, January 23, 2025
Friday: Existing Home Sales
by Calculated Risk on 1/23/2025 08:49:00 PM
 Note: Mortgage rates are from MortgageNewsDaily.com and are for top tier scenarios.
Friday:
• At 10:00 AM ET, Existing Home Sales for December from the National Association of Realtors (NAR). The consensus is for 4.20 million SAAR, up from 4.15 million.
• Also at 10:00 AM, University of Michigan's Consumer sentiment index (Preliminary for January).
Realtor.com Reports Active Inventory Up 25.1% YoY
by Calculated Risk on 1/23/2025 03:51:00 PM
What this means: On a weekly basis, Realtor.com reports the year-over-year change in active inventory and new listings. On a monthly basis, they report total inventory. For December, Realtor.com reported inventory was up 22.0% YoY, but still down 15.7% compared to the 2017 to 2019 same month levels.
Now - on a weekly basis - inventory is up 25.1% YoY.
Realtor.com has monthly and weekly data on the existing home market. Here is their weekly report: Weekly Housing Trends View—Data for Week Ending January 18, 2025 Here is a graph of the year-over-year change in inventory according to realtor.com.
Inventory was up year-over-year for the 63rd consecutive week.
Realtor.com has monthly and weekly data on the existing home market. Here is their weekly report: Weekly Housing Trends View—Data for Week Ending January 18, 2025
• Active inventory increased, with for-sale homes 25.1% above year-ago levels.
For the 63rd consecutive week, the number of homes for sale has increased compared to the same time last year. However, the week’s growth was near levels seen throughout the winter, showing a narrower gap between current and previous year listings compared to last summer.
• New listings–a measure of sellers putting homes up for sale–increased 17.9%.
New listing activity can be bumpy around the holidays as homeowners turn their attention to the season’s festivities. This week brought the highest number of new listings to the market since October suggesting that sellers are ready to get into the market this year. The past two weeks have brought the most new listings so far this winter, getting the year started with a jolt of housing activity.
 Here is a graph of the year-over-year change in inventory according to realtor.com.
 Inventory was up year-over-year for the 63rd consecutive week.
New listings have jumped recently but remain below typical pre-pandemic levels.
4th Look at Local Housing Markets in December
by Calculated Risk on 1/23/2025 12:29:00 PM
Today, in the Calculated Risk Real Estate Newsletter: 4th Look at Local Housing Markets in December
A brief excerpt:
Here are a few more local markets before the NAR releases December Existing Home sales tomorrow, Friday, January 24th at 10:00 AM. This will be the 3rd consecutive month with a year-over-year increase in sales.There is much more in the article.
Watch the regional difference! Inventory is recovering quicker than sales in some areas (especially Florida and Texas), and this is pushing up months-of-supply - and could lead to some price declines in 2025.
The consensus is for 4.20 million SAAR, up from 4.15 million in November. Last year, the NAR reported sales in December 2023 at 3.88 million SAAR. Housing economist Tom Lawler expects the NAR to report sales of 4.15 million SAAR for December.
...
Here is a look at months-of-supply using NSA sales. Since this is NSA data, it is likely this will be the seasonal low for months-of-supply.
...
Several local markets - like Illinois, Miami, New Jersey and New York - will report after the NAR release.

ICE: Mortgage Delinquency Rate Increased 4% Year-over-year in December
by Calculated Risk on 1/23/2025 11:31:00 AM
• The national delinquency rate eased 2 basis points (bps) to 3.72% in December, but rose 4.0% year over year – the seventh consecutive annual increase – ending 2024 near a three-year high
• Early-stage delinquencies fell 41K (-3.6%) in the month, while serious delinquencies (loans 90+ days past due but not in active foreclosure) continued their slow climb – up 29K (+5.7%) in the month and a fifth consecutive rise year over year
• Foreclosure sales declined by 5K (-5.6%) in December, hitting their lowest level in nearly two years, while foreclosure inventory climbed 7K (+3.8%), but was down -10.7% year-over-year
• Despite rising in December on volatility around the holidays, foreclosure starts averaged 26,800 per month in 2024, down from 28,500 in 2023 and lower than any year outside the pandemic moratoria
• Prepayment activity (measured by single-month mortality or SMM) fell to 0.57% on rising interest rates, down -9.8% in the month but up 47.2% from the same time last year
emphasis added
 Click on graph for larger image.
Here is a table from ICE.
Weekly Initial Unemployment Claims Increase to 223,000
by Calculated Risk on 1/23/2025 08:30:00 AM
The DOL reported:
In the week ending January 18, the advance figure for seasonally adjusted initial claims was 223,000, an increase of 6,000 from the previous week's unrevised level of 217,000. The 4-week moving average was 213,500, an increase of 750 from the previous week's unrevised average of 212,750.The following graph shows the 4-week moving average of weekly claims since 1971.
emphasis added
 Click on graph for larger image.
The dashed line on the graph is the current 4-week average. The four-week average of weekly unemployment claims increased to 213,500.
The previous week was unrevised.
Weekly claims were below the consensus forecast.
Wednesday, January 22, 2025
Thursday: Unemployment Claims
by Calculated Risk on 1/22/2025 07:30:00 PM
 Note: Mortgage rates are from MortgageNewsDaily.com and are for top tier scenarios.
Thursday:
• At 8:30 AM ET, The initial weekly unemployment claims report will be released. The consensus is for a increase to 227 thousand from 217 thousand last week.
• At 11:00 AM, the Kansas City Fed manufacturing survey for January.
NMHC on Apartments: "Looser market conditions for the tenth consecutive quarter"
by Calculated Risk on 1/22/2025 12:16:00 PM
Today, in the CalculatedRisk Real Estate Newsletter: NMHC on Apartments: "Looser market conditions for the tenth consecutive quarter"
Excerpt:
From the NMHC: Apartment Market Experiences Loosening Conditions, Decreased Deal Flow and Less Available Financing to Start the New YearThere is much more in the article.Apartment market conditions declined in the National Multifamily Housing Council’s (NMHC’s) most recent Quarterly Survey of Apartment Market Conditions. All four indices – Market Tightness (40), Sales Volume (41), Equity Financing (48) and Debt Financing (32) – came in below the breakeven level (50), signaling less favorable conditions this quarter.This index has been an excellent leading indicator for rents and vacancy rates, and this suggests higher vacancy rates and a further weakness in asking rents. This is the tenth consecutive quarter with looser conditions than the previous quarter.
...• The Market Tightness Index came in at 40 this quarter – below the breakeven level of 50 – indicating looser market conditions for the tenth consecutive quarter. Slightly over half (52%) of respondents thought market conditions were unchanged relative to three months ago, while a third of respondents thought conditions have become looser. Fourteen percent of respondents reported tighter market conditions than three months prior.


