 RSS Feed
 by Calculated Risk on 5/31/2024 07:10:00 PM
Friday, May 31, 2024
May 31st COVID Update: Weekly Deaths at New Pandemic Low!
 Note: Mortgage rates are from MortgageNewsDaily.com and are for top tier scenarios.
For deaths, I'm currently using 4 weeks ago for "now", since the most recent three weeks will be revised significantly.
Note: "Effective May 1, 2024, hospitals are no longer required to report COVID-19 hospital admissions, hospital capacity, or hospital occupancy data." So I'm no longer tracking hospitalizations, however hospitalizations were at a pandemic low three weeks ago.
| COVID Metrics | ||||
|---|---|---|---|---|
| Now | Week Ago | Goal | ||
| Deaths per Week | 378 | 391 | ≤3501 | |
| 1my goals to stop weekly posts, 🚩 Increasing number weekly for Deaths ✅ Goal met. | ||||
 Click on graph for larger image.
This graph shows the weekly (columns) number of deaths reported.
Weekly deaths have declined from the recent peak of 2,561 and are now below the previous pandemic low of 491 last July.
 This appears to be a leading indicator for COVID hospitalizations and deaths.
Nationally, COVID in wastewater is now off about 90% from the holiday peak at the end of December - and also near the lows of last year - and that suggests weekly deaths will continue to decline. However, there was a pickup recently, especially in the West.
Q2 GDP Tracking: 1.8% to 2.8%
by Calculated Risk on 5/31/2024 01:01:00 PM
From BofA:
1Q GDP was revised down by three-tenths to 1.3% q/q saar, which was broadly in line with our expectations. Meanwhile, our estimate of 2Q GDP ended up unchanged at 1.8% q/q saar from a week ago. [May 31st estimate]From Goldman:
emphasis added
The consumption details in this morning’s report indicate weak spending momentum to start the quarter, and we lowered our Q2 GDP tracking estimate by 0.4pp to +2.8% (qoq ar) and our domestic final sales estimate by the same amount to +2.1%. [May 31st estimate]And from the Altanta Fed: GDPNow
The GDPNow model estimate for real GDP growth (seasonally adjusted annual rate) in the second quarter of 2024 is 2.7 percent on May 31, down from 3.5 percent on May 24. After recent releases from the US Census Bureau and the US Bureau of Economic Analysis, a decrease in the nowcast of second-quarter real personal consumption expenditures growth from 3.4 percent to 2.6 percent was partly offset by an increase in the nowcast of second-quarter real gross private domestic investment growth from 5.1 percent to 6.3 percent, while the nowcast of the contribution of the change in real net exports to second-quarter real GDP growth decreased from -0.06 percentage points to -0.60 percentage points. [May 31st estimate]
Fannie and Freddie: Single Family Serious Delinquency Rate Decreased in April, Multi-family Increased Slightly
by Calculated Risk on 5/31/2024 09:48:00 AM
Today, in the Calculated Risk Real Estate Newsletter: Fannie and Freddie: Single Family Serious Delinquency Rate Decreased in April, Multi-family Increased Slightly
Brief excerpt:
Single-family serious delinquencies decreased in April, and multi-family serious delinquencies increased slightly.
...
Freddie Mac reports that the multi-family delinquencies rate increased to 0.35% in April, up from 0.34% in March, and down from 0.44% in January.
This graph shows the Freddie multi-family serious delinquency rate since 2012. Rates were still high in 2012 following the housing bust and financial crisis.
The multi-family rate increased following the pandemic and has increased recently as rent growth has slowed, vacancy rates have increased, and borrowing rates have increased sharply. The rate surged higher in January but declined in February and March. This will be something to watch as more apartments come on the market.

There is much more in the article.
PCE Measure of Shelter Slows to 5.6% YoY in April
by Calculated Risk on 5/31/2024 08:57:00 AM
Here is a graph of the year-over-year change in shelter from the CPI report and housing from the PCE report this morning, both through April 2024.
 CPI Shelter was up 5.5% year-over-year in April, down from 5.6% in March, and down from the cycle peak of 8.2% in March 2023.
Housing (PCE) was up 5.6% YoY in April, down from 5.8% in March, and down from the cycle peak of 8.3% in April 2023.
Since asking rents are mostly flat year-over-year, these measures will continue to slow over the next year.
Since asking rents are mostly flat year-over-year, these measures will continue to slow over the next year.
 The second graph shows PCE prices, Core PCE prices and Core ex-housing over the last 6 months (annualized):
Key measures are above the Fed's target on a 6-month basis. Note: There appears to be some residual seasonality distorting PCE, especially in January.
Personal Income increased 0.3% in April; Spending increased 0.2%
by Calculated Risk on 5/31/2024 08:30:00 AM
The BEA released the Personal Income and Outlays report for April:
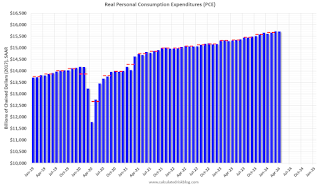
Personal income increased $65.3 billion (0.3 percent at a monthly rate) in April, according to estimates released today by the Bureau of Economic Analysis. Disposable personal income (DPI) —personal income less personal current taxes—increased $40.2 billion and personal consumption expenditures (PCE) increased $39.1 billion.The April PCE price index increased 2.7 percent year-over-year (YoY), unchanged from 2.7 percent YoY in March, and down from the recent peak of 7.0 percent in June 2022.
The PCE price index increased 0.3 percent. Excluding food and energy, the PCE price index increased 0.2 percent. Real DPI decreased 0.1 percent in April and real PCE decreased 0.1 percent; goods decreased 0.4 percent and services increased 0.1 percent.
emphasis added
The PCE price index, excluding food and energy, increased 2.8 percent YoY, unchanged from 2.8 percent in March, and down from the recent peak of 5.4 percent in February 2022.
The following graph shows real Personal Consumption Expenditures (PCE) through April 2024 (2017 dollars). Note that the y-axis doesn't start at zero to better show the change.
 Click on graph for larger image.
The dashed red lines are the quarterly levels for real PCE.
Personal income was at expectations, and PCE was below expectations.
Inflation was at expectations.
Thursday, May 30, 2024
Friday: Personal Income and Outlays
by Calculated Risk on 5/30/2024 08:09:00 PM
 Note: Mortgage rates are from MortgageNewsDaily.com and are for top tier scenarios.
Friday:
• At 8:30 AM ET, Personal Income and Outlays, April 2024. The consensus is for a 0.3% increase in personal income, and for a 0.3% increase in personal spending. And for the Core PCE price index to increase 0.3%. PCE prices are expected to be up 2.7% YoY, and core PCE prices up 2.8% YoY.
• At 9:45 AM, Chicago Purchasing Managers Index for May.
Realtor.com Reports Active Inventory Up 36.5% YoY; Most Homes For Sale Since July 2020
by Calculated Risk on 5/30/2024 02:35:00 PM
What this means: On a weekly basis, Realtor.com reports the year-over-year change in active inventory and new listings. On a monthly basis, they report total inventory. For April, Realtor.com reported inventory was up 30.4% YoY, but still down almost 36% compared to April 2017 to 2019 levels.
Now - on a weekly basis - inventory is up 36.5% YoY.
Realtor.com has monthly and weekly data on the existing home market. Here is their weekly report: Weekly Housing Trends View—Data for Week Ending May 25, 2024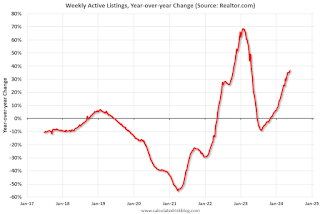 Here is a graph of the year-over-year change in inventory according to realtor.com.
Inventory was up year-over-year for the 29th consecutive week.
Realtor.com has monthly and weekly data on the existing home market. Here is their weekly report: Weekly Housing Trends View—Data for Week Ending May 25, 2024
• Active inventory increased, with for-sale homes 36.5% above year-ago levels.
For the 29th straight week, there were more homes listed for sale versus the prior year, giving homebuyers more options. This past week, the inventory of homes for sale grew by 36.5% compared with last year, and it was the highest since July 2020 in the early days of the COVID-19 Pandemic. This growth in inventory is primarily driven by housing markets in the South, which saw a 43.0% year-over-year increase in inventory in April.
• New listings–a measure of sellers putting homes up for sale–were up this week, by 3.6% from one year ago.
Seller activity continued to climb annually last week but decelerated relative to the previous week’s growth. Newly listed homes grew by 3.6% compared with a year ago, a slowdown from the 8.1% growth rate in the previous week.
 Here is a graph of the year-over-year change in inventory according to realtor.com.
 Inventory was up year-over-year for the 29th consecutive week.
However, inventory is still historically very low.
New listings remain below typical pre-pandemic levels although up year-over-year.
Final Look at Local Housing Markets in April and a Look Ahead to May Sales
by Calculated Risk on 5/30/2024 11:25:00 AM
Today, in the Calculated Risk Real Estate Newsletter: Final Look at Local Housing Markets in April and a Look Ahead to May Sales
A brief excerpt:
In April, sales in these markets were up 7.6% YoY. In March, these same markets were down 10.0% year-over-year Not Seasonally Adjusted (NSA).There is much more in the article.
Sales in most of these markets are down compared to January 2019. Sales in Grand Rapids and Nashville are up compared to 2019.
This is a year-over-year increase NSA for these markets. However, there were two more working days in April 2024 compared to April 2023, so sales Seasonally Adjusted were lower year-over-year than Not Seasonally Adjusted sales.
This was a 7.6% year-over-year decrease NSA for these markets. This is about the same as the 6.8% decline NSA reported by the NAR.
May sales will be mostly for contracts signed in March and April and mortgage rates increased slightly to an average of 6.99% in April. My early expectation is we will see a sales decrease in May on a seasonally adjusted annual rate basis (SAAR) compared to April.
Note for next month (May sales): There were the same number of working days in May 2024 compared to May 2023, so the year-over-year change in the seasonally adjusted sales will be about the same as the NSA data suggests.

NAR: Pending Home Sales Decrease 7.7% in April; Down 7.4% Year-over-year
by Calculated Risk on 5/30/2024 10:00:00 AM
From the NAR: Pending Home Sales Slumped 7.7% in April
Pending home sales in April fell 7.7%, according to the National Association of REALTORS®. All four U.S. regions registered month-over-month and year-over-year decreases.This was well below expectations. Note: Contract signings usually lead sales by about 45 to 60 days, so this would usually be for closed sales in May and June.
The Pending Home Sales Index (PHSI)* – a forward-looking indicator of home sales based on contract signings – decreased to 72.3 in April. Year over year, pending transactions were down 7.4%. An index of 100 is equal to the level of contract activity in 2001.
...
The Northeast PHSI fell 3.5% from last month to 62.9, a decline of 3.1% from April 2023. The Midwest index dropped 9.5% to 70.7 in April, down 8.7% from one year ago.
The South PHSI lowered 7.6% to 88.6 in April, dropping 8.2% from the prior year. The West index decreased 8.5% in April to 55.9, down 7.3% from April 2023.
emphasis added
Q1 GDP Growth Revised Down to 1.3% Annual Rate
by Calculated Risk on 5/30/2024 08:35:00 AM
From the BEA: Gross Domestic Product, First Quarter 2024 (Second Estimate) and Corporate Profits (Preliminary)
Real gross domestic product (GDP) increased at an annual rate of 1.3 percent in the first quarter of 2024, according to the "second" estimate released by the Bureau of Economic Analysis. In the fourth quarter of 2023, real GDP increased 3.4 percent.Here is a Comparison of Second and Advance Estimates. PCE growth was revised down from 2.5% to 2.0%. Residential investment was revised up from 13.9% to 15.4%.
The GDP estimate released today is based on more complete source data than were available for the "advance" estimate issued last month. In the advance estimate, the increase in real GDP was 1.6 percent. The update primarily reflected a downward revision to consumer spending (refer to "Updates to GDP").
The increase in real GDP primarily reflected increases in consumer spending, residential fixed investment, nonresidential fixed investment, and state and local government spending that were partly offset by a decrease in private inventory investment. Imports, which are a subtraction in the calculation of GDP, increased.
emphasis added
Weekly Initial Unemployment Claims Increase to 219,000
by Calculated Risk on 5/30/2024 08:30:00 AM
The DOL reported:
In the week ending May 25, the advance figure for seasonally adjusted initial claims was 219,000, an increase of 3,000 from the previous week's revised level. The previous week's level was revised up by 1,000 from 215,000 to 216,000. The 4-week moving average was 222,500, an increase of 2,500 from the previous week's revised average. The previous week's average was revised up by 250 from 219,750 to 220,000.The following graph shows the 4-week moving average of weekly claims since 1971.
emphasis added
 Click on graph for larger image.
The dashed line on the graph is the current 4-week average. The four-week average of weekly unemployment claims increased to 222,500.
The previous week was revised up.
Weekly claims were higher close to the consensus forecast.
Wednesday, May 29, 2024
Thursday: GDP, Unemployment Claims, Pending Home Sales
by Calculated Risk on 5/29/2024 08:02:00 PM
 Note: Mortgage rates are from MortgageNewsDaily.com and are for top tier scenarios.
Thursday:
• At 8:30 AM ET, The initial weekly unemployment claims report will be released. The consensus is for 218 thousand initial claims, up from 215 thousand last week.
• Also at 8:30 AM, Gross Domestic Product, 1st quarter 2023 (Second estimate). The consensus is that real GDP increased 1.2% annualized in Q1, down from the advance estimate of 1.6%.
• At 10:00 AM, Pending Home Sales Index for April. The consensus is for a 0.6% decrease in the index.
Las Vegas April 2024: Visitor Traffic Up 3.8% YoY; Convention Traffic Up 36%
by Calculated Risk on 5/29/2024 05:00:00 PM
From the Las Vegas Visitor Authority: April 2024 Las Vegas Visitor Statistics
With strength in both leisure and conventions segments, Las Vegas visitation in April exceeded 3.5M, up +3.8% YoY.
Convention attendance saw a YoY increase of 36% related in part to scheduling differences of some shows such as the ISC West ‐ International Security Conference (20K attendees, in Apr 2024 vs. Mar last year) along with new shows including the Google Cloud Next show (30k attendees), the Craft Brewers Conference (12k attendees) and the PZ3 Live Veterinary & Pet Technology Conference (5k attendees).
Even with a larger room count vs. last April, overall hotel occupancy reached 85.5% (up 1.2 pts), with Weekend occupancy of 93.4% (up 1.0 pts) and Midweek occupancy reaching 82.6% (up 1.7 pts) . ADR exceeded $182 while RevPAR approached $156, showing YoY increases of 6.6% and 8.1%, respectively.
emphasis added
 Click on graph for larger image.
 The first graph shows visitor traffic for 2019 (Black), 2020 (dark blue), 2021 (light blue), 2022 (light orange), 2023 (dark orange) and 2024 (red).
Visitor traffic was up 3.8% compared to last April. Visitor traffic was down 0.8% compared to the same month in 2019.
Year-to-date visitor traffic is up 0.7% compared to 2019.
The second graph shows convention traffic.

Convention traffic was up 36.3% compared to April 2023, and down 4.9% compared to April 2019. 
Year-to-date convention traffic is down 8.1% compared to 2019.
FDIC: Number of Problem Banks Increased in Q1 2024
by Calculated Risk on 5/29/2024 01:36:00 PM
The FDIC released the Quarterly Banking Profile for Q1 2024:
Reports from 4,568 commercial banks and savings institutions insured by the Federal Deposit Insurance Corporation (FDIC) report aggregate net income of $64.2 billion in first quarter 2024, an increase of $28.4 billion (79.5 percent) from the prior quarter. A large decline in noninterest expense because of several substantial, non-recurring items recognized by large banks in the prior quarter, as well as higher noninterest income and lower provision expenses this quarter, contributed to the quarterly increase. These and other financial results for first quarter 2024 are included in the FDIC’s latest Quarterly Banking Profile released today.
...
Asset Quality Metrics Remained Generally Favorable With the Exception of Material Deterioration in Credit Card and Commercial Real Estate (CRE) Portfolios: Loans that were 90 days or more past due or in nonaccrual status increased to 0.91 percent of total loans, up five basis points from the prior quarter and 16 basis points from the year-ago quarter. The quarterly increase was led by commercial and industrial loans and non-owner-occupied CRE loans. The noncurrent rate for non-owner occupied CRE loans of 1.59 percent is now at its highest level since fourth quarter 2013, driven by office portfolios at the largest banks. Despite the recent increases, the industry’s total noncurrent ratio remains 37 basis points below the pre-pandemic average of 1.28 percent.
emphasis added
 Click on graph for larger image.
From the FDIC:
The number of banks on the FDIC’s “Problem Bank List” increased from 52 to 63. Total assets held by problem banks rose $15.8 billion to $82.1 billion. Problem banks represent 1.4 percent of total banks, which is within the normal range for non-crisis periods of 1 to 2 percent of all banks.This graph from the FDIC shows the number of problem banks and assets at problem institutions.
Note: The number of assets for problem banks increased significantly back in 2018 when Deutsche Bank Trust Company Americas was added to the list. An even larger unknown bank was added to the list in Q4 2021, however that bank is now off the problem list.
It appears the recent increase in problem banks is related to office CRE loans.
Inflation Adjusted House Prices 2.2% Below Peak; Price-to-rent index is 7.5% below 2022 peak
by Calculated Risk on 5/29/2024 10:34:00 AM
Today, in the Calculated Risk Real Estate Newsletter: Inflation Adjusted House Prices 2.2% Below Peak
Excerpt:
It has been 18 years since the bubble peak. In the March Case-Shiller house price index released on Tuesday, the seasonally adjusted National Index (SA), was reported as being 72% above the bubble peak in 2006. However, in real terms, the National index (SA) is about 10% above the bubble peak (and historically there has been an upward slope to real house prices). The composite 20, in real terms, is 1% above the bubble peak.
People usually graph nominal house prices, but it is also important to look at prices in real terms. As an example, if a house price was $300,000 in January 2010, the price would be $431,000 today adjusted for inflation (44% increase). That is why the second graph below is important - this shows "real" prices.
The third graph shows the price-to-rent ratio, and the fourth graph is the affordability index. The last graph shows the 5-year real return based on the Case-Shiller National Index.
...
The second graph shows the same two indexes in real terms (adjusted for inflation using CPI).
In real terms (using CPI), the National index is 2.2% below the recent peak, and the Composite 20 index is 3.1% below the recent peak in 2022. Both indexes declined slightly in March in real terms.

There is much more in the article.
MBA: Mortgage Applications Decreased in Weekly Survey
by Calculated Risk on 5/29/2024 07:00:00 AM
From the MBA: Mortgage Applications Decrease in Latest MBA Weekly Survey
Mortgage applications decreased 5.7 percent from one week earlier, according to data from the Mortgage Bankers Association’s (MBA) Weekly Mortgage Applications Survey for the week ending May 24, 2024.
The Market Composite Index, a measure of mortgage loan application volume, decreased 5.7 percent on a seasonally adjusted basis from one week earlier. On an unadjusted basis, the Index decreased 6.3 percent compared with the previous week. The Refinance Index decreased 14 percent from the previous week and was 12 percent higher than the same week one year ago. The seasonally adjusted Purchase Index decreased 1 percent from one week earlier. The unadjusted Purchase Index decreased 3 percent compared with the previous week and was 10 percent lower than the same week one year ago.
“Mortgage rates increased for the first time in four weeks, with the 30-year fixed rate up to 7.05 percent and all other loan types also seeing increases. The uptick in rates led to a decline in mortgage applications heading into Memorial Day weekend,” said Joel Kan, MBA’s Vice President and Deputy Chief Economist. “Both purchase and refinance applications fell, pushing overall activity to the lowest level since early March. Borrowers remain sensitive to small increases in rates, impacting the refinance market and keeping purchase applications below last year’s levels. There continues to be limited levels of existing homes for sale and many buyers are struggling to find listings in their price range that meet their needs.”
...
The average contract interest rate for 30-year fixed-rate mortgages with conforming loan balances ($766,550 or less) increased to 7.05 percent from 7.01 percent, with points increasing to 0.63 from 0.60 (including the origination fee) for 80 percent loan-to-value ratio (LTV) loans.
emphasis added
 Click on graph for larger image.
The first graph shows the MBA mortgage purchase index.
According to the MBA, purchase activity is down 10% year-over-year unadjusted.
Red is a four-week average (blue is weekly).
Purchase application activity is up slightly from the lows in late October 2023, and below the lowest levels during the housing bust.

The second graph shows the refinance index since 1990.
With higher mortgage rates, the refinance index declined sharply in 2022, and mostly flat lined since then with a slight increase recently.
Tuesday, May 28, 2024
Wednesday: Beige Book, Richmond Fed Mfg
by Calculated Risk on 5/28/2024 07:12:00 PM
 Note: Mortgage rates are from MortgageNewsDaily.com and are for top tier scenarios.
Wednesday:
• At 7:00 AM ET, The Mortgage Bankers Association (MBA) will release the results for the mortgage purchase applications index.
• At 10:00 AM, Richmond Fed Survey of Manufacturing Activity for May.
• At 2:00 PM, the Federal Reserve Beige Book, an informal review by the Federal Reserve Banks of current economic conditions in their Districts.
A few comments on the Seasonal Pattern for House Prices
by Calculated Risk on 5/28/2024 01:35:00 PM
Two key points:
1) There is a clear seasonal pattern for house prices.
2) The surge in distressed sales during the housing bust distorted the seasonal pattern. This was because distressed sales (at lower price points) happened at a steady rate all year, while regular sales followed the normal seasonal pattern. This made for larger swings in the seasonal factor during the housing bust.
 Click on graph for larger image.
This graph shows the month-to-month change in the NSA Case-Shiller National index since 1987 (through March 2024). The seasonal pattern was smaller back in the '90s and early '00s and increased once the bubble burst.
The seasonal swings declined following the bust, however the pandemic price surge changed the month-over-month pattern.
 The second graph shows the seasonal factors for the Case-Shiller National index since 1987. The factors started to change near the peak of the bubble, and really increased during the bust since normal sales followed the regular seasonal pattern - and distressed sales happened all year.
The swings in the seasonal factors were decreasing following the bust but have increased again recently - this time without a surge in distressed sales.
If we use the seasonal factors from 2018 and 2019, house prices were up 0.8% in Q1 (compared to the current factors with prices up 1.2% in Q1).
Comments on March House Prices, FHFA: House Prices Increased 0.1% in March
by Calculated Risk on 5/28/2024 09:50:00 AM
Today, in the Calculated Risk Real Estate Newsletter: Case-Shiller: National House Price Index Up 6.5% year-over-year in March; FHFA: House Prices Increased 0.1% in March, up 6.6% YoY
Excerpt:
S&P/Case-Shiller released the monthly Home Price Indices for March ("March" is a 3-month average of January, February and March closing prices). March closing prices include some contracts signed in November, so there is a significant lag to this data. Here is a graph of the month-over-month (MoM) change in the Case-Shiller National Index Seasonally Adjusted (SA).
The MoM increase in the seasonally adjusted (SA) Case-Shiller National Index was at 0.30%. This was the fourteenth consecutive MoM increase, but a smaller MoM increase than the previous two months.
On a seasonally adjusted basis, prices increased month-to-month in 15 of the 20 Case-Shiller cities. Seasonally adjusted, San Francisco has fallen 8.2% from the recent peak, Seattle is down 6.0% from the peak, Portland down 4.0%, and Phoenix is down 3.1%.

There is much more in the article.
Case-Shiller: National House Price Index Up 6.5% year-over-year in March
by Calculated Risk on 5/28/2024 09:00:00 AM
S&P/Case-Shiller released the monthly Home Price Indices for March ("March" is a 3-month average of January, February and March closing prices).
This release includes prices for 20 individual cities, two composite indices (for 10 cities and 20 cities) and the monthly National index.
From S&P S&P CoreLogic Case-Shiller Index Hits New All-Time High in March 2024
The S&P CoreLogic Case-Shiller U.S. National Home Price NSA Index, covering all nine U.S. census divisions, reported a 6.5% annual gain for March, the same increase as the previous month. The 10- City Composite saw an increase of 8.2%, up from a 8.1% increase in the previous month. The 20-City Composite posted a slight year-over-year increase to 7.4%, up from a 7.3% increase in the previous month. San Diego continued to report the highest year-over-year gain among the 20 cities this month with an 11.1% increase in March, followed by New York and Cleveland, with increases of 9.2% and 8.8%, respectively. Portland, which still holds the lowest rank after reporting three consecutive months of the smallest year-over-year growth, posted the same 2.2% annual increase in March as the previous month.
...
The U.S. National Index, the 20-City Composite, and the 10-City Composite all continued their upward trend from last month, showing pre-seasonality adjustment increases of 1.3%, 1.6% and 1.6%, respectively.
After seasonal adjustment, the U.S. National Index posted a month-over-month increase of 0. 3%, while the 20-City and the 10-City Composite both reported month-over-month increases of 0.3% and 0.5%, respectively.
“This month’s report boasts another all-time high,” says Brian D. Luke, Head of Commodities, Real & Digital Assets at S&P Dow Jones Indices. “We’ve witnessed records repeatedly break in both stock and housing markets over the past year. Our National Index has reached new highs in six of the last 12 months. During that time, we’ve seen record stock market performance, with the S&P 500 hitting fresh all-time highs for 35 trading days in the past year.
“San Diego stands out with an impressive 11.1% annual gain, followed closely by New York, Cleveland, and Los Angeles, indicating a strong demand for urban markets."
emphasis added
 Click on graph for larger image.
 The first graph shows the nominal seasonally adjusted Composite 10, Composite 20 and National indices (the Composite 20 was started in January 2000).
The Composite 10 index was up 0.5% in March (SA). The Composite 20 index was up 0.3% (SA) in March.
The National index was up 0.3% (SA) in March.
 The second graph shows the year-over-year change in all three indices.
The Composite 10 SA was up 8.2% year-over-year. The Composite 20 SA was up 7.4% year-over-year.
The National index SA was up 6.5% year-over-year.
Annual price changes were close to expectations. I'll have more later.
Monday, May 27, 2024
Tuesday: Case-Shiller House Prices
by Calculated Risk on 5/27/2024 06:10:00 PM
Weekend:
• Schedule for Week of May 26, 2024
Tuesday:
• At 9:00 AM ET, S&P/Case-Shiller House Price Index for March. The consensus is for the Case-Shiller National Index to increase 6.8% YoY, up from 6.4% YoY in February.
• Also at 9:00 AM, FHFA House Price Index for March. This was originally a GSE only repeat sales, however there is also an expanded index.
• At 10:00 AM, Dallas Fed Survey of Manufacturing Activity for May.
From CNBC: Pre-Market Data and Bloomberg futures S&P 500 are up 11 and DOW futures are up 51 (fair value).
Oil prices were down over the last week with WTI futures at $78.38 per barrel and Brent at $82.79 per barrel. A year ago, WTI was at $72, and Brent was at $76 - so WTI oil prices are up about 9% year-over-year.
Here is a graph from Gasbuddy.com for nationwide gasoline prices. Nationally prices are at $3.55 per gallon. A year ago, prices were at $3.55 per gallon, so gasoline prices are unchanged year-over-year.
Housing May 27th Weekly Update: Inventory up 2.9% Week-over-week, Up 37.0% Year-over-year
by Calculated Risk on 5/27/2024 09:21:00 AM
Altos reports that active single-family inventory was up 2.9% week-over-week. Inventory is now up 20.3% from the February bottom, and at the highest level since August 2020.
 Click on graph for larger image.
This inventory graph is courtesy of Altos Research.
As of May 24th, inventory was at 595 thousand (7-day average), compared to 578 thousand the prior week.
Inventory is still far below pre-pandemic levels.

The red line is for 2024. The black line is for 2019. Note that inventory is up 84% from the record low for the same week in 2021, but still well below normal levels.
Inventory was up 37.0% compared to the same week in 2023 (last week it was up 36.0%), and down 36.1% compared to the same week in 2019 (last week it was down 36.4%).
Back in June 2023, inventory was down almost 54% compared to 2019, so the gap to more normal inventory levels is slowly closing.
Mike Simonsen discusses this data regularly on Youtube.
Sunday, May 26, 2024
TSA: Airline Travel about 12% Above 2019 Levels to New Record High
by Calculated Risk on 5/26/2024 08:21:00 AM
The TSA is providing daily travel numbers.
This data is as of May 24th.
 Click on graph for larger image.
This data shows the 7-day average of daily total traveler throughput from the TSA (Blue).
The red line is the percent of 2019 for the seven-day average.
Air travel - as a percent of 2019 - is tracking at about 112% of pre-pandemic levels.
Saturday, May 25, 2024
Real Estate Newsletter Articles this Week: New Home Sales Decrease to 634,000 Annual Rate in April
by Calculated Risk on 5/25/2024 02:11:00 PM
At the Calculated Risk Real Estate Newsletter this week:
 Click on graph for larger image.
• New Home Sales Decrease to 634,000 Annual Rate in April
• NAR: Existing-Home Sales Decreased to 4.14 million SAAR in April
• Watch Months-of-Supply!
• Single Family Built-for-Rent Up 20% Year-over-year in Q1
• 4th Look at Local Housing Markets in April; California Home Sales Up 4.4% YoY in April
This is usually published 4 to 6 times a week and provides more in-depth analysis of the housing market.
Schedule for Week of May 26, 2024
by Calculated Risk on 5/25/2024 08:11:00 AM
The key reports this week are the second estimate of Q1 GDP, March Case-Shiller house prices, and Personal Income and Outlays for April.
For manufacturing, the May Richmond and Dallas Fed manufacturing surveys will be released.
All US markets will be closed in observance of Memorial Day.
 9:00 AM: S&P/Case-Shiller House Price Index for March. The consensus is for the Case-Shiller National Index to increase 6.8% YoY, up from 6.4% YoY in February.
This graph shows the year-over-year change in the seasonally adjusted National Index, Composite 10 and Composite 20 indexes through the most recent report (the Composite 20 was started in January 2000).
9:00 AM: FHFA House Price Index for March. This was originally a GSE only repeat sales, however there is also an expanded index.
10:00 AM: Dallas Fed Survey of Manufacturing Activity for May.
7:00 AM ET: The Mortgage Bankers Association (MBA) will release the results for the mortgage purchase applications index.
10:00 AM: Richmond Fed Survey of Manufacturing Activity for May.
2:00 PM: the Federal Reserve Beige Book, an informal review by the Federal Reserve Banks of current economic conditions in their Districts.
8:30 AM: The initial weekly unemployment claims report will be released. The consensus is for 218 thousand initial claims, up from 215 thousand last week.
8:30 AM: Gross Domestic Product, 1st quarter 2023 (Second estimate). The consensus is that real GDP increased 1.2% annualized in Q1, down from the advance estimate of 1.6%.
10:00 AM: Pending Home Sales Index for April. The consensus is for a 0.6% decrease in the index.
8:30 AM ET: Personal Income and Outlays, April 2024. The consensus is for a 0.3% increase in personal income, and for a 0.3% increase in personal spending. And for the Core PCE price index to increase 0.3%. PCE prices are expected to be up 2.7% YoY, and core PCE prices up 2.8% YoY.
9:45 AM: Chicago Purchasing Managers Index for May.
Friday, May 24, 2024
May 24th COVID Update: Weekly Deaths at New Pandemic Low!
by Calculated Risk on 5/24/2024 07:11:00 PM
 Note: Mortgage rates are from MortgageNewsDaily.com and are for top tier scenarios.
For deaths, I'm currently using 4 weeks ago for "now", since the most recent three weeks will be revised significantly.
Note: "Effective May 1, 2024, hospitals are no longer required to report COVID-19 hospital admissions, hospital capacity, or hospital occupancy data." So I'm no longer tracking hospitalizations, however hospitalizations were at a pandemic low three weeks ago.
| COVID Metrics | ||||
|---|---|---|---|---|
| Now | Week Ago | Goal | ||
| Deaths per Week | 374 | 471 | ≤3501 | |
| 1my goals to stop weekly posts, 🚩 Increasing number weekly for Deaths ✅ Goal met. | ||||
 Click on graph for larger image.
This graph shows the weekly (columns) number of deaths reported.
Weekly deaths have declined from the recent peak of 2,561 and are now below the previous pandemic low of 491 last July.
 This appears to be a leading indicator for COVID hospitalizations and deaths.
Nationally, COVID in wastewater is now off more than 90% from the holiday peak at the end of December - and also near the lows of last year - and that suggests weekly deaths will continue to decline. However, there was a slight uptick recently, especially in the West.
Q2 GDP Tracking: 1.8% to 3.5%
by Calculated Risk on 5/24/2024 02:21:00 PM
From BofA:
2Q GDP tracking is down a tenth to 1.8% q/q saar. Also, we expect the second print of 1Q GDP to be revised down to 1.2% from 1.6%. [May 24th estimate]From Goldman:
emphasis added
We boosted our Q2 GDP tracking estimate by 0.1pp to +3.2% (qoq ar) and our domestic final sales estimate by the same amount to +2.5%. [May 24th estimate]And from the Altanta Fed: GDPNow
The GDPNow model estimate for real GDP growth (seasonally adjusted annual rate) in the second quarter of 2024 is 3.5 percent on May 24, down from 3.6 percent on May 16. After recent releases from the US Census Bureau and the National Association of Realtors, the nowcast of second-quarter real gross private domestic investment growth decreased from 5.6 percent to 5.1 percent. [May 24th estimate]
Watch Months-of-Supply!
by Calculated Risk on 5/24/2024 11:16:00 AM
Today, in the Calculated Risk Real Estate Newsletter: Watch Months-of-Supply!
A brief excerpt:
Although inventory is well below normal levels, so are sales. I think we need to keep an eye on months-of-supply. Historically nominal prices declined when months-of-supply approached 6 months - and that is unlikely this year - but we could see months-of-supply back to 2019 levels later this year.There is much more in the article.
What would it take to get months-of-supply back to 2019 levels by mid-year? The following table is a simple exercise. If sales stay depressed at 2023 levels, how much would inventory have to increase to put months-of-supply at 2019 levels?
Hotels: Occupancy Rate Increased 0.2% Year-over-year
by Calculated Risk on 5/24/2024 11:01:00 AM
The U.S. hotel industry reported higher performance from the previous week and positive comparisons year over year, according to CoStar’s latest data through 18 May. ...The following graph shows the seasonal pattern for the hotel occupancy rate using the four-week average.
12-18 May 2024 (percentage change from comparable week in 2023):
• Occupancy: 67.4% (+0.2%)
• Average daily rate (ADR): US$163.11 (+2.6%)
• Revenue per available room (RevPAR): US$109.93 (+2.8%)
emphasis added
 Click on graph for larger image.
The red line is for 2024, black is 2020, blue is the median, and dashed light blue is for 2023. Dashed purple is for 2018, the record year for hotel occupancy.
The 4-week average of the occupancy rate is tracking last year, and slightly above the median rate for the period 2000 through 2023 (Blue).
Note: Y-axis doesn't start at zero to better show the seasonal change.
The 4-week average of the occupancy rate will increase seasonally when the summer travel season begins.
May Vehicle Sales Forecast: 15.8 million SAAR, Up 2% YoY
by Calculated Risk on 5/24/2024 08:12:00 AM
From WardsAuto: May U.S. Light-Vehicle Sales Tracking to Annualized Rate Flat with April (pay content). Brief excerpt:
There is a good possibility sales end May above expectations, depending on much holiday marketing pulls in additional buyers. Second-quarter sales are pegged at a 15.9 million-unit SAAR, with volume rising 1% from the year-ago period.
emphasis added
 Click on graph for larger image.
This graph shows actual sales from the BEA (Blue), and Wards forecast for May (Red).
On a seasonally adjusted annual rate basis, the Wards forecast of 15.8 million SAAR, would be up 0.4% from last month, and up 1.8% from a year ago.
Thursday, May 23, 2024
Friday: Durable Goods
by Calculated Risk on 5/23/2024 07:09:00 PM
 Note: Mortgage rates are from MortgageNewsDaily.com and are for top tier scenarios.
Friday:
• At 8:30 AM ET, Durable Goods Orders for April from the Census Bureau. The consensus is for a 0.6% decrease in durable goods orders.
• At 10:00 AM, University of Michigan's Consumer sentiment index (Final for May). The consensus is for a reading of 67.4.
Realtor.com Reports Active Inventory Up 35.5% YoY; Most Homes For Sale Since July 2020
by Calculated Risk on 5/23/2024 04:15:00 PM
What this means: On a weekly basis, Realtor.com reports the year-over-year change in active inventory and new listings. On a monthly basis, they report total inventory. For April, Realtor.com reported inventory was up 30.4% YoY, but still down almost 36% compared to April 2017 to 2019 levels.
Now - on a weekly basis - inventory is up 35.5% YoY.
Realtor.com has monthly and weekly data on the existing home market. Here is their weekly report: Weekly Housing Trends View—Data for Week Ending May 18, 2024 Here is a graph of the year-over-year change in inventory according to realtor.com.
Inventory was up year-over-year for the 28th consecutive week.
Realtor.com has monthly and weekly data on the existing home market. Here is their weekly report: Weekly Housing Trends View—Data for Week Ending May 18, 2024
• Active inventory increased, with for-sale homes 35.5% above year-ago levels
For the 28th straight week, there were more homes listed for sale versus the prior year, giving homebuyers more options.
This past week, the inventory of homes for sale grew by 35.5% compared with last year, and it was the highest since July 2020 in the early days of the COVID-19 Pandemic. This growth in inventory is primarily driven by housing markets in the South, which saw a 43.0% year-over-year increase in inventory in April.
• New listings–a measure of sellers putting homes up for sale–were up this week, by 8.1% from one year ago.
Seller activity continued to climb annually last week and accelerated relative to the previous week’s growth. Newly listed homes grew by 8.1% compared with a year ago, an acceleration from the 6.6% growth rate in the previous week.
 Here is a graph of the year-over-year change in inventory according to realtor.com.
 Inventory was up year-over-year for the 28th consecutive week.
However, inventory is still historically very low.
New listings remain below typical pre-pandemic levels although up year-over-year.
New Home Sales Decrease to 634,000 Annual Rate in April
by Calculated Risk on 5/23/2024 01:55:00 PM
Today, in the Calculated Risk Real Estate Newsletter: New Home Sales Decrease to 634,000 Annual Rate in April
Brief excerpt:
Note: there were some seasonal revisions back to 2019, and significant changes to house prices and price distribution in this release.There is much more in the article.
The Census Bureau reports New Home Sales in April were at a seasonally adjusted annual rate (SAAR) of 634 thousand. The previous three months were revised down.
...
The next graph shows new home sales for 2023 and 2024 by month (Seasonally Adjusted Annual Rate). Sales in April 2024 were down 6.6% from April 2023.

New Home Sales Decrease to 634,000 Annual Rate in April
by Calculated Risk on 5/23/2024 10:00:00 AM
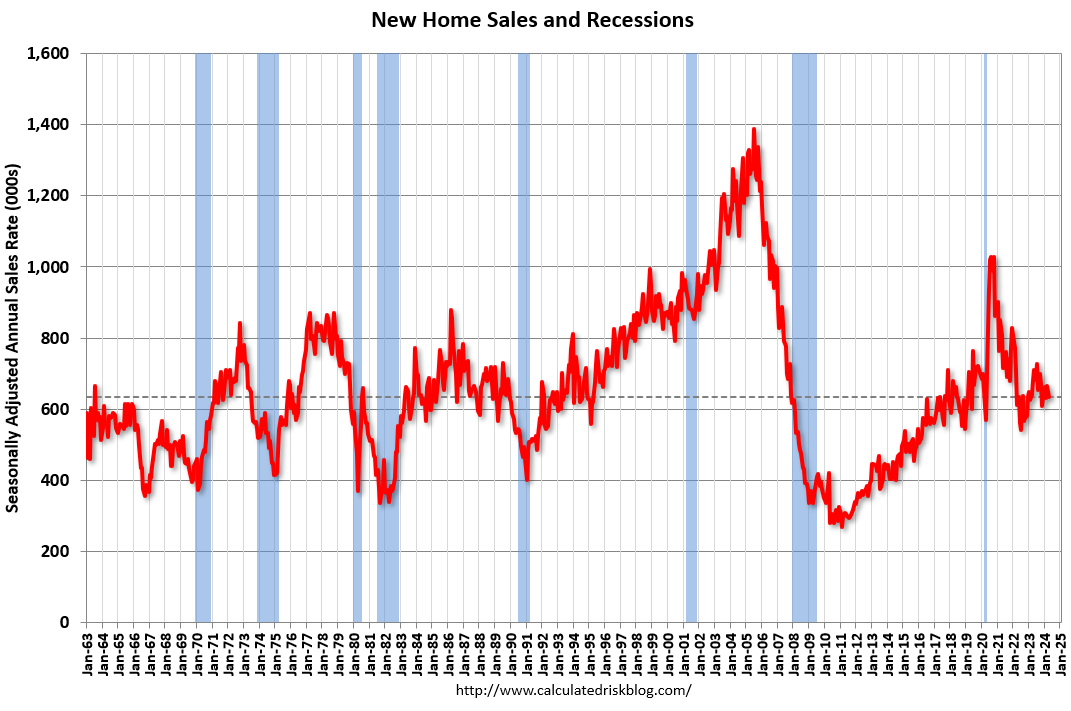
The Census Bureau reports New Home Sales in April were at a seasonally adjusted annual rate (SAAR) of 634 thousand.
The previous three months were revised down.
Sales of new single‐family houses in April 2024 were at a seasonally adjusted annual rate of 634,000, according to estimates released jointly today by the U.S. Census Bureau and the Department of Housing and Urban Development. This is 4.7 percent below the revised March rate of 665,000 and is 7.7 percent below the April 2023 estimate of 687,000.
emphasis added
Click on graph for larger image.The first graph shows New Home Sales vs. recessions since 1963. The dashed line is the current sales rate.
New home sales were close to pre-pandemic levels.
The second graph shows New Home Months of Supply.
 The months of supply increased in April to 9.1 months from 8.5 months in March.
 The all-time record high was 12.2 months of supply in January 2009. The all-time record low was 3.3 months in August 2020.
This is well above the top of the normal range (about 4 to 6 months of supply is normal).
"The seasonally‐adjusted estimate of new houses for sale at the end of April was 480,000. This represents a supply of 9.1 months at the current sales rate."Sales were well below expectations of 680 thousand SAAR, and sales for the three previous months were revised down. I'll have more later today.
Weekly Initial Unemployment Claims Decrease to 215,000
by Calculated Risk on 5/23/2024 08:30:00 AM
The DOL reported:
In the week ending May 18, the advance figure for seasonally adjusted initial claims was 215,000, a decrease of 8,000 from the previous week's revised level. The previous week's level was revised up by 1,000 from 222,000 to 223,000. The 4-week moving average was 219,750, an increase of 1,750 from the previous week's revised average. The previous week's average was revised up by 250 from 217,750 to 218,000.The following graph shows the 4-week moving average of weekly claims since 1971.
emphasis added
 Click on graph for larger image.
The dashed line on the graph is the current 4-week average. The four-week average of weekly unemployment claims increased to 219,750.
The previous week was revised up.
Weekly claims were lower than the consensus forecast.
Wednesday, May 22, 2024
Thursday: New Home Sales, Unemployment Claims
by Calculated Risk on 5/22/2024 07:51:00 PM
 Note: Mortgage rates are from MortgageNewsDaily.com and are for top tier scenarios.
Thursday:
• At 8:30 AM ET, The initial weekly unemployment claims report will be released. The consensus is for 220 thousand initial claims, down from 222 thousand last week.
• Also at 8:30 AM, Chicago Fed National Activity Index for April. This is a composite index of other data.
• At 10:00 AM, New Home Sales for April from the Census Bureau. The consensus is for 680 thousand SAAR, down from 693 thousand SAAR in March.
• At 11:00 AM, the Kansas City Fed manufacturing survey for May.
AIA: Architecture Billings Decline in April; Multi-family Billings Decline for 21st Consecutive Month
by Calculated Risk on 5/22/2024 03:48:00 PM
Note: This index is a leading indicator primarily for new Commercial Real Estate (CRE) investment.
From the AIA: ABI April 2024: Pace of billings decline at architecture firms slows slightly
While the AIA/Deltek Architecture Billings Index (ABI) score for the month rose from 43.6 in March to 48.3 in April, it indicates that billings continued to decline at the majority of firms (a score below 50 indicates declining billings). Inquiries into new projects continued to increase, as there remains interest in starting new projects. However, the value of newly signed design contracts dipped slightly in April, as clients remain hesitant to commit to new work. Firms had hoped that the Federal Reserve would start lowering interest rates this spring and that would open new work, but with that decrease now likely on hold until late summer or early fall, firms may have some more slow months ahead of them.• Northeast (56.9); Midwest (44.2); South (44.6); West (47.8)
Architecture firm billings continued to decline at firms in all regions of the country in April as well, with firms located in the Midwest and South reporting the largest declines. The current longest duration of decline is found at firms located in the West, where billings have now declined for the last 19 consecutive months. Business conditions also remain soft at firms of all specializations, with the weakest conditions continuing at firms with a multifamily residential specialization, followed by those with an institutional specialization, and then those with a commercial/industrial specialization.
...
The ABI score is a leading economic indicator of construction activity, providing an approximately nine-to-twelve-month glimpse into the future of nonresidential construction spending activity. The score is derived from a monthly survey of architecture firms that measures the change in the number of services provided to clients.
emphasis added
• Sector index breakdown: commercial/industrial (47.4); institutional (46.1); multifamily residential (45.6)
 Click on graph for larger image.
This graph shows the Architecture Billings Index since 1996. The index was at 48.3 in April, up from 43.6 in March. Anything below 50 indicates a decrease in demand for architects' services.
Note: This includes commercial and industrial facilities like hotels and office buildings, multi-family residential, as well as schools, hospitals and other institutions.
This index usually leads CRE investment by 9 to 12 months, so this index suggests a slowdown in CRE investment in 2024.
Note that multi-family billing turned down in August 2022 and has been negative for twenty one consecutive months (with revisions). This suggests we will see a further weakness in multi-family starts.
FOMC Minutes: "Recent increases in inflation had been relatively broad based"
by Calculated Risk on 5/22/2024 02:00:00 PM
From the Fed: Minutes of the Federal Open Market Committee, April 30–May 1, 2024. Excerpt:
Participants observed that while inflation had eased over the past year, in recent months there had been a lack of further progress toward the Committee's 2 percent objective. The recent monthly data had showed significant increases in components of both goods and services price inflation. In particular, inflation for core services excluding housing had moved up in the first quarter compared with the fourth quarter of last year, and prices of core goods posted their first three-month increase in several months. In addition, housing services inflation had slowed less than had been anticipated based on the smaller increases in measures of market rents over the past year. A few participants remarked that unusually large seasonal patterns could have contributed to January's large increase in PCE inflation, and several participants noted that some components that typically display volatile price changes had boosted recent readings. However, some participants emphasized that the recent increases in inflation had been relatively broad based and therefore should not be overly discounted.
Participants generally commented that they remained highly attentive to inflation risks. They also remained concerned that elevated inflation continued to harm the purchasing power of households, especially those least able to meet the higher costs of essentials like food, housing, and transportation.
Participants noted that they continued to expect that inflation would return to 2 percent over the medium term. However, recent data had not increased their confidence in progress toward 2 percent and, accordingly, had suggested that the disinflation process would likely take longer than previously thought.
emphasis added
NAR: Existing-Home Sales Decreased to 4.14 million SAAR in April; Median House Prices Increased 5.7% Year-over-Year
by Calculated Risk on 5/22/2024 01:13:00 PM
Today, in the CalculatedRisk Real Estate Newsletter: NAR: Existing-Home Sales Decreased to 4.14 million SAAR in April
Excerpt:
Sales Year-over-Year and Not Seasonally Adjusted (NSA)There is much more in the article.
The fourth graph shows existing home sales by month for 2023 and 2024.
Sales declined 1.9% year-over-year compared to March 2023. This was the thirty-second consecutive month with sales down year-over-year.

NAR: Existing-Home Sales Decreased to 4.14 million SAAR in April
by Calculated Risk on 5/22/2024 10:00:00 AM
From the NAR: Existing-Home Sales Retreated 1.9% in April
Existing-home sales receded in April, according to the National Association of REALTORS®. All four major U.S. regions posted month-over-month declines. Year-over-year, sales decreased in the Northeast, Midwest and South but increased in the West.
Total existing-home sales – completed transactions that include single-family homes, townhomes, condominiums and co-ops – slid 1.9% from March to a seasonally adjusted annual rate of 4.14 million in April. Year-over-year, sales fell 1.9% (down from 4.22 million in April 2023).
...
Total housing inventory registered at the end of April was 1.21 million units, up 9% from March and 16.3% from one year ago (1.04 million). Unsold inventory sits at a 3.5-month supply at the current sales pace, up from 3.2 months in March and 3.0 months in April 2023.
emphasis added
 Click on graph for larger image.
This graph shows existing home sales, on a Seasonally Adjusted Annual Rate (SAAR) basis since 1994.
Sales in April (4.14 million SAAR) were down 1.9% from the previous month and were 1.9% below the April 2023 sales rate.
The second graph shows nationwide inventory for existing homes.
 According to the NAR, inventory increased to 1.21 million in April from 1.11 million the previous month.
 According to the NAR, inventory increased to 1.21 million in April from 1.11 million the previous month.
Headline inventory is not seasonally adjusted, and inventory usually decreases to the seasonal lows in December and January, and peaks in mid-to-late summer.
The last graph shows the year-over-year (YoY) change in reported existing home inventory and months-of-supply. Since inventory is not seasonally adjusted, it really helps to look at the YoY change. Note: Months-of-supply is based on the seasonally adjusted sales and not seasonally adjusted inventory.
 Inventory was up 16.3% year-over-year (blue) in April compared to April 2023.
Months of supply (red) increased to 3.5 months in April from 3.2 months the previous month.
This was below the consensus forecast. I'll have more later.
The last graph shows the year-over-year (YoY) change in reported existing home inventory and months-of-supply. Since inventory is not seasonally adjusted, it really helps to look at the YoY change. Note: Months-of-supply is based on the seasonally adjusted sales and not seasonally adjusted inventory.
 Inventory was up 16.3% year-over-year (blue) in April compared to April 2023.
 Months of supply (red) increased to 3.5 months in April from 3.2 months the previous month.
This was below the consensus forecast. I'll have more later.
MBA: Mortgage Applications Increased in Weekly Survey
by Calculated Risk on 5/22/2024 07:00:00 AM
From the MBA: Mortgage Applications Increase in Latest MBA Weekly Survey
Mortgage applications increased 1.9 percent from one week earlier, according to data from the Mortgage Bankers Association’s (MBA) Weekly Mortgage Applications Survey for the week ending May 17, 2024.
The Market Composite Index, a measure of mortgage loan application volume, increased 1.9 percent on a seasonally adjusted basis from one week earlier. On an unadjusted basis, the Index increased 1.1 percent compared with the previous week. The Refinance Index increased 7 percent from the previous week and was 21 percent higher than the same week one year ago. The seasonally adjusted Purchase Index decreased 1 percent from one week earlier. The unadjusted Purchase Index decreased 2 percent compared with the previous week and was 11 percent lower than the same week one year ago.
“The 30-year fixed mortgage rate declined for the third straight week, dropping to 7.01 percent – the lowest level in seven weeks,” said Joel Kan, MBA’s Vice President and Deputy Chief Economist. “Rates coming down from recent highs spurred some borrowers to act, with increases across both conventional and government refinance applications. VA refinances had a double-digit increase for the third consecutive week, although the current level of refinancing is still well below its historical average. Purchase activity continues to lag despite this recent decline in rates, down 11 percent from a year ago, as potential buyers still face limited for-sale inventory and high list prices.”
...
The average contract interest rate for 30-year fixed-rate mortgages with conforming loan balances ($766,550 or less) decreased to 7.01 percent from 7.08 percent, with points decreasing to 0.60 from 0.63 (including the origination fee) for 80 percent loan-to-value ratio (LTV) loans.
emphasis added
 Click on graph for larger image.
The first graph shows the MBA mortgage purchase index.
According to the MBA, purchase activity is down 11% year-over-year unadjusted.
Red is a four-week average (blue is weekly).
Purchase application activity is up slightly from the lows in late October 2023, and below the lowest levels during the housing bust.

The second graph shows the refinance index since 1990.
With higher mortgage rates, the refinance index declined sharply in 2022, and mostly flat lined since then with a slight increase recently.
Tuesday, May 21, 2024
Wednesday: Existing Home Sales, FOMC Minutes, Architecture Billings Index
by Calculated Risk on 5/21/2024 07:22:00 PM
 Note: Mortgage rates are from MortgageNewsDaily.com and are for top tier scenarios.
Wednesday:
• At 7:00 AM ET, The Mortgage Bankers Association (MBA) will release the results for the mortgage purchase applications index.
• At 10:00 AM, Existing Home Sales for April from the National Association of Realtors (NAR). The consensus is for 4.18 million SAAR, down from 4.19 million. Housing economist Tom Lawler expects the NAR to report sales of 4.23 million SAAR.
• During the day, The AIA's Architecture Billings Index for April (a leading indicator for commercial real estate).
• At 2:00 PM, FOMC Minutes, Minutes Meeting of April 30-May 1, 2024


