 RSS Feed
 by Calculated Risk on 2/29/2024 08:43:00 PM
Thursday, February 29, 2024
Friday: ISM Mfg, Construction Spending, Vehicle Sales
 Note: Mortgage rates are from MortgageNewsDaily.com and are for top tier scenarios.
Friday:
• At 10:00 AM ET, ISM Manufacturing Index for February. The consensus is for the ISM to be at 49.2, up from 49.1 in January.
• At 10:00 AM, Construction Spending for January. The consensus is for a 0.2% increase in construction spending.
• At 10:00 AM, University of Michigan's Consumer sentiment index (Final for February).
• All day, Light vehicle sales for February. Sales were at 15.0 million in January (Seasonally Adjusted Annual Rate). The consensus is for sales of 15.5 million SAAR.
Freddie Mac House Price Index Increased in January; Up 6.2% Year-over-year
by Calculated Risk on 2/29/2024 04:40:00 PM
Today, in the Calculated Risk Real Estate Newsletter: Freddie Mac House Price Index Increased in January; Up 6.2% Year-over-year
A brief excerpt:
On a year-over-year basis, the National FMHPI was up 6.2% in January, from up 6.3% YoY in December. The YoY increase peaked at 19.1% in July 2021, and for this cycle, bottomed at up 0.9% YoY in April 2023. ...
As of January, 16 states were below their previous peaks, Seasonally Adjusted. The largest seasonally adjusted declines from the recent peak were in Idaho (-4.2%), Maine (-2.8%), Oregon (-1.8%), and Washington (-1.6%).
For cities (Core-based Statistical Areas, CBSA), here are the 30 cities with the largest declines from the peak, seasonally adjusted. Austin continues to be the worst performing city.

There is much more in the article.
Las Vegas January 2024: Visitor Traffic Up 3% YoY; Convention Traffic Up 9%
by Calculated Risk on 2/29/2024 02:32:00 PM
From the Las Vegas Visitor Authority: January 2024 Las Vegas Visitor Statistics
With a room inventory with roughly 4,300 more rooms than last year, est. visitor volume reached 3.38M, up 3.3% YoY.
Despite the larger room inventory vs. Jan 2023, overall hotel occupancy for the month was on par with last January at 78.9% (down ‐0.2 pts). Affected in part by the move of the CES tradeshow back to midweek dates this January instead of the weekend dates it spanned last January, Weekend occupancy for the month declined to 83.6% (down ‐4.8 pts) while Midweek occupancy increased to 77%, +1.8 pts YoY.
ADR for the month matched last January at approx. $191 while RevPAR saw a modest YoY decline to just under $151, ‐0.5%.
emphasis added
 Click on graph for larger image.
 The first graph shows visitor traffic for 2019 (Black), 2020 (dark blue), 2021 (light blue), 2022 (light orange), 2023 (dark orange) and 2024 (red).
Visitor traffic was up 3.3% compared to last January. Visitor traffic was down 0.8% compared to the same month in 2019.
The second graph shows convention traffic.

Convention traffic was up 8.6% compared to January 2023, and down 18.5% compared to January 2019. 
Note: There was almost no convention traffic from April 2020 through May 2021.
NAR: Pending Home Sales Decrease 4.9% in January; Down 8.8% Year-over-year
by Calculated Risk on 2/29/2024 10:00:00 AM
From the NAR: Pending Home Sales Receded 4.9% in January
Pending home sales in January dropped 4.9%, according to the National Association of REALTORS®. The Northeast and West posted monthly gains in transactions while the Midwest and South recorded losses. All four U.S. regions registered year-over-year decreases.This was well below expectations. Note: Contract signings usually lead sales by about 45 to 60 days, so this would usually be for closed sales in February and March.
The Pending Home Sales Index (PHSI)* – a forward-looking indicator of home sales based on contract signings – decreased to 74.3 in January. Year over year, pending transactions were down 8.8%. An index of 100 is equal to the level of contract activity in 2001.
...
The Northeast PHSI increased 0.8% from last month to 63.6, a decline of 5.5% from January 2023. The Midwest index decreased 7.6% to 73.7 in January, down 11.6% from one year ago.
The South PHSI declined 7.3% to 88.5 in January, falling 9.0% from the prior year. The West index rose 0.5% in January to 61.1, down 7.0% from January 2023.
emphasis added
PCE Measure of Shelter Slows to 6.1% YoY in January
by Calculated Risk on 2/29/2024 09:09:00 AM
Here is a graph of the year-over-year change in shelter from the CPI report and housing from the PCE report this morning, both through January 2024.
 CPI Shelter was up 6.1% year-over-year in January, down from 6.2% in December, and down from the cycle peak of 8.2% in March 2023.
Housing (PCE) was up 6.1% YoY in January, down from 6.3% in December, and down from the cycle peak of 8.3% in April 2023.
Since asking rents are mostly flat year-over-year, these measures will continue to slow over coming months.
Since asking rents are mostly flat year-over-year, these measures will continue to slow over coming months.
The second graph shows PCE prices, Core PCE prices and Core ex-housing over the last 6 months (annualized):
 Key measures are now close to the Fed's target on a 6-month basis.
PCE Price Index: 2.5%
Core PCE Prices: 2.5%
Core minus Housing: 1.8%
Personal Income increased 1.0% in January; Spending increased 0.2%
by Calculated Risk on 2/29/2024 08:35:00 AM
The BEA released the Personal Income and Outlays report for January:
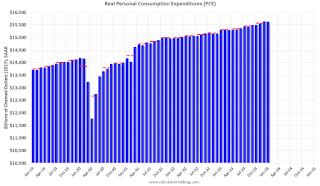
Personal income increased $233.7 billion (1.0 percent at a monthly rate) in January, according to estimates released today by the Bureau of Economic Analysis. Disposable personal income (DPI), personal income less personal current taxes, increased $67.6 billion (0.3 percent) and personal consumption expenditures (PCE) increased $43.9 billion (0.2 percent).The January PCE price index increased 2.4 percent year-over-year (YoY), down from 2.6 percent YoY in December, and down from the recent peak of 7.1 percent in June 2022.
The PCE price index increased 0.3 percent. Excluding food and energy, the PCE price index increased 0.4 percent. Real DPI decreased less than 0.1 percent in January and real PCE decreased 0.1 percent; goods decreased 1.1 percent and services increased 0.4 percent.
emphasis added
The PCE price index, excluding food and energy, increased 2.8 percent YoY, down from 2.9 percent in December, and down from the recent peak of 5.6 percent in February 2022.
The following graph shows real Personal Consumption Expenditures (PCE) through January 2024 (2017 dollars). Note that the y-axis doesn't start at zero to better show the change.
 Click on graph for larger image.
The dashed red lines are the quarterly levels for real PCE.
Personal income was above expectations and PCE was at expectations.
Inflation was slightly above expectations.
Weekly Initial Unemployment Claims Increase to 215,000
by Calculated Risk on 2/29/2024 08:30:00 AM
The DOL reported:
In the week ending February 24, the advance figure for seasonally adjusted initial claims was 215,000, an increase of 13,000 from the previous week's revised level. The previous week's level was revised up by 1,000 from 201,000 to 202,000. The 4-week moving average was 212,500, a decrease of 3,000 from the previous week's revised average. The previous week's average was revised up by 250 from 215,250 to 215,500.The following graph shows the 4-week moving average of weekly claims since 1971.
emphasis added
 Click on graph for larger image.
The dashed line on the graph is the current 4-week average. The four-week average of weekly unemployment claims decreased to 212,500.
The previous week was revised up.
Weekly claims were above the consensus forecast.
Wednesday, February 28, 2024
Thursday: Personal Income & Outlays, Unemployment Claims, Pending Home Sales, Chicago PMI
by Calculated Risk on 2/28/2024 06:51:00 PM
 Note: Mortgage rates are from MortgageNewsDaily.com and are for top tier scenarios.
Thursday:
• At 8:30 AM ET, The initial weekly unemployment claims report will be released. The consensus is for 195 thousand initial claims, down from 201 thousand last week.
• Also at 8:30 AM, Personal Income and Outlays for January. The consensus is for a 0.5% increase in personal income, and for a 0.2% increase in personal spending. And for the Core PCE price index to increase 0.4%. PCE prices are expected to be up 2.4% YoY, and core PCE prices up 2.8% YoY.
• At 9:45 AM, Chicago Purchasing Managers Index for February.
• At 10:00 AM, Pending Home Sales Index for January. The consensus is for a 1.0% increase in the index.
• At 11:00 AM, the Kansas City Fed manufacturing survey for February.
Freddie Reports Surge in Multifamily Serious Delinquencies
by Calculated Risk on 2/28/2024 12:33:00 PM
Today, in the Calculated Risk Real Estate Newsletter: Freddie Reports Surge in Multifamily Serious Delinquencies
Brief excerpt:
Freddie Mac reports that the multi-family serious delinquency rate increased sharply in January to 0.44% from 0.28% in December, and up from 0.12% in January 2023.
This graph shows the Freddie multi-family serious delinquency rate since 2012.

There ismore in the article.
Q4 GDP Growth Revised Down to 3.2% Annual Rate
by Calculated Risk on 2/28/2024 08:30:00 AM
From the BEA: Gross Domestic Product, Fourth Quarter and Year 2023 (Second Estimate)
Real gross domestic product (GDP) increased at an annual rate of 3.2 percent in the fourth quarter of 2023, according to the "second" estimate released by the Bureau of Economic Analysis. In the third quarter, real GDP increased 4.9 percent.Here is a Comparison of Second and Advance Estimates. PCE growth was revised up from 2.8% to 3.0%. Residential investment was revised up from 1.1% to 2.9%.
The GDP estimate released today is based on more complete source data than were available for the "advance" estimate issued last month. In the advance estimate, the increase in real GDP was 3.3 percent. The update primarily reflected a downward revision to private inventory investment that was partly offset by upward revisions to state and local government spending and consumer spending (refer to "Updates to GDP").
The increase in real GDP reflected increases in consumer spending, exports, state and local government spending, nonresidential fixed investment, federal government spending, and residential fixed investment that were partly offset by a decrease in private inventory investment. Imports, which are a subtraction in the calculation of GDP, increased.
emphasis added
MBA: Mortgage Applications Decreased in Weekly Survey, "Activity stalled"
by Calculated Risk on 2/28/2024 07:00:00 AM
"Higher rates in recent weeks have stalled activity", Mike Fratantoni, MBA’s SVP and Chief Economist.
Mortgage applications decreased 5.6 percent from one week earlier, according to data from the Mortgage Bankers Association’s (MBA) Weekly Mortgage Applications Survey for the week ending February 23, 2024.
The Market Composite Index, a measure of mortgage loan application volume, decreased 5.6 percent on a seasonally adjusted basis from one week earlier. On an unadjusted basis, the Index decreased 3 percent compared with the previous week. The Refinance Index decreased 7 percent from the previous week and was 1 percent lower than the same week one year ago. The seasonally adjusted Purchase Index decreased 5 percent from one week earlier. The unadjusted Purchase Index decreased 1 percent compared with the previous week and was 12 percent lower than the same week one year ago.
“Mortgage rates were little changed last week, with the 30-year conforming rate declining slightly to 7.04 percent but remaining about a quarter percentage point higher than the start of the year,” said Mike Fratantoni, MBA’s SVP and Chief Economist. “Higher rates in recent weeks have stalled activity, and last week it dropped more for those seeking FHA and VA refinances. Purchase activity is running 12 percent behind last year’s pace, but our January Builder Application Survey results showed that applications to buy new homes were up 19 percent compared to last year. This disparity continues to highlight how the lack of existing inventory is the primary constraint to increases in purchase volume. However, mortgage rates above 7 percent sure don’t help.”
...
The average contract interest rate for 30-year fixed-rate mortgages with conforming loan balances ($766,550 or less) decreased to 7.04 percent from 7.06 percent, with points increasing to 0.67 from 0.66 (including the origination fee) for 80 percent loan-to-value ratio (LTV) loans.
emphasis added
 Click on graph for larger image.
The first graph shows the MBA mortgage purchase index.
According to the MBA, purchase activity is down 12% year-over-year unadjusted.
Red is a four-week average (blue is weekly).
Purchase application activity is up slightly from the lows in late October 2023, and below the lowest levels during the housing bust. Other than two weeks last October, this is the lowest level since 1995.

The second graph shows the refinance index since 1990.
With higher mortgage rates, the refinance index declined sharply in 2022, and has mostly flatlined since then.
Tuesday, February 27, 2024
Wednesday: GDP
by Calculated Risk on 2/27/2024 07:26:00 PM
 Note: Mortgage rates are from MortgageNewsDaily.com and are for top tier scenarios.
Wednesday:
• At 7:00 AM ET, The Mortgage Bankers Association (MBA) will release the results for the mortgage purchase applications index.
• At 8:30 AM, Gross Domestic Product, 4th Quarter and Year 2023 (Second Estimate) The consensus is that real GDP increased 3.3% annualized in Q4, unchanged from the advance estimate of 3.3%.
Lawler: Update on American Homes for Rent (AMH)
by Calculated Risk on 2/27/2024 01:13:00 PM
Today, in the Calculated Risk Real Estate Newsletter: Lawler: Update on American Homes for Rent (AMH)
A brief excerpt:
From housing economist Tom Lawler:There is much more in the article.
Below is a table derived from the Q4/2023 (and earlier) “Earnings Release and Supplemental Information Package” from American Homes for Rent (AMH), a large institutional investor in single-family rental homes. Also below is the table shown in last week’s report for Invitation Homes (INVH).
Recall that INVH said that last quarter it was focused on improving its occupancy rate and told teams to “negotiate” to do so. AMH, in contrast, saw its occupancy rate decline last quarter.

Comments on December Case-Shiller and FHFA House Prices
by Calculated Risk on 2/27/2024 09:48:00 AM
Today, in the Calculated Risk Real Estate Newsletter: Case-Shiller: National House Price Index Up 5.5% year-over-year in December; FHFA: House Prices Up 6.5% Q4 over Q4
Excerpt:
S&P/Case-Shiller released the monthly Home Price Indices for December ("December" is a 3-month average of October, November and December closing prices). December closing prices include some contracts signed in August, so there is a significant lag to this data. Here is a graph of the month-over-month (MoM) change in the Case-Shiller National Index Seasonally Adjusted (SA).
The MoM increase in the seasonally adjusted (SA) Case-Shiller National Index was at 0.19%. This was the eleventh consecutive MoM increase, but the smallest increase since prices declined (SA) in January 2023.
On a seasonally adjusted basis, prices increased in 13 of the 20 Case-Shiller cities on a month-to-month basis. Seasonally adjusted, San Francisco has fallen 8.7% from the recent peak, Seattle is down 7.0% from the peak, Portland down 4.7%, and Phoenix is down 3.2%.

There is much more in the article.
Case-Shiller: National House Price Index Up 5.5% year-over-year in December
by Calculated Risk on 2/27/2024 09:00:00 AM
S&P/Case-Shiller released the monthly Home Price Indices for December ("December" is a 3-month average of October, November and December closing prices).
This release includes prices for 20 individual cities, two composite indices (for 10 cities and 20 cities) and the monthly National index.
From S&P S&P CoreLogic Case-Shiller Index Reports 5.5% Annual Home Price Gain for Calendar 2023
The S&P CoreLogic Case-Shiller U.S. National Home Price NSA Index, covering all nine U.S. census divisions, reported a 5.5% annual gain in December, up from a 5.0% rise in the previous month. The 10-City Composite showed an increase of 7.0%, up from a 6.3% increase in the previous month. The 20-City Composite posted a year-over-year increase of 6.1%, up from a 5.4% increase in the previous month. San Diego reported the highest year-over-year gain among the 20 cities with an 8.8% increase in December, followed by Los Angeles and Detroit, each with an 8.3% increase. Portland showed a 0.3% increase this month, holding the lowest rank after reporting the smallest year-over-year growth.
...
The U.S. National Index showed a continued decrease of 0.4%, while the 20-City Composite and 10- City Composite posted 0.3% and 0.2% month-over-month decreases respectively in December.
After seasonal adjustment, the U.S. National Index, the 20-City Composite, and the 10-City Composite all posted month-over-month increases of 0.2%.
“U.S. home prices faced significant headwinds in the fourth quarter of 2023,” says Brian D. Luke, Head of Commodities, Real & Digital Assets at S&P Dow Jones Indices. “However, on a seasonally adjusted basis, the S&P Case-Shiller Home Price Indices continued its streak of seven consecutive record highs in 2023. Ten of 20 markets beat prior records, with San Diego registering an 8.9% gain and Las Vegas the fastest rising market in December, after accounting for seasonal impacts.”
“2023 U.S. housing gains haven’t followed such a synchronous pattern since the COVID housing boom. The term ‘a rising tide lifts all boats’ seems appropriate given broad-based performance in the U.S. housing sector. All 20 markets reported yearly gains for the first time this year, with four markets rising over 8%. Portland eked out a positive annual gain after 11 months of declines. Regionally, the Midwest and Northeast both experienced the greatest annual appreciation with 6.7%.”
 Click on graph for larger image.
 The first graph shows the nominal seasonally adjusted Composite 10, Composite 20 and National indices (the Composite 20 was started in January 2000).
The Composite 10 index is up 0.2% in December (SA) and is at a new all-time high.
The Composite 20 index is up 0.2% (SA) in December and is also at a new all-time high.
The National index is up 0.2% (SA) in December and is also at a new all-time high.
 The second graph shows the year-over-year change in all three indices.
The Composite 10 SA is up 7.0% year-over-year. The Composite 20 SA is up 6.1% year-over-year.
The National index SA is up 5.5% year-over-year.
Annual price changes were at expectations. I'll have more later.
Monday, February 26, 2024
Tuesday: Case-Shiller House Prices, Durable Goods, Richmond Fed Mfg
by Calculated Risk on 2/26/2024 07:16:00 PM
 From Matthew Graham at Mortgage News Daily: Mortgage Rates Starting The Week Closer to Recent Highs
Mortgage rates moved moderately higher to begin the new week, but they remained just under the highest recent levels seen last Thursday. Many lenders were closer to 'unchanged' at the outset but were then forced to issue mid-day increases in response to weakness in the bond market.Tuesday:
...
Some of this week's data could have an impact, but next week's data represents a much bigger risk (or opportunity). [30 year fixed 7.13%]
emphasis added
• At 8:30 AM ET, Durable Goods Orders for January from the Census Bureau. The consensus is for a 4.5% decrease in durable goods orders.
• At 9:00 AM, FHFA House Price Index for December 2023. This was originally a GSE only repeat sales, however there is also an expanded index.
• Also at 9:00 AM, S&P/Case-Shiller House Price Index for December. The consensus is for a 5.5% year-over-year increase in the National index for December, up from 5.1% in November.
• At 10:00 AM, Richmond Fed Survey of Manufacturing Activity for February.
Final Look at Local Housing Markets in January
by Calculated Risk on 2/26/2024 03:02:00 PM
Today, in the Calculated Risk Real Estate Newsletter: Final Look at Local Housing Markets in January
A brief excerpt:
After the National Association of Realtors® (NAR) releases the monthly existing home sales report, I pick up additional local market data that is reported after the NAR. This is the final look at local markets in January.There is much more in the article.
I’ve added a comparison of active listings, new listings, and closings to the same month in 2019 (for markets with available data). This gives us a sense of the current low level of sales and inventory, and also shows some significant regional differences.
The big stories for January were that existing home sales were very low, at 4.00 million on a seasonally adjusted annual rate basis (SAAR), and new listings were up YoY for the 4th consecutive month!
...
And a table of January sales.
In January, sales in these markets were up 3.0%. In December, these same markets were down 7.9% year-over-year Not Seasonally Adjusted (NSA).
Sales in most of these markets are down sharply compared to January 2019.
...
It is unlikely sales will be up year-over-year in February since sales were reported at 4.53 million SAAR in February 2023. The comparison will be easier later in the year.
More local data coming in March for activity in February!

New Home Sales at 661,000 Annual Rate in January; Median New Home Price is Down 15% from the Peak
by Calculated Risk on 2/26/2024 10:50:00 AM
Today, in the Calculated Risk Real Estate Newsletter: New Home Sales at 661,000 Annual Rate in January
Brief excerpt:
The Census Bureau reports New Home Sales in January were at a seasonally adjusted annual rate (SAAR) of 661 thousand. The previous three months were revised down.There is much more in the article.
...
The next graph shows new home sales for 2023 and 2024 by month (Seasonally Adjusted Annual Rate). Sales in January 2024 were up 1.8% from January 2023.

New Home Sales at 661,000 Annual Rate in January
by Calculated Risk on 2/26/2024 10:00:00 AM
The Census Bureau reports New Home Sales in January were at a seasonally adjusted annual rate (SAAR) of 661 thousand.
The previous three months were revised down.
Sales of new single‐family houses in January 2024 were at a seasonally adjusted annual rate of 661,000, according to estimates released jointly today by the U.S. Census Bureau and the Department of Housing and Urban Development. This is 1.5 percent above the revised December rate of 651,000 and is 1.8 percent above the January 2023 estimate of 649,000.
emphasis added
 Click on graph for larger image.
The first graph shows New Home Sales vs. recessions since 1963. The dashed line is the current sales rate.
New home sales were close to pre-pandemic levels.
The second graph shows New Home Months of Supply.
 The months of supply was unchanged in January at 8.3 months from 8.3 months in December.
 The all-time record high was 12.2 months of supply in January 2009. The all-time record low was 3.3 months in August 2020.
This is well above the top of the normal range (about 4 to 6 months of supply is normal).
"The seasonally‐adjusted estimate of new houses for sale at the end of January was 456,000. This represents a supply of 8.3 months at the current sales rate."Sales were below expectations of 675 thousand SAAR, and sales for the three previous months were revised down. I'll have more later today.
Housing February 26th Weekly Update: Inventory Up 0.7% Week-over-week, Up 15.6% Year-over-year
by Calculated Risk on 2/26/2024 08:21:00 AM
Altos reports that active single-family inventory was up 0.7% week-over-week. It is likely inventory bottomed in mid-February, as opposed to mid-April in 2023.
 Click on graph for larger image.
This inventory graph is courtesy of Altos Research.
As of February 23th, inventory was at 498 thousand (7-day average), compared to 494 thousand the prior week.
Inventory is still far below pre-pandemic levels.

The red line is for 2024. The black line is for 2019. Note that inventory is up more than double from the record low for the same week in 2022, but still well below normal levels.
Inventory was up 15.6% compared to the same week in 2023 (last week it was up 12.9%), and down 39.3% compared to the same week in 2019 (last week it was down 39.7%).
Back in June 2023, inventory was down almost 54% compared to 2019, so the gap to more normal inventory levels has closed a little.
Mike Simonsen discusses this data regularly on Youtube.
Sunday, February 25, 2024
Monday: New Home Sales
by Calculated Risk on 2/25/2024 09:23:00 PM
Weekend:
• Schedule for Week of February 25, 2024
Monday:
• At 10:00 AM ET, New Home Sales for January from the Census Bureau. The consensus is that new home sales increased to 675 thousand SAAR, up from 646 thousand in December.
• At 10:30 AM, Dallas Fed Survey of Manufacturing Activity for February.
From CNBC: Pre-Market Data and Bloomberg futures S&P 500 are down 10 and DOW futures are down 60 (fair value).
Oil prices were down over the last week with WTI futures at $76.49 per barrel and Brent at $81.62 per barrel. A year ago, WTI was at $76, and Brent was at $82 - so WTI oil prices are unchanged year-over-year.
Here is a graph from Gasbuddy.com for nationwide gasoline prices. Nationally prices are at $3.26 per gallon. A year ago, prices were at $3.33 per gallon, so gasoline prices are down $0.07 year-over-year.
February Vehicle Sales Forecast: 15.5 million SAAR, Up 4% YoY
by Calculated Risk on 2/25/2024 08:21:00 AM
From WardsAuto: February U.S. Light-Vehicle Sales to Rebound from January's Slide (pay content). Brief excerpt:
Sales are bouncing back in February, thanks mostly to a surge in estimated fleet volume, while the retail sector posts tepid growth. Higher interest rates, negative aspects of the inventory mix and lack of fresh product are keeping demand from being even stronger. One take away from February is that the month’s results will be more proof seasonal trends in the U.S. are resuming pre-2020 norms, which also means sales should strengthen again in March.
emphasis added
 Click on graph for larger image.
This graph shows actual sales from the BEA (Blue), and Wards forecast for February (Red).
On a seasonally adjusted annual rate basis, the Wards forecast of 15.5 million SAAR, would be up 3.3% from last month, and up 4.2% from a year ago.
Saturday, February 24, 2024
Real Estate Newsletter Articles this Week: Existing-Home Sales Increased to 4.00 million SAAR in January
by Calculated Risk on 2/24/2024 02:11:00 PM
At the Calculated Risk Real Estate Newsletter this week:
• NAR: Existing-Home Sales Increased to 4.00 million SAAR in January
• Lawler: Update on Invitation Homes Rental Trends
• Single Family Built-for-Rent Almost Doubled Since 2020
• 3rd Look at Local Housing Markets in January; California Home Sales Up 5.9% YoY in January
This is usually published 4 to 6 times a week and provides more in-depth analysis of the housing market.
Schedule for Week of February 25, 2024
by Calculated Risk on 2/24/2024 08:11:00 AM
The key reports this week are January New Home sales, the second estimate of Q4 GDP, Personal Income and Outlays for January, Case-Shiller house prices and February vehicle sales.
For manufacturing, the February ISM Index, and the February Dallas, Kansas City, and Richmond Fed manufacturing surveys will be released.
 10:00 AM: New Home Sales for January from the Census Bureau.
 This graph shows New Home Sales since 1963.
The dashed line is the sales rate for last month.
The consensus is that new home sales increased to 675 thousand SAAR, up from 646 thousand in December.
10:30 AM: Dallas Fed Survey of Manufacturing Activity for February.
----- Tuesday, February 27th -----
8:30 AM: Durable Goods Orders for January from the Census Bureau. The consensus is for a 4.5% decrease in durable goods orders.
9:00 AM: FHFA House Price Index for December 2023. This was originally a GSE only repeat sales, however there is also an expanded index.
 9:00 AM: S&P/Case-Shiller House Price Index for December.
This graph shows the year-over-year change for the Case-Shiller National, Composite 10 and Composite 20 indexes, through the most recent report (the Composite 20 was started in January 2000).
The consensus is for a 5.5% year-over-year increase in the National index for December, up from 5.1% in November.
10:00 AM: Richmond Fed Survey of Manufacturing Activity for February.
----- Wednesday, February 28th -----
7:00 AM ET: The Mortgage Bankers Association (MBA) will release the results for the mortgage purchase applications index.
8:30 AM: Gross Domestic Product, 4th Quarter and Year 2023 (Second Estimate) The consensus is that real GDP increased 3.3% annualized in Q4, unchanged from the advance estimate of 3.3%.
----- Thursday, February 29th -----
8:30 AM: The initial weekly unemployment claims report will be released. The consensus is for 195 thousand initial claims, down from 201 thousand last week.
8:30 AM ET: Personal Income and Outlays for January. The consensus is for a 0.5% increase in personal income, and for a 0.2% increase in personal spending. And for the Core PCE price index to increase 0.4%. PCE prices are expected to be up 2.4% YoY, and core PCE prices up 2.8% YoY.
9:45 AM: Chicago Purchasing Managers Index for February.
10:30 AM: Dallas Fed Survey of Manufacturing Activity for February.
8:30 AM: Durable Goods Orders for January from the Census Bureau. The consensus is for a 4.5% decrease in durable goods orders.
9:00 AM: FHFA House Price Index for December 2023. This was originally a GSE only repeat sales, however there is also an expanded index.
 9:00 AM: S&P/Case-Shiller House Price Index for December.
This graph shows the year-over-year change for the Case-Shiller National, Composite 10 and Composite 20 indexes, through the most recent report (the Composite 20 was started in January 2000).
The consensus is for a 5.5% year-over-year increase in the National index for December, up from 5.1% in November.
10:00 AM: Richmond Fed Survey of Manufacturing Activity for February.
7:00 AM ET: The Mortgage Bankers Association (MBA) will release the results for the mortgage purchase applications index.
8:30 AM: Gross Domestic Product, 4th Quarter and Year 2023 (Second Estimate) The consensus is that real GDP increased 3.3% annualized in Q4, unchanged from the advance estimate of 3.3%.
8:30 AM: The initial weekly unemployment claims report will be released. The consensus is for 195 thousand initial claims, down from 201 thousand last week.
8:30 AM ET: Personal Income and Outlays for January. The consensus is for a 0.5% increase in personal income, and for a 0.2% increase in personal spending. And for the Core PCE price index to increase 0.4%. PCE prices are expected to be up 2.4% YoY, and core PCE prices up 2.8% YoY.
9:45 AM: Chicago Purchasing Managers Index for February.
10:00 AM: Pending Home Sales Index for January. The consensus is for a 1.0% increase in the index.
11:00 AM: the Kansas City Fed manufacturing survey for February.
10:00 AM: ISM Manufacturing Index for February. The consensus is for the ISM to be at 49.2, up from 49.1 in January.
10:00 AM: Construction Spending for January. The consensus is for a 0.2% increase in construction spending.
10:00 AM: University of Michigan's Consumer sentiment index (Final for February).
 All day: Light vehicle sales for February. Sales were at 15.0 million in January (Seasonally Adjusted Annual Rate). The consensus is for sales of 15.5 million SAAR.
This graph shows light vehicle sales since the BEA started keeping data in 1967. The dashed line is the January sales rate.
Friday, February 23, 2024
Feb 23rd COVID Update: Weekly Deaths Decreased
by Calculated Risk on 2/23/2024 07:51:00 PM
 Note: Mortgage rates are from MortgageNewsDaily.com and are for top tier scenarios.
Due to changes at the CDC, weekly cases are no longer updated.
For deaths, I'm currently using 4 weeks ago for "now", since the most recent three weeks will be revised significantly.
Hospitalizations are more than three times the low of 5,386 in June 2023, however, they have declined significantly from 30,018 earlier this year.
| COVID Metrics | ||||
|---|---|---|---|---|
| Now | Week Ago | Goal | ||
| Hospitalized2 | 16,536 | 18,024 | ≤3,0001 | |
| Deaths per Week2 | 1,883 | 2,210 | ≤3501 | |
| 1my goals to stop weekly posts, 2Weekly for Currently Hospitalized, and Deaths 🚩 Increasing number weekly for Hospitalized and Deaths ✅ Goal met. | ||||
 Click on graph for larger image.
This graph shows the weekly (columns) number of deaths reported.
Weekly deaths are more than three times the low of 489 in July 2023, but have declined from the recent peak of 2,484.
 This appears to be a leading indicator for COVID hospitalizations and deaths.
Nationally, COVID in wastewater is now off more than 50% from the holiday peak at the end of December, and that suggests weekly deaths will continue to decline. The South region still has high levels of COVID in wastewater.
Hotels: Occupancy Rate Decreased 2.5% Year-over-year
by Calculated Risk on 2/23/2024 04:03:00 PM
.S. hotel performance increased from the previous week, while year-over-year comparisons remained mixed, according to CoStar’s latest data through 17 February. ...The following graph shows the seasonal pattern for the hotel occupancy rate using the four-week average.
11-17 February 2024 (percentage change from comparable week in 2023):
• Occupancy: 59.2% (-2.5%)
• Average daily rate (ADR): US$162.24 (+4.2%)
• Revenue per available room (RevPAR): US$96.10 (+1.6%)
emphasis added
 Click on graph for larger image.
The red line is for 2024, black is 2020, blue is the median, and dashed light blue is for 2023. Dashed purple is for 2018, the record year for hotel occupancy.
The 4-week average of the occupancy rate is tracking just below last year, and below the median rate for the period 2000 through 2023 (Blue).
Note: Y-axis doesn't start at zero to better show the seasonal change.
The 4-week average of the occupancy rate will increase seasonally over the next several weeks.
GDP Tracking: Q1 Boosted Slightly
by Calculated Risk on 2/23/2024 11:43:00 AM
From BofA:
On net, this week’s data boosted our 1Q US GDP tracking estimate by a tenth to 1.0% q/q saar. Our 4Q tracking estimate also increased by a tenth to 3.2% q/q saar [Feb 23rd estimate]From Goldman:
emphasis added
We boosted our Q1 GDP tracking estimate by 0.1pp to +2.4% (qoq ar) and our Q1 domestic final sales growth forecast by 0.1pp to +2.7% (qoq ar). [Feb 22nd estimate]And from the Altanta Fed: GDPNow
The GDPNow model estimate for real GDP growth (seasonally adjusted annual rate) in the first quarter of 2024 is 2.9 percent on February 16, unchanged from February 15. [Feb 16th estimate] (next release will be on Feb 27th)
ICE: Mortgage Delinquency Rate Decreased in January
by Calculated Risk on 2/23/2024 08:11:00 AM
From ICE (formerly Black Knight): ICE First Look at Mortgage Performance: Foreclosures Up but Delinquencies Improve as the Mortgage Market Kicks Off 2024
• In an expected rebound from December’s calendar-driven rise, the national delinquency rate dropped to 3.38% in January, the lowest since October, and flat from the same time last yearNote: that last column below is for the same month in 2019 to show the change from pre-pandemic levels.
• Past-due mortgages were down across the board, as inflows and rolls to later stages of delinquency fell, while early- and late-stage delinquency cures improved
• Serious delinquencies (loans 90+ days past due but not in active foreclosure) were down 109K (-19%) year over year, with the population now at 470K
• Representing 7.2% of serious delinquencies, January’s 34K foreclosure starts – the most since April 2022 – marked a +43.3% month over month jump, driven in part by seasonal pressures
• The number of loans in active foreclosure rose 7K to 219K, but remained 23% below (-64K) pre-pandemic levels
• 6.6K foreclosure sales were completed nationally in January, a 23% increase from the previous month but in line with the monthly average for the preceding year
• While January’s jump in foreclosures is worth watching, serious delinquencies remain low, with 70% of such loans still protected from foreclosure, reducing near-term risk
• Prepayment activity rose marginally as easing interest rates in December and January provided a modest increase in refinance incentive and homebuyer demand
emphasis added
| ICE: Percent Loans Delinquent and in Foreclosure Process | ||||
|---|---|---|---|---|
| Jan 2024 | Dec 2023 | Jan 2023 | Jan 2019 | |
| Delinquent | 3.38% | 3.57% | 3.38% | 3.75% |
| In Foreclosure | 0.41% | 0.40% | 0.45% | 0.51% |
| Number of properties: | ||||
| Number of properties that are delinquent, but not in foreclosure: | 1,803,000 | 1,908,000 | 1,775,000 | 1,945,000 |
| Number of properties in foreclosure pre-sale inventory: | 219,000 | 212,000 | 238,000 | 265,000 |
| Total Properties | 2,022,000 | 2,120,000 | 2,012,000 | 2,210,000 |
Thursday, February 22, 2024
Realtor.com Reports Active Inventory UP 15.7% YoY; New Listings up 10.9% YoY
by Calculated Risk on 2/22/2024 02:28:00 PM
What this means: On a weekly basis, Realtor.com reports the year-over-year change in active inventory and new listings. On a monthly basis, they report total inventory. For January, Realtor.com reported inventory was up 7.9% YoY, and down 40% compared to January 2019. Now - on a weekly basis - inventory is up 15.7% YoY, and that would put inventory still down about 39% compared to February 2019.
Realtor.com has monthly and weekly data on the existing home market. Here is their weekly report: Weekly Housing Trends View — Data Week Ending February 17, 2024
• Active inventory increased, with for-sale homes 15.7% above year ago levels.
For a 15th consecutive week, active listings registered above prior year level, which means that today’s home shoppers have more homes to choose from that aren’t already in the process of being sold. So far this season, the increase in newly listed homes has resulted in a boost to overall inventory, but while the added inventory has certainly improved conditions from this time in 2021 through 2023, overall inventory is still low compared to the same time in February 2020 and years prior to the COVID-19 Pandemic.
• New listings–a measure of sellers putting homes up for sale–were up this week, by 10.9% from one year ago.
Newly listed homes were above last year’s levels for the 17th week in a row, which could further contribute to a recovery in active listings meaning more options for home shoppers. This past week, newly listed homes were up 10.9% from a year ago, accelerating slightly from the 9.5% growth rate seen in the previous week.
 Here is a graph of the year-over-year change in inventory according to realtor.com.
 Inventory was up year-over-year for the 154th consecutive week following 20 consecutive weeks with a YoY decrease in inventory.
Inventory is still historically very low.
Although new listings remain well below "typical pre-pandemic levels", new listings are now up YoY for the 17th consecutive week.
NAR: Existing-Home Sales Increased to 4.00 million SAAR in January; Median Prices Down 8.4% from Peak NSA
by Calculated Risk on 2/22/2024 10:48:00 AM
Today, in the CalculatedRisk Real Estate Newsletter: NAR: Existing-Home Sales Increased to 4.00 million SAAR in January
Excerpt:
Sales Year-over-Year and Not Seasonally Adjusted (NSA)There is much more in the article.
The fourth graph shows existing home sales by month for 2023 and 2024.
Sales declined 1.7% year-over-year compared to January. This was the twenty-ninth consecutive month with sales down year-over-year. This was just above the cycle low of 3.85 million SAAR in October 2023.

NAR: Existing-Home Sales Increased to 4.00 million SAAR in January
by Calculated Risk on 2/22/2024 10:00:00 AM
From the NAR: Existing-Home Sales Rose 3.1% in January
Existing-home sales grew in January, according to the National Association of REALTORS®. Among the four major U.S. regions, sales accelerated in the Midwest, South and West, and remained steady in the Northeast. Year-over-year, sales improved in the West, and decreased in the Northeast, Midwest and South.
Total existing-home sales – completed transactions that include single-family homes, townhomes, condominiums and co-ops – elevated 3.1% from December to a seasonally adjusted annual rate of 4.00 million in January. Year-over-year, sales slipped 1.7% (down from 4.07 million in January 2023).
...
Total housing inventory registered at the end of January was 1.01 million units, up 2.0% from December and 3.1% from one year ago (980,000). Unsold inventory sits at a 3.0-month supply at the current sales pace, down from 3.1 months in December but up from 2.9 months in January 2023.
emphasis added
 Click on graph for larger image.
This graph shows existing home sales, on a Seasonally Adjusted Annual Rate (SAAR) basis since 1994.
Sales in January (4.00 million SAAR) were up 3.1% from the previous month and were 1.7% below the January 2023 sales rate.
The second graph shows nationwide inventory for existing homes.
 According to the NAR, inventory increased to 1.01 million in January from 0.99 million the previous month.
 According to the NAR, inventory increased to 1.01 million in January from 0.99 million the previous month.
Headline inventory is not seasonally adjusted, and inventory usually decreases to the seasonal lows in December and January, and peaks in mid-to-late summer.
The last graph shows the year-over-year (YoY) change in reported existing home inventory and months-of-supply. Since inventory is not seasonally adjusted, it really helps to look at the YoY change. Note: Months-of-supply is based on the seasonally adjusted sales and not seasonally adjusted inventory.
 Inventory was up 3.1% year-over-year (blue) in January compared to January 2023.
Months of supply (red) decreased to 3.0 months in January from 3.1 months the previous month.
This was above the consensus forecast. I'll have more later.
The last graph shows the year-over-year (YoY) change in reported existing home inventory and months-of-supply. Since inventory is not seasonally adjusted, it really helps to look at the YoY change. Note: Months-of-supply is based on the seasonally adjusted sales and not seasonally adjusted inventory.
 Inventory was up 3.1% year-over-year (blue) in January compared to January 2023.
 Months of supply (red) decreased to 3.0 months in January from 3.1 months the previous month.
This was above the consensus forecast. I'll have more later.
Weekly Initial Unemployment Claims Decrease to 201,000
by Calculated Risk on 2/22/2024 08:30:00 AM
The DOL reported:
In the week ending February 17, the advance figure for seasonally adjusted initial claims was 201,000, a decrease of 12,000 from the previous week's revised level. The previous week's level was revised up by 1,000 from 212,000 to 213,000. The 4-week moving average was 215,250, a decrease of 3,500 from the previous week's revised average. The previous week's average was revised up by 250 from 218,500 to 218,750.The following graph shows the 4-week moving average of weekly claims since 1971.
emphasis added
 Click on graph for larger image.
The dashed line on the graph is the current 4-week average. The four-week average of weekly unemployment claims decreased to 215,250.
The previous week was revised up.
Weekly claims were below the consensus forecast.
Wednesday, February 21, 2024
Thursday: Existing Home Sales, Unemployment Claims
by Calculated Risk on 2/21/2024 07:40:00 PM
 Note: Mortgage rates are from MortgageNewsDaily.com and are for top tier scenarios.
Thursday:
• At 8:30 AM ET, The initial weekly unemployment claims report will be released. The consensus is for 215 thousand initial claims, up from 212 thousand last week.
• Also at 8:30 AM, Chicago Fed National Activity Index for January. This is a composite index of other data.
• At 10:00 AM, Existing Home Sales for January from the National Association of Realtors (NAR). The consensus is for 3.97 million SAAR, up from 3.78 million. Housing economist Tom Lawler estimates the NAR will report sales of 4.02 million SAAR.
• At 11:00 AM, the Kansas City Fed manufacturing survey for February.
FOMC Minutes: "Most participants noted the risks of moving too quickly to ease the stance of policy"
by Calculated Risk on 2/21/2024 02:00:00 PM
From the Fed: Minutes of the Federal Open Market Committee, January 30–31, 2024. Excerpt:
In discussing risk-management considerations that could bear on the policy outlook, participants remarked that while the risks to achieving the Committee's employment and inflation goals were moving into better balance, they remained highly attentive to inflation risks. In particular, they saw upside risks to inflation as having diminished but noted that inflation was still above the Committee's longer-run goal. Some participants noted the risk that progress toward price stability could stall, particularly if aggregate demand strengthened or supply-side healing slowed more than expected. Participants highlighted the uncertainty associated with how long a restrictive monetary policy stance would need to be maintained. Most participants noted the risks of moving too quickly to ease the stance of policy and emphasized the importance of carefully assessing incoming data in judging whether inflation is moving down sustainably to 2 percent. A couple of participants, however, pointed to downside risks to the economy associated with maintaining an overly restrictive stance for too long.
Participants observed that the continuing process of reducing the size of the Federal Reserve's balance sheet was an important part of the Committee's overall approach to achieving its macroeconomic objectives and that balance sheet runoff had so far proceeded smoothly. In light of ongoing reductions in usage of the ON RRP facility, many participants suggested that it would be appropriate to begin in-depth discussions of balance sheet issues at the Committee's next meeting to guide an eventual decision to slow the pace of runoff. Some participants remarked that, given the uncertainty surrounding estimates of the ample level of reserves, slowing the pace of runoff could help smooth the transition to that level of reserves or could allow the Committee to continue balance sheet runoff for longer. In addition, a few participants noted that the process of balance sheet runoff could continue for some time even after the Committee begins to reduce the target range for the federal funds rate.
emphasis added
AIA: "Architecture Billings Index Reports Sluggish Conditions to Start 2024"; Multi-family Billings Decline for 18th Consecutive Month
by Calculated Risk on 2/21/2024 10:49:00 AM
Note: This index is a leading indicator primarily for new Commercial Real Estate (CRE) investment.
From the AIA: AIA/Deltek Architecture Billings Index Reports Sluggish Conditions to Start 2024
Architecture firm billings remained soft entering into 2024, with an AIA/Deltek Architecture Billings Index (ABI) score of 46.2 in January. Any score below 50.0 indicates decreasing business conditions.• Regional averages: Northeast (43.6); Midwest (50.9); South (45.2); West (46.6)
“This now marks the lengthiest period of declining billings since 2010, although it is reassuring that the pace of this decline is less rapid and the broader economy showed improvement in January,” said Kermit Baker, PhD, AIA Chief Economist. "Firms are seeing growth with inquiries into new projects and value of newly signed design contracts is holding steady, showing potential signs of interest from clients in new projects.”
Business conditions remained weak at firms in all regions of the country except the Midwest, where modest growth was seen in three of the last four months. Firms with a multifamily residential specialization continue to report the softest business conditions of all specializations.
emphasis added
• Sector index breakdown: commercial/industrial (47.0); institutional (48.5); mixed practice (firms that do not have at least half of their billings in any one other category) (42.9); multifamily residential (44.6)
 Click on graph for larger image.
This graph shows the Architecture Billings Index since 1996. The index was at 46.2 in January, down from 46.5 in December. Anything below 50 indicates a decrease in demand for architects' services.
Note: This includes commercial and industrial facilities like hotels and office buildings, multi-family residential, as well as schools, hospitals and other institutions.
This index usually leads CRE investment by 9 to 12 months, so this index suggests a slowdown in CRE investment in 2024.
Note that multi-family billing turned down in August 2022 and has been negative for eighteen consecutive months (with revisions). This suggests we will see a further weakness in multi-family starts.
MBA: Mortgage Applications Decreased in Weekly Survey
by Calculated Risk on 2/21/2024 07:00:00 AM
From the MBA: Mortgage Applications Decrease in Latest MBA Weekly Survey
Mortgage applications decreased 10.6 percent from one week earlier, according to data from the Mortgage Bankers Association’s (MBA) Weekly Mortgage Applications Survey for the week ending February 16, 2024.
The Market Composite Index, a measure of mortgage loan application volume, decreased 10.6 percent on a seasonally adjusted basis from one week earlier. On an unadjusted basis, the Index decreased 8 percent compared with the previous week. The Refinance Index decreased 11 percent from the previous week and was 0.1 percent higher than the same week one year ago. The seasonally adjusted Purchase Index decreased 10 percent from one week earlier. The unadjusted Purchase Index decreased 6 percent compared with the previous week and was 13 percent lower than the same week one year ago.
"Mortgage rates moved back above 7 percent last week following news that inflation picked up in January, dimming hopes of a near term rate cut,” said Mike Fratantoni, MBA’s SVP and Chief Economist. “Mortgage applications dropped as a result with a larger decline in refinance applications. Potential homebuyers are quite sensitive to these rate changes, as affordability is strained with both higher rates and higher home values in this supply-constrained market."
...
The average contract interest rate for 30-year fixed-rate mortgages with conforming loan balances ($766,550 or less) increased to 7.06 percent from 6.87 percent, with points increasing to 0.66 from 0.65 (including the origination fee) for 80 percent loan-to-value ratio (LTV) loans.
emphasis added
 Click on graph for larger image.
The first graph shows the MBA mortgage purchase index.
According to the MBA, purchase activity is down 13% year-over-year unadjusted.
Red is a four-week average (blue is weekly).
Purchase application activity is up slightly from the lows in late October 2023, and below the lowest levels during the housing bust. Other than a few weeks last year, this is the lowest level since 1995.

The second graph shows the refinance index since 1990.
With higher mortgage rates, the refinance index declined sharply in 2022, and has mostly flatlined since then.
Tuesday, February 20, 2024
Wednesday: FOMC Minutes, Architecture Billings Index
by Calculated Risk on 2/20/2024 08:18:00 PM
 From Matthew Graham at Mortgage News Daily: Mortgage Rates Modestly Lower To Start The Week
Most mortgage lenders set rates for the first time this week on Tuesday (today) due to yesterday's holiday. ... In the bigger picture, rates are still very close to their highest levels in more than 2 months following a series of higher inflation readings last week. [30 year fixed 7.11%]Wednesday:
emphasis added
• At 7:00 AM ET, The Mortgage Bankers Association (MBA) will release the results for the mortgage purchase applications index.
• During the day, The AIA's Architecture Billings Index for January (a leading indicator for commercial real estate).
• At 2:00 PM, FOMC Minutes, Meeting of Meeting of January 30-31, 2024
MBA Survey: Share of Mortgage Loans in Forbearance Decreases to 0.22% in January
by Calculated Risk on 2/20/2024 04:20:00 PM
From the MBA: Share of Mortgage Loans in Forbearance Decreases Slightly to 0.22% in January
The Mortgage Bankers Association’s (MBA) monthly Loan Monitoring Survey revealed that the total number of loans now in forbearance decreased by 1 basis point from 0.23% of servicers’ portfolio volume in the prior month to 0.22% as of January 31, 2024. According to MBA’s estimate, 110,000 homeowners are in forbearance plans. Mortgage servicers have provided forbearance to approximately 8.1 million borrowers since March 2020.At the end of January, there were about 110,000 homeowners in forbearance plans.
In January 2024, the share of Fannie Mae and Freddie Mac loans in forbearance declined 2 basis points to 0.13%. Ginnie Mae loans in forbearance remained the same at 0.39%, and the forbearance share for portfolio loans and private-label securities (PLS) increased 1 basis point to 0.28%.
“The combination of a potential economic slowdown in 2024, and indications that consumer debt balances and delinquencies are on the rise, could lead to more homeowners struggling to make their mortgage payments and inquire about forbearance and available loan workout options,” said Marina Walsh, CMB, MBA’s Vice President of Industry Analysis. “Most pandemic-related protocols have sunset, which gives mortgage servicers different rules of engagement when it comes to assisting borrowers through loan forbearance or a loan workout.”
emphasis added
Lawler: Update on Invitation Homes Rental Trends
by Calculated Risk on 2/20/2024 02:49:00 PM
Today, in the Calculated Risk Real Estate Newsletter: Lawler: Update on Invitation Homes Rental Trends
A brief excerpt:
From housing economist Tom Lawler:There is much more in the article.
Below is a table derived from the Q4/2023 (and earlier) Earnings Release and Supplemental Information from Invitation Homes, one of the largest institutional investors in single-family rental homes. (The January figures are based on figures from officials on the earnings conference call.)
Note that while the YOY increase in rent renewals last quarter actually rose slightly from the previous quarter, the YOY increase in new leases was zero, and according to officials on the conference call was negative in January.

DOT: Vehicle Miles Driven Increased 2.1% year-over-year in 2023
by Calculated Risk on 2/20/2024 02:19:00 PM
This is something I check occasionally.
The Department of Transportation (DOT) reported:
• Travel on all roads and streets changed by +2.2% (+5.7 billion vehicle miles) for December 2023 as compared with December 2022. Travel for the month is estimated to be 263.7 billion vehicle miles.
• The seasonally adjusted vehicle miles traveled for December 2023 is 273.0 billion miles, a +2.7% ( +7.3 billion vehicle miles) change over December 2022. It also represents a -0.2% change (-0.5 billion vehicle miles) compared with November 2023.
• Cumulative Travel for 2023 changed by +2.1% (+67.5 billion vehicle miles). The cumulative estimate for the year is 3,263.7 billion vehicle miles of travel.
emphasis added
 Click on graph for larger image.
This graph shows the monthly total vehicle miles driven, seasonally adjusted.
Miles driven declined sharply in March 2020, and really collapsed in April 2020. Miles driven are now at pre-pandemic levels.
Single Family Built-for-Rent Almost Doubled Since 2020
by Calculated Risk on 2/20/2024 10:50:00 AM
Today, in the Calculated Risk Real Estate Newsletter: Single Family Built-for-Rent Almost Doubled Since 2020
A brief excerpt:
Along with the monthly housing starts report for January released last week, the Census Bureau also released Housing Units Started by Purpose and Design through Q4 2023.There is much more in the article.
The first graph shows the number of single family and multi-family units started with the intent to rent. This data is quarterly and Not Seasonally Adjusted (NSA). Although the majority of units built-for-rent’ are still multi-family (blue), there has been a significant pickup in single family units started built-for-rent (red).
In 2020, there were 44,000 single family units started with the intent to rent. In 2023, that number almost doubled to 85,000 units. For multi-family, there were 327,000 units started to rent in 2020, and 393,000 in 2023. About 18% of the built-for-rent units started in 2023 were single family units.

Existing Home Sales: Lawler vs. the Consensus
by Calculated Risk on 2/20/2024 08:59:00 AM
Housing economist Tom Lawler has been sending me his predictions of what the NAR will report for almost 14 years. He has graciously allowed me to share his predictions with the readers of this blog.
The table below shows the consensus for each month, Lawler's predictions, and the NAR's initially reported level of sales. Lawler hasn't always been closer than the consensus, but usually when there has been a fairly large spread between Lawler's estimate and the "consensus", Lawler has been closer.
The NAR is scheduled to release Existing Home Sales for January on Thursday at 10:00 AM, February 22nd. The consensus is for 3.97 million SAAR, up from 3.78 million. Tom Lawler estimates the NAR will report sales of 4.02 million SAAR.
Over the last 14 years, the consensus average miss was 140 thousand (median 110 thousand), and Lawler's average miss was 72 thousand (median 60 thousand).
Note on Median Prices: Lawler has also been very close on median prices, and he expects the NAR to report prices up about 5.4% year-over-year.
| Existing Home Sales, Forecasts and NAR Report millions, seasonally adjusted annual rate basis (SAAR) | |||
|---|---|---|---|
| Month | Consensus | Lawler | NAR reported1 |
| May-10 | 6.20 | 5.83 | 5.66 |
| Jun-10 | 5.30 | 5.30 | 5.37 |
| Jul-10 | 4.66 | 3.95 | 3.83 |
| Aug-10 | 4.10 | 4.10 | 4.13 |
| Sep-10 | 4.30 | 4.50 | 4.53 |
| Oct-10 | 4.50 | 4.46 | 4.43 |
| Nov-10 | 4.85 | 4.61 | 4.68 |
| Dec-10 | 4.90 | 5.13 | 5.28 |
| Jan-11 | 5.20 | 5.17 | 5.36 |
| Feb-11 | 5.15 | 5.00 | 4.88 |
| Mar-11 | 5.00 | 5.08 | 5.10 |
| Apr-11 | 5.20 | 5.15 | 5.05 |
| May-11 | 4.75 | 4.80 | 4.81 |
| Jun-11 | 4.90 | 4.71 | 4.77 |
| Jul-11 | 4.92 | 4.69 | 4.67 |
| Aug-11 | 4.75 | 4.92 | 5.03 |
| Sep-11 | 4.93 | 4.83 | 4.91 |
| Oct-11 | 4.80 | 4.86 | 4.97 |
| Nov-11 | 5.08 | 4.40 | 4.42 |
| Dec-11 | 4.60 | 4.64 | 4.61 |
| Jan-12 | 4.69 | 4.66 | 4.57 |
| Feb-12 | 4.61 | 4.63 | 4.59 |
| Mar-12 | 4.62 | 4.59 | 4.48 |
| Apr-12 | 4.66 | 4.53 | 4.62 |
| May-12 | 4.57 | 4.66 | 4.55 |
| Jun-12 | 4.65 | 4.56 | 4.37 |
| Jul-12 | 4.50 | 4.47 | 4.47 |
| Aug-12 | 4.55 | 4.87 | 4.82 |
| Sep-12 | 4.75 | 4.70 | 4.75 |
| Oct-12 | 4.74 | 4.84 | 4.79 |
| Nov-12 | 4.90 | 5.10 | 5.04 |
| Dec-12 | 5.10 | 4.97 | 4.94 |
| Jan-13 | 4.90 | 4.94 | 4.92 |
| Feb-13 | 5.01 | 4.87 | 4.98 |
| Mar-13 | 5.03 | 4.89 | 4.92 |
| Apr-13 | 4.92 | 5.03 | 4.97 |
| May-13 | 5.00 | 5.20 | 5.18 |
| Jun-13 | 5.27 | 4.99 | 5.08 |
| Jul-13 | 5.13 | 5.33 | 5.39 |
| Aug-13 | 5.25 | 5.35 | 5.48 |
| Sep-13 | 5.30 | 5.26 | 5.29 |
| Oct-13 | 5.13 | 5.08 | 5.12 |
| Nov-13 | 5.02 | 4.98 | 4.90 |
| Dec-13 | 4.90 | 4.96 | 4.87 |
| Jan-14 | 4.70 | 4.67 | 4.62 |
| Feb-14 | 4.64 | 4.60 | 4.60 |
| Mar-14 | 4.56 | 4.64 | 4.59 |
| Apr-14 | 4.67 | 4.70 | 4.65 |
| May-14 | 4.75 | 4.81 | 4.89 |
| Jun-14 | 4.99 | 4.96 | 5.04 |
| Jul-14 | 5.00 | 5.09 | 5.15 |
| Aug-14 | 5.18 | 5.12 | 5.05 |
| Sep-14 | 5.09 | 5.14 | 5.17 |
| Oct-14 | 5.15 | 5.28 | 5.26 |
| Nov-14 | 5.20 | 4.90 | 4.93 |
| Dec-14 | 5.05 | 5.15 | 5.04 |
| Jan-15 | 5.00 | 4.90 | 4.82 |
| Feb-15 | 4.94 | 4.87 | 4.88 |
| Mar-15 | 5.04 | 5.18 | 5.19 |
| Apr-15 | 5.22 | 5.20 | 5.04 |
| May-15 | 5.25 | 5.29 | 5.35 |
| Jun-15 | 5.40 | 5.45 | 5.49 |
| Jul-15 | 5.41 | 5.64 | 5.59 |
| Aug-15 | 5.50 | 5.54 | 5.31 |
| Sep-15 | 5.35 | 5.56 | 5.55 |
| Oct-15 | 5.41 | 5.33 | 5.36 |
| Nov-15 | 5.32 | 4.97 | 4.76 |
| Dec-15 | 5.19 | 5.36 | 5.46 |
| Jan-16 | 5.32 | 5.36 | 5.47 |
| Feb-16 | 5.30 | 5.20 | 5.08 |
| Mar-16 | 5.27 | 5.27 | 5.33 |
| Apr-16 | 5.40 | 5.44 | 5.45 |
| May-16 | 5.64 | 5.55 | 5.53 |
| Jun-16 | 5.48 | 5.62 | 5.57 |
| Jul-16 | 5.52 | 5.41 | 5.39 |
| Aug-16 | 5.44 | 5.49 | 5.33 |
| Sep-16 | 5.35 | 5.55 | 5.47 |
| Oct-16 | 5.44 | 5.47 | 5.60 |
| Nov-16 | 5.54 | 5.60 | 5.61 |
| Dec-16 | 5.54 | 5.55 | 5.49 |
| Jan-17 | 5.55 | 5.60 | 5.69 |
| Feb-17 | 5.55 | 5.41 | 5.48 |
| Mar-17 | 5.61 | 5.74 | 5.71 |
| Apr-17 | 5.67 | 5.56 | 5.57 |
| May-17 | 5.55 | 5.65 | 5.62 |
| Jun-17 | 5.58 | 5.59 | 5.52 |
| Jul-17 | 5.57 | 5.38 | 5.44 |
| Aug-17 | 5.48 | 5.39 | 5.35 |
| Sep-17 | 5.30 | 5.38 | 5.39 |
| Oct-17 | 5.30 | 5.60 | 5.48 |
| Nov-17 | 5.52 | 5.77 | 5.81 |
| Dec-17 | 5.75 | 5.66 | 5.57 |
| Jan-18 | 5.65 | 5.48 | 5.38 |
| Feb-18 | 5.42 | 5.44 | 5.54 |
| Mar-18 | 5.28 | 5.51 | 5.60 |
| Apr-18 | 5.60 | 5.48 | 5.46 |
| May-18 | 5.56 | 5.47 | 5.43 |
| Jun-18 | 5.45 | 5.35 | 5.38 |
| Jul-18 | 5.43 | 5.40 | 5.34 |
| Aug-18 | 5.36 | 5.36 | 5.34 |
| Sep-18 | 5.30 | 5.20 | 5.15 |
| Oct-18 | 5.20 | 5.31 | 5.22 |
| Nov-18 | 5.19 | 5.23 | 5.32 |
| Dec-18 | 5.24 | 4.97 | 4.99 |
| Jan-19 | 5.05 | 4.92 | 4.94 |
| Feb-19 | 5.08 | 5.46 | 5.51 |
| Mar-19 | 5.30 | 5.40 | 5.21 |
| Apr-19 | 5.36 | 5.31 | 5.19 |
| May-19 | 5.29 | 5.40 | 5.34 |
| Jun-19 | 5.34 | 5.25 | 5.27 |
| Jul-19 | 5.39 | 5.40 | 5.42 |
| Aug-19 | 5.38 | 5.42 | 5.49 |
| Sep-19 | 5.45 | 5.36 | 5.38 |
| Oct-19 | 5.49 | 5.36 | 5.46 |
| Nov-19 | 5.45 | 5.43 | 5.35 |
| Dec-19 | 5.43 | 5.40 | 5.54 |
| Jan-20 | 5.45 | 5.42 | 5.46 |
| Feb-20 | 5.50 | 5.58 | 5.77 |
| Mar-20 | 5.30 | 5.25 | 5.27 |
| Apr-20 | 4.30 | 4.17 | 4.33 |
| May-20 | 4.38 | 3.80 | 3.91 |
| Jun-20 | 4.86 | 4.65 | 4.72 |
| Jul-20 | 5.39 | 5.85 | 5.86 |
| Aug-20 | 6.00 | 5.92 | 6.00 |
| Sep-20 | 6.25 | 6.38 | 6.54 |
| Oct-20 | 6.45 | 6.63 | 6.85 |
| Nov-20 | 6.70 | 6.50 | 6.69 |
| Dec-20 | 6.55 | 6.62 | 6.76 |
| Jan-21 | 6.60 | 6.48 | 6.69 |
| Feb-21 | 6.51 | 6.29 | 6.22 |
| Mar-21 | 6.17 | 6.02 | 6.01 |
| Apr-21 | 6.09 | 5.96 | 5.85 |
| May-21 | 5.74 | 5.78 | 5.80 |
| Jun-21 | 5.90 | 5.79 | 5.86 |
| Jul-21 | 5.84 | 5.86 | 5.99 |
| Aug-21 | 5.88 | 5.90 | 5.88 |
| Sep-21 | 6.06 | 6.20 | 6.29 |
| Oct-21 | 6.20 | 6.34 | 6.34 |
| Nov-21 | 6.20 | 6.45 | 6.46 |
| Dec-21 | 6.45 | 6.33 | 6.18 |
| Jan-22 | 6.12 | 6.36 | 6.50 |
| Feb-22 | 6.16 | 5.97 | 6.02 |
| Mar-22 | 5.80 | 5.74 | 5.77 |
| Apr-22 | 5.62 | 5.57 | 5.61 |
| May-22 | 5.41 | 5.35 | 5.41 |
| Jun-22 | 5.40 | 5.12 | 5.12 |
| Jul-22 | 4.88 | 4.90 | 4.81 |
| Aug-22 | 4.70 | 4.84 | 4.80 |
| Sep-22 | 4.69 | 4.82 | 4.71 |
| Oct-22 | 4.39 | 4.49 | 4.43 |
| Nov-22 | 4.20 | 4.16 | 4.09 |
| Dec-22 | 3.95 | 3.96 | 4.02 |
| Jan-23 | 4.10 | 4.18 | 4.00 |
| Feb-23 | 4.18 | 4.51 | 4.58 |
| Mar-23 | 4.50 | 4.51 | 4.44 |
| Apr-23 | 4.30 | 4.33 | 4.28 |
| May-23 | 4.24 | 4.25 | 4.30 |
| Jun-23 | 4.23 | 4.26 | 4.16 |
| Jul-23 | 4.15 | 4.06 | 4.07 |
| Aug-23 | 4.10 | 4.07 | 4.04 |
| Sep-23 | 3.94 | 4.00 | 3.96 |
| Oct-23 | 3.93 | 3.94 | 3.79 |
| Nov-23 | 3.78 | 3.87 | 3.82 |
| Dec-23 | 3.84 | 3.84 | 3.78 |
| Jan-24 | 3.97 | 4.02 | NA |
| 1NAR initially reported before revisions. | |||


