 RSS Feed
 by Calculated Risk on 7/31/2022 09:02:00 PM
Sunday, July 31, 2022
Monday: ISM Mfg, Construction Spending
Weekend:
• Schedule for Week of July 31, 2022
Monday:
• (likely, might be Tuesday) At 8:00 AM ET, Corelogic House Price index for June
• 10:00 AM, ISM Manufacturing Index for July. The consensus is for the ISM to be at 52.0, down from 53.0 in June.
• 10:00 AM, Construction Spending for June. The consensus is for a 0.2% increase in construction spending.
• 2:00 PM, Senior Loan Officer Opinion Survey on Bank Lending Practices for July.
From CNBC: Pre-Market Data and Bloomberg futures S&P 500 are down 15 and DOW futures are down 112 (fair value).
Oil prices were mixed over the last week with WTI futures at $98.62 per barrel and Brent at $103.97 per barrel. A year ago, WTI was at $74, and Brent was at $78 - so WTI oil prices are up 33% year-over-year.
Here is a graph from Gasbuddy.com for nationwide gasoline prices. Nationally prices are at $4.18 per gallon. A year ago, prices were at $3.16 per gallon, so gasoline prices are up $1.02 per gallon year-over-year.
30-Year Mortgage Rates Decrease to 5.13%
by Calculated Risk on 7/31/2022 10:51:00 AM
After reaching 6.28% on June 14th, 30-year mortgage rates decreased to 5.13% on Friday according to Mortgagenewsdaily.com. The 10-year Treasury yield has fallen to 2.66%, likely due to the weaker economy.
 Here is a graph from Mortgagenewsdaily.com that shows the 30-year mortgage rate since 2017.
Although mortgage rates have fallen sharply over the last 6 weeks, rates are still much higher than earlier this year.
Last year, in July 2021, 30-year mortgage rates average 2.87% according to the Freddie Mac PMMS. So, rates are up 79% year-over-year!
Saturday, July 30, 2022
Real Estate Newsletter Articles this Week
by Calculated Risk on 7/30/2022 02:11:00 PM
At the Calculated Risk Real Estate Newsletter this week:
• New Home Sales Decrease Sharply, Record Months of Unsold Inventory Under Construction
• Case-Shiller National Index up 19.7% Year-over-year in May
• Will Housing Inventory Follow the Normal Seasonal Pattern?
• Real House Prices and Price-to-Rent Ratio in May
• Median vs Repeat Sales Index House Prices
• Rent Increases Up Sharply Year-over-year, Pace Continues to Slow
This is usually published 4 to 6 times a week and provides more in-depth analysis of the housing market.
You can subscribe at https://calculatedrisk.substack.com/
Most content is available for free (and no Ads), but please subscribe!
Schedule for Week of July 31, 2022
by Calculated Risk on 7/30/2022 08:11:00 AM
The key report this week is the July employment report.
Other key reports include ISM manufacturing and services indexes, July vehicle sales, and the Trade deficit for June.
8:00 AM ET: Corelogic House Price index for June
10:00 AM: ISM Manufacturing Index for July. The consensus is for the ISM to be at 52.0, down from 53.0 in June.
10:00 AM: Construction Spending for June. The consensus is for a 0.2% increase in construction spending.
2:00 PM: Senior Loan Officer Opinion Survey on Bank Lending Practices for July.
 10:00 AM ET: Job Openings and Labor Turnover Survey for June from the BLS.
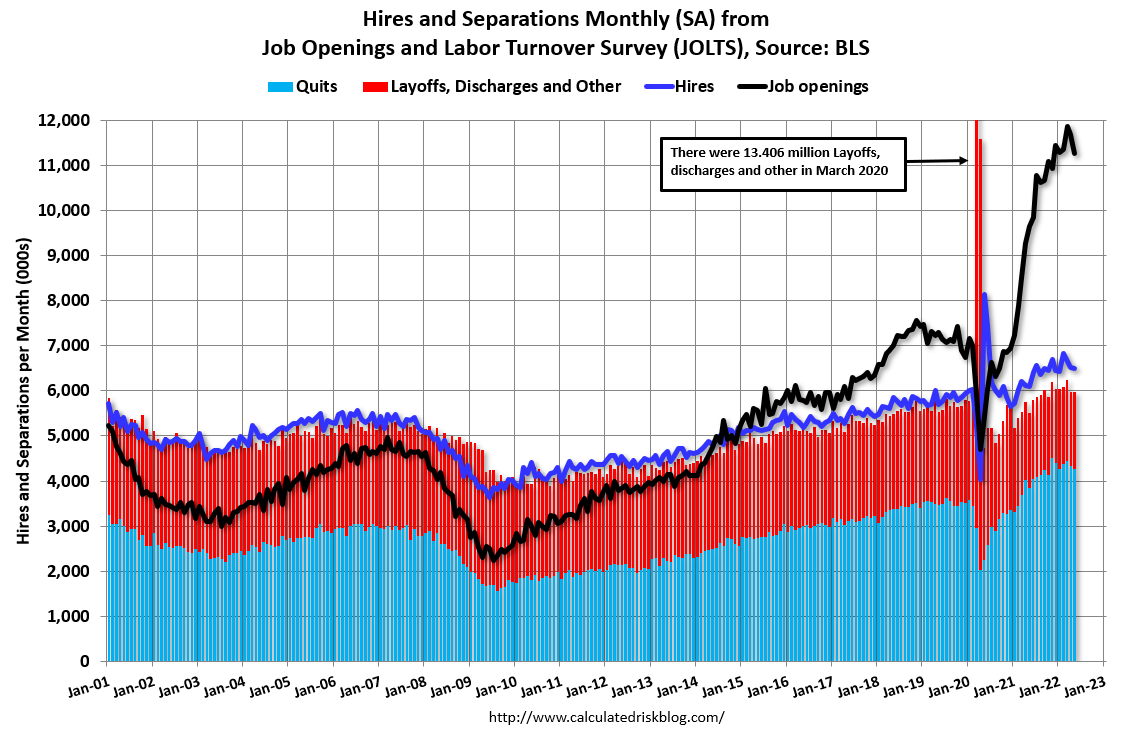
 This graph shows job openings (yellow line), hires (purple), Layoff, Discharges and other (red column), and Quits (light blue column) from the JOLTS.
Jobs openings decreased in May to 11.254 million from 11.681 million in April.
The number of job openings (yellow) were up 17% year-over-year and Quits were up 11% year-over-year.
10:00 AM: the Q2 2022 Housing Vacancies and Homeownership from the Census Bureau.
11:00 AM: NY Fed: Q2 Quarterly Report on Household Debt and Credit
 All Day: Light vehicle sales for July from the BEA. The consensus is for light vehicle sales to be 13.5 million SAAR in July, up from 13.0 million in June (Seasonally Adjusted Annual Rate).
This graph shows light vehicle sales since the BEA started keeping data in 1967. The dashed line is the sales rate for last month.
7:00 AM ET: The Mortgage Bankers Association (MBA) will release the results for the mortgage purchase applications index.
10:00 AM: the ISM Services Index for July. The consensus is for a reading of 53.5, down from 55.3.
 8:30 AM: Trade Balance report for June from the Census Bureau.
 This graph shows the U.S. trade deficit, with and without petroleum, through the most recent report. The blue line is the total deficit, and the black line is the petroleum deficit, and the red line is the trade deficit ex-petroleum products.
The consensus is the trade deficit to be $80.1 billion. The U.S. trade deficit was at $85.5 Billion the previous month.
8:30 AM: The initial weekly unemployment claims report will be released. The consensus is for 265 thousand up from 256 thousand last week.
 8:30 AM: Employment Report for July. The consensus is for 250,000 jobs added, and for the unemployment rate to be unchanged at 3.6%.
There were 372,000 jobs added in June, and the unemployment rate was at 3.6%.
This graph shows the job losses from the start of the employment recession, in percentage terms.
The current employment recession was by far the worst recession since WWII in percentage terms. However, the current employment recession, 28 months after the onset, has recovered quicker than the previous two recessions.
Friday, July 29, 2022
COVID July 29, 2022, Update on Cases, Hospitalizations and Deaths
by Calculated Risk on 7/29/2022 09:01:00 PM
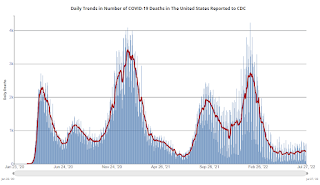
On COVID (focus on hospitalizations and deaths):
Hospitalizations have almost quadrupled from the lows in April 2022.
 Click on graph for larger image.
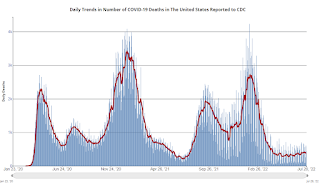
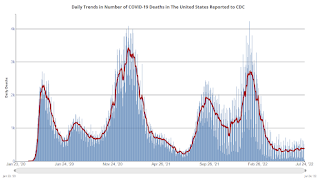
This graph shows the daily (columns) and 7-day average (line) of deaths reported.
| COVID Metrics | ||||
|---|---|---|---|---|
| Now | Week Ago | Goal | ||
| New Cases per Day2 | 125,355 | 128,981 | ≤5,0001 | |
| Hospitalized2🚩 | 37,013 | 35,853 | ≤3,0001 | |
| Deaths per Day2 | 373 | 396 | ≤501 | |
| 1my goals to stop daily posts, 27-day average for Cases, Currently Hospitalized, and Deaths 🚩 Increasing 7-day average week-over-week for Cases, Hospitalized, and Deaths ✅ Goal met. | ||||
 Click on graph for larger image.
This graph shows the daily (columns) and 7-day average (line) of deaths reported.
Average daily deaths bottomed in July 2021 at 214 per day.
Fannie Mae: Mortgage Serious Delinquency Rate Decreased in June
by Calculated Risk on 7/29/2022 05:39:00 PM
Fannie Mae reported that the Single-Family Serious Delinquency decreased to 0.81% in June from 0.87% in May. The serious delinquency rate is down from 2.08% in June 2021. This is almost back to pre-pandemic levels.
These are mortgage loans that are "three monthly payments or more past due or in foreclosure".
The Fannie Mae serious delinquency rate peaked in February 2010 at 5.59% following the housing bubble and peaked at 3.32% in August 2020 during the pandemic.
 Click on graph for larger image
By vintage, for loans made in 2004 or earlier (1% of portfolio), 2.75% are seriously delinquent (down from 2.86% in May).
For loans made in 2005 through 2008 (1% of portfolio), 4.45% are seriously delinquent (down from 4.67%),
For recent loans, originated in 2009 through 2021 (97% of portfolio), 0.63% are seriously delinquent (down from 0.69%). So, Fannie is still working through a few poor performing loans from the bubble years.
Mortgages in forbearance are counted as delinquent in this monthly report, but they will not be reported to the credit bureaus.
The pandemic related increase in delinquencies was very different from the increase in delinquencies following the housing bubble. Lending standards had been fairly solid over the previous decade, and most of these homeowners had equity in their homes - and the vast majority of these homeowners have been able to restructure their loans once they were employed.
Freddie Mac reported earlier.
Rent Increases Up Sharply Year-over-year, Pace Continues to Slow
by Calculated Risk on 7/29/2022 12:35:00 PM
Today, in the Calculated Risk Real Estate Newsletter: Rent Increases Up Sharply Year-over-year, Pace Continues to Slow
A brief excerpt:
Here is a graph of the year-over-year (YoY) change for these measures since January 2015. All of these measures are through June 2022 (Apartment List through July 2022).There is much more in the article. You can subscribe at https://calculatedrisk.substack.com/
Note that new lease measures (Zillow, Apartment List) dipped early in the pandemic, whereas the BLS measures were steady. Then new leases took off, and the BLS measures are picking up.
...
The Zillow measure is up 14.8% YoY in June, down from 16.0% YoY in May. This is down from a peak of 17.2% YoY in February.
The ApartmentList measure is up 12.4% YoY as of July, down from 14.1% in June. This is down from the peak of 18.0% YoY last December.
Clearly rents are still increasing, and we should expect this to continue to spill over into measures of inflation in 2022. The Owners’ Equivalent Rent (OER) was up 5.5% YoY in June, from 5.1% YoY in May - and will likely increase further in the coming months.
My suspicion is rent increases will slow over the coming months as the pace of household formation slows, and more supply comes on the market.

Q2 2022 GDP Details on Residential and Commercial Real Estate
by Calculated Risk on 7/29/2022 11:16:00 AM
The BEA released the underlying details for the Q2 advance GDP report this morning.
The BEA reported that investment in non-residential structures decreased at a 11.7% annual pace in Q2.
Investment in petroleum and natural gas structures increased in Q2 compared to Q1 and was up 31% year-over-year.
 Click on graph for larger image.
The first graph shows investment in offices, malls and lodging as a percent of GDP.
Investment in offices (blue) increased slightly in Q2 and was up 5.7% year-over-year. (Still declining as a percent of GDP).
Investment in multimerchandise shopping structures (malls) peaked in 2007 and was up about 10% year-over-year in Q2 - from a very low level. The vacancy rate for malls is still very high, so investment will probably stay low for some time.
Lodging investment increased slightly in Q2 compared to Q1, and lodging investment was down 2% year-over-year.
All three sectors - offices, malls, and hotels - were hurt significantly by the pandemic.
 The second graph is for Residential investment components as a percent of GDP. According to the Bureau of Economic Analysis, RI includes new single-family structures, multifamily structures, home improvement, Brokers’ commissions and other ownership transfer costs, and a few minor categories (dormitories, manufactured homes).
Even though investment in single family structures has increased from the bottom, single family investment is just approaching normal levels as a percent of GDP.
Investment in single family structures was $473 billion (SAAR) (about 1.9% of GDP), and up 17% year-over-year.
Investment in multi-family structures was unchanged in Q2 from Q1.
Investment in home improvement was at a $347 billion Seasonally Adjusted Annual Rate (SAAR) in Q2 (about 1.4% of GDP). Home improvement spending was strong during the pandemic.
Note that Brokers' commissions (black) increased sharply last year as existing home sales increased in the second half of 2020 but was down in Q2 2022. Brokers' commissions were unchanged year-over-year in Q4 (down as a percent of GDP).
Hotels: Occupancy Rate Down 6.0% Compared to Same Week in 2019
by Calculated Risk on 7/29/2022 10:26:00 AM
U.S. hotel performance increased from the previous week, according to STR‘s latest data through July 23.The following graph shows the seasonal pattern for the hotel occupancy rate using the four-week average.
July 17-23, 2022 (percentage change from comparable week in 2019*):
• Occupancy: 72.8% (-6.0%)
• Average daily rate (ADR): $158.79 (+16.4%)
• Revenue per available room (RevPAR): $115.59 (+9.3%)
*Due to the pandemic impact, STR is measuring recovery against comparable time periods from 2019.
emphasis added
 Click on graph for larger image.
The red line is for 2022, black is 2020, blue is the median, and dashed light blue is for 2021. Dashed purple is 2019 (STR is comparing to a strong year for hotels).
The 4-week average of the occupancy rate is just below the median rate for the previous 20 years (Blue).
Note: Y-axis doesn't start at zero to better show the seasonal change.
The 4-week average of the occupancy rate will peak in seasonally in a few weeks.
Personal Income increased 0.6% in June; Spending increased 1.1%
by Calculated Risk on 7/29/2022 08:37:00 AM
The BEA released the Personal Income and Outlays report for June:
Personal income increased $133.5 billion (0.6 percent) in June, according to estimates released today by the Bureau of Economic Analysis. Disposable personal income (DPI) increased $120.4 billion (0.7 percent) and personal consumption expenditures (PCE) increased $181.1 billion (1.1 percent).The June PCE price index increased 6.8 percent year-over-year (YoY), up from 6.3 percent YoY in May.
The PCE price index increased 1.0 percent. Excluding food and energy, the PCE price index increased 0.6 percent. Real DPI decreased 0.3 percent in June and real PCE increased 0.1 percent; goods increased 0.1 percent and services increased 0.1 percent.
emphasis added
The PCE price index, excluding food and energy, increased 4.8 percent YoY, up from 4.7 percent in May.
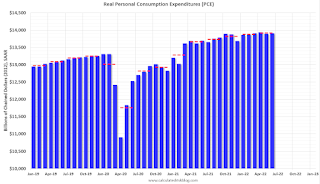
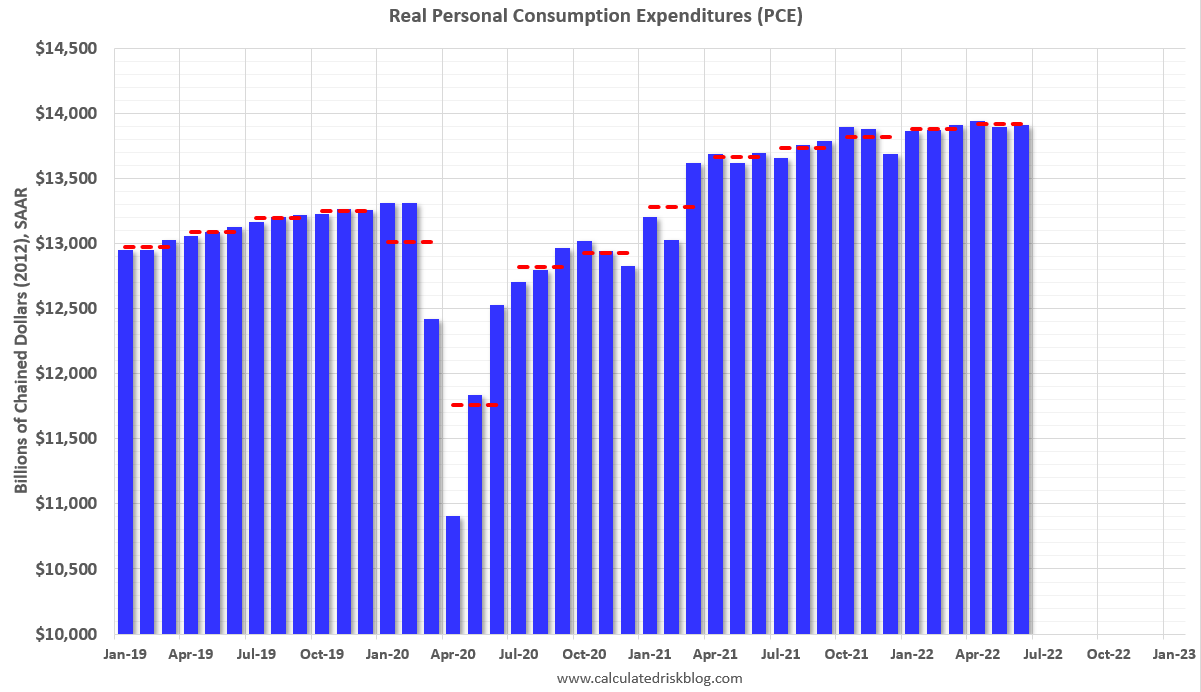
The following graph shows real Personal Consumption Expenditures (PCE) through June 2022 (2012 dollars). Note that the y-axis doesn't start at zero to better show the change.
 Click on graph for larger image.
The dashed red lines are the quarterly levels for real PCE.
Personal income and the increase in PCE were both above expectations.
Inflation was above expectations.
Thursday, July 28, 2022
Friday: June Personal Income and Outlays
by Calculated Risk on 7/28/2022 09:01:00 PM
 Friday:
• At 8:30 AM ET, Personal Income and Outlays, June 2022. The consensus is for a 0.5% increase in personal income, and for a 0.9% increase in personal spending. And for the Core PCE price index to increase 0.5%. PCE prices are expected to be up 6.6% YoY, and core PCE prices up 4.7% YoY.
• At 9:45 AM, Chicago Purchasing Managers Index for July.
• At 10:00 AM, University of Michigan's Consumer sentiment index (Final for July). The consensus is for a reading of 51.1.
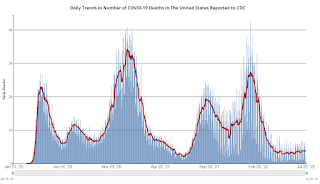
On COVID (focus on hospitalizations and deaths):
Hospitalizations have almost quadrupled from the lows in April 2022.
 Click on graph for larger image.
This graph shows the daily (columns) and 7-day average (line) of deaths reported.
| COVID Metrics | ||||
|---|---|---|---|---|
| Now | Week Ago | Goal | ||
| New Cases per Day2 | 126,272 | 127,478 | ≤5,0001 | |
| Hospitalized2🚩 | 37,069 | 35,500 | ≤3,0001 | |
| Deaths per Day2 | 364 | 382 | ≤501 | |
| 1my goals to stop daily posts, 27-day average for Cases, Currently Hospitalized, and Deaths 🚩 Increasing 7-day average week-over-week for Cases, Hospitalized, and Deaths ✅ Goal met. | ||||
 Click on graph for larger image.
This graph shows the daily (columns) and 7-day average (line) of deaths reported.
Average daily deaths bottomed in July 2021 at 214 per day.
Las Vegas June 2022: Visitor Traffic Down 7.8% Compared to 2019
by Calculated Risk on 7/28/2022 03:18:00 PM
Note: I like using Las Vegas as a measure of recovery for both leisure (visitors) and business (conventions).
From the Las Vegas Visitor Authority: May 2022 Las Vegas Visitor Statistics
Las Vegas saw another strong month of visitation in June as the destination hosted over 3.3M visitors, about 12% ahead of last June but approx. 8% behind June 2019.
With room inventory reflecting the net impacts of the openings of the Virgin Hotel Las Vegas and Resorts World since the middle of last year, overall hotel occupancy reached 82.7%, 6.8 pts ahead of last June but down 9.0 pts vs. June 2019. Weekend occupancy welcomed a fourth consecutive month at or above 90% and Midweek occupancy reached 80% for the first time since February 2020 (up 9.1 pts YoY but down 9.7 pts vs. June 2019).
ADR approached $157, 22.7% ahead of last June and over 30% above June 2019 while RevPAR neared $130 for the month, +33.7% YoY and +17.5% over June 2019.
 Click on graph for larger image.
 The first graph shows visitor traffic for 2019 (dark blue), 2020 (light blue), 2021 (yellow) and 2022 (red)
Visitor traffic was down 7.8% compared to the same month in 2019.
Visitor traffic was up 12% compared to last June.
The second graph shows convention traffic.
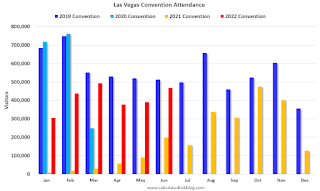
Convention traffic was down 8.7% compared to June 2019.The second graph shows convention traffic.

Note: There was almost no convention traffic from April 2020 through May 2021.
Median vs Repeat Sales Index House Prices
by Calculated Risk on 7/28/2022 01:14:00 PM
Today, in the Calculated Risk Real Estate Newsletter: Median vs Repeat Sales Index House Prices
Excerpt:
Perhaps the timeliest house price report for existing homes is the monthly existing home sales report from the National Association of Realtors® (NAR). Each month the NAR reports the median prices for closed sales. Note: Median prices are distorted by the mix (repeat sales indexes like Case-Shiller and FHFA are probably better for measuring prices).
But even the median price is lagged. For example, the recently released June report was mostly for contracts signed in April and May.
Here is a graph comparing the YoY change in the NAR median prices vs the Case-Shiller National Index:
The YoY change in the median price peaked at 25.2% in May 2021 and slowed to 13.3% in June (still very strong increase in YoY prices). The median price is not seasonally adjusted, and typically declines in July, and I expect a larger than normal decline this July.
In general, the median price leads the Case-Shiller index, and I expect the Case-Shiller to show significantly slower YoY growth over the next several months.

There is much more in the article. You can subscribe at https://calculatedrisk.substack.com/
A Few Comments on Q2 GDP and Investment
by Calculated Risk on 7/28/2022 10:00:00 AM
Note: The second graph - residential investment as a percent of GDP - is useful in predicting a Fed induced recession. RI as a percent of GDP usually turns down well in advance of a recession. This will be something to watch.
Earlier from the BEA: Gross Domestic Product, Second Quarter 2022 (Advance Estimate)
Real gross domestic product (GDP) decreased at an annual rate of 0.9 percent in the second quarter of 2022, according to the "advance" estimate released by the Bureau of Economic Analysis. In the first quarter, real GDP decreased 1.6 percent. ...The advance Q2 GDP report, at -0.9% annualized, was below expectations, primarily due to a negative impact from a decrease in inventories.
The decrease in real GDP reflected decreases in private inventory investment, residential fixed investment, federal government spending, state and local government spending, and nonresidential fixed investment that were partly offset by increases in exports and personal consumption expenditures (PCE). Imports, which are a subtraction in the calculation of GDP, increased.
emphasis added
Personal consumption expenditures (PCE) increased at a 1.0% annualized rate in Q2.
The graph below shows the contribution to GDP from residential investment, equipment and software, and nonresidential structures (3 quarter trailing average). This is important to follow because residential investment tends to lead the economy, equipment and software is generally coincident, and nonresidential structure investment trails the economy.
In the graph, red is residential, green is equipment and software, and blue is investment in non-residential structures. So, the usual pattern - both into and out of recessions is - red, green, blue.
Of course - with the sudden economic stop due to COVID-19 - the usual pattern didn't apply.
The dashed gray line is the contribution from the change in private inventories.
 Click on graph for larger image.
Residential investment (RI) decreased at a 14.0% annual rate in Q2. Equipment investment decreased at a 2.7% annual rate, and investment in non-residential structures decreased at a 11.7% annual rate.
The contribution to Q2 GDP from investment in private inventories was -2.01 percentage points.
On a 3-quarter trailing average basis, RI (red) is down, equipment (green) is up, and nonresidential structures (blue) is still down.
On a 3-quarter trailing average basis, RI (red) is down, equipment (green) is up, and nonresidential structures (blue) is still down.
I'll post more on the components of non-residential investment once the supplemental data is released.
 The second graph shows residential investment as a percent of GDP.
Residential Investment as a percent of GDP decreased in Q2.
I'll break down Residential Investment into components after the GDP details are released.
Note: Residential investment (RI) includes new single-family structures, multifamily structures, home improvement, broker's commissions, and a few minor categories.
 The third graph shows non-residential investment in
structures, equipment and "intellectual property products".
The third graph shows non-residential investment in
structures, equipment and "intellectual property products".
Investment in non-residential structures decreased in Q2 as a percent GDP.
BEA: Real GDP decreased at 0.9% Annualized Rate in Q2
by Calculated Risk on 7/28/2022 08:38:00 AM
From the BEA: Gross Domestic Product, Second Quarter 2022 (Advance Estimate)
Real gross domestic product (GDP) decreased at an annual rate of 0.9 percent in the second quarter of 2022, according to the "advance" estimate released by the Bureau of Economic Analysis. In the first quarter, real GDP decreased 1.6 percent. ...PCE increased at a 1.0% rate, and residential investment decreased at a 14.0% rate. Change in private inventories was a huge drag in Q2, subtracting 2.01 percentage points. The advance Q2 GDP report, with 0.9% annualized decline, was below expectations.
The decrease in real GDP reflected decreases in private inventory investment, residential fixed investment, federal government spending, state and local government spending, and nonresidential fixed investment that were partly offset by increases in exports and personal consumption expenditures (PCE). Imports, which are a subtraction in the calculation of GDP, increased.
emphasis added
I'll have more later ...
Weekly Initial Unemployment Claims at 256,000
by Calculated Risk on 7/28/2022 08:34:00 AM
The DOL reported:
In the week ending July 23, the advance figure for seasonally adjusted initial claims was 256,000, a decrease of 5,000 from the previous week's revised level. The previous week's level was revised up by 10,000 from 251,000 to 261,000. The 4-week moving average was 249,250, an increase of 6,250 from the previous week's revised average. The previous week's average was revised up by 2,500 from 240,500 to 243,000.The following graph shows the 4-week moving average of weekly claims since 1971.
emphasis added
 Click on graph for larger image.
The dashed line on the graph is the current 4-week average. The four-week average of weekly unemployment claims increased to 249,250.
The previous week was revised up.
Weekly claims were higher than the consensus forecast.
Wednesday, July 27, 2022
Thursday: Q2 GDP, Unemployment Claims
by Calculated Risk on 7/27/2022 09:01:00 PM
Thursday:
• At 8:30 AM ET, the initial weekly unemployment claims report will be released. The consensus is for 248 thousand down from 251 thousand last week.
• Also, at 8:30 AM, Gross Domestic Product, 2nd quarter (advance estimate), and annual update. The consensus is that real GDP increased 0.4% annualized in Q2, up from -1.6% in Q1.
• At 11:00 AM, Kansas City Fed Survey of Manufacturing Activity for July. This is the last of the regional surveys for July.
On COVID (focus on hospitalizations and deaths):
Hospitalizations have almost quadrupled from the lows in April 2022.
 Click on graph for larger image.
This graph shows the daily (columns) and 7-day average (line) of deaths reported.
| COVID Metrics | ||||
|---|---|---|---|---|
| Now | Week Ago | Goal | ||
| New Cases per Day2🚩 | 127,786 | 126,610 | ≤5,0001 | |
| Hospitalized2🚩 | 36,909 | 35,126 | ≤3,0001 | |
| Deaths per Day2 | 366 | 391 | ≤501 | |
| 1my goals to stop daily posts, 27-day average for Cases, Currently Hospitalized, and Deaths 🚩 Increasing 7-day average week-over-week for Cases, Hospitalized, and Deaths ✅ Goal met. | ||||
 Click on graph for larger image.
This graph shows the daily (columns) and 7-day average (line) of deaths reported.
Average daily deaths bottomed in July 2021 at 214 per day.
FOMC Statement: Raise Rates 75 bp; "Ongoing increases appropriate"
by Calculated Risk on 7/27/2022 02:02:00 PM
Fed Chair Powell press conference video here or on YouTube here, starting at 2:30 PM ET.
FOMC Statement:
Recent indicators of spending and production have softened. Nonetheless, job gains have been robust in recent months, and the unemployment rate has remained low. Inflation remains elevated, reflecting supply and demand imbalances related to the pandemic, higher food and energy prices, and broader price pressures.
Russia's war against Ukraine is causing tremendous human and economic hardship. The war and related events are creating additional upward pressure on inflation and are weighing on global economic activity. The Committee is highly attentive to inflation risks.
The Committee seeks to achieve maximum employment and inflation at the rate of 2 percent over the longer run. In support of these goals, the Committee decided to raise the target range for the federal funds rate to 2-1/4 to 2-1/2 percent and anticipates that ongoing increases in the target range will be appropriate. In addition, the Committee will continue reducing its holdings of Treasury securities and agency debt and agency mortgage-backed securities, as described in the Plans for Reducing the Size of the Federal Reserve's Balance Sheet that were issued in May. The Committee is strongly committed to returning inflation to its 2 percent objective.
In assessing the appropriate stance of monetary policy, the Committee will continue to monitor the implications of incoming information for the economic outlook. The Committee would be prepared to adjust the stance of monetary policy as appropriate if risks emerge that could impede the attainment of the Committee's goals. The Committee's assessments will take into account a wide range of information, including readings on public health, labor market conditions, inflation pressures and inflation expectations, and financial and international developments.
Voting for the monetary policy action were Jerome H. Powell, Chair; John C. Williams, Vice Chair; Michael S. Barr; Michelle W. Bowman; Lael Brainard; James Bullard; Susan M. Collins; Lisa D. Cook; Esther L. George; Philip N. Jefferson; Loretta J. Mester; and Christopher J. Waller.
emphasis added
Real House Prices and Price-to-Rent Ratio in May
by Calculated Risk on 7/27/2022 11:30:00 AM
Today, in the Calculated Risk Real Estate Newsletter: Real House Prices and Price-to-Rent Ratio in May
Excerpt:
It has been over 16 years since the bubble peak. In the Case-Shiller release yesterday, the seasonally adjusted National Index (SA), was reported as being 65% above the bubble peak in 2006. However, in real terms, the National index (SA) is about 16% above the bubble peak (and historically there has been an upward slope to real house prices). The composite 20, in real terms, is about 7% above the bubble peak.
People usually graph nominal house prices, but it is also important to look at prices in real terms (inflation adjusted). As an example, if a house price was $200,000 in January 2000, the price would be almost $334,000 today adjusted for inflation (67% increase). That is why the second graph below is important - this shows "real" prices (adjusted for inflation). ...
The second graph shows the same two indexes in real terms (adjusted for inflation using CPI less Shelter). Note: some people use other inflation measures to adjust for real prices.
In real terms, the National index is 16.0% above the bubble peak, and the Composite 20 index is 7.4% above the bubble peak in early 2006.In real terms, house prices are now above the previous peak levels. There is an upward slope to real house prices, and it has been over 16 years since the previous peak, but real prices appear historically high (Of course interest rates had been very low).

There is much more in the article. You can subscribe at https://calculatedrisk.substack.com/
NAR: Pending Home Sales Decreased 8.6% in June
by Calculated Risk on 7/27/2022 10:07:00 AM
From the NAR: Pending Home Sales Fell 8.6% in June
Pending home sales decreased in June, following a slight increase in May, according to the National Association of REALTORS®. All four major regions posted month-over-month and year-over-year pullbacks, the largest of which occurred in the West.This was well below expectations for this index. Note: Contract signings usually lead sales by about 45 to 60 days, so this would usually be for closed sales in July and August.
The Pending Home Sales Index (PHSI), a forward-looking indicator of home sales based on contract signings, dipped 8.6% to 91.0 in June. Year-over-year, transactions shrank 20.0%. An index of 100 is equal to the level of contract activity in 2001.
"Contract signings to buy a home will keep tumbling down as long as mortgage rates keep climbing, as has happened this year to date," said NAR Chief Economist Lawrence Yun. "There are indications that mortgage rates may be topping or very close to a cyclical high in July. If so, pending contracts should also begin to stabilize."
According to NAR, buying a home in June was about 80% more expensive than in June 2019. Nearly a quarter of buyers who purchased a home three years ago would be unable to do so now because they no longer earn the qualifying income to buy a median-priced home today.
...
The Northeast PHSI slid 6.7% compared to last month to 80.9, down 17.6% from June 2021. The Midwest index dropped 3.8% to 93.7 in June, a 13.4% decline from a year ago.
The South PHSI slipped 8.9% to 108.3 in June, a decrease of 19.2% from the previous year. The West index slumped 15.9% in June to 68.7, down 30.9% from June 2021.
emphasis added
MBA: Mortgage Applications Decrease in Latest Weekly Survey
by Calculated Risk on 7/27/2022 07:00:00 AM
From the MBA: Mortgage Applications Decrease in Latest MBA Weekly Survey
Mortgage applications decreased 1.8 percent from one week earlier, according to data from the Mortgage Bankers Association’s (MBA) Weekly Mortgage Applications Survey for the week ending July 22, 2022.
... The Refinance Index decreased 4 percent from the previous week and was 83 percent lower than the same week one year ago. The seasonally adjusted Purchase Index decreased 1 percent from one week earlier. The unadjusted Purchase Index decreased 0.4 percent compared with the previous week and was 18 percent lower than the same week one year ago.
“Mortgage applications declined for the fourth consecutive week to the lowest level of activity since February 2000. Increased economic uncertainty and prevalent affordability challenges are dissuading households from entering the market, leading to declining purchase activity that is close to lows last seen at the onset of the pandemic,” said Joel Kan, MBA’s Associate Vice President of Economic and Industry Forecasting. “Weakening purchase applications trends in recent months have been consistent with data showing a slowdown in sales for newly constructed homes and existing homes. A potential silver lining for the housing market is that stabilizing mortgage rates and increases in for-sale inventory may bring some buyers back to the market during the second half of the year.”
Added Kan, “With mortgage rates remaining well over 5 percent, refinance applications are now 83 percent below last year’s pace.”
...
The average contract interest rate for 30-year fixed-rate mortgages with conforming loan balances ($647,200 or less) decreased to 5.74 percent from 5.82 percent, with points decreasing to 0.61 from 0.65 (including the origination fee) for 80 percent loan-to-value ratio (LTV) loans.
emphasis added
 Click on graph for larger image.
The first graph shows the refinance index since 1990.
With higher mortgage rates, the refinance index has declined sharply over the last several months.
The refinance index is at the lowest level since the year 2000.
The second graph shows the MBA mortgage purchase index
 According to the MBA, purchase activity is down 18% year-over-year unadjusted.
The purchase index is now only 13% above the pandemic low.
Note: Red is a four-week average (blue is weekly).
Note: Red is a four-week average (blue is weekly).
Tuesday, July 26, 2022
Wednesday: FOMC Statement, Durable Goods, Pending Home Sales
by Calculated Risk on 7/26/2022 09:02:00 PM
Wednesday:
• At 7:00 AM ET, The Mortgage Bankers Association (MBA) will release the results for the mortgage purchase applications index.
• At 8:30 AM, Durable Goods Orders for June from the Census Bureau. The consensus is for a 0.5% decrease in durable goods orders.
• At 10:00 AM, Pending Home Sales Index for June. The consensus is for a 3.7% decrease in the index.
• At 2:00 PM, FOMC Meeting Announcement. The FOMC is expected to raise rates 75 bps, increasing the target range for the federal funds rate to 2‑1/4 to 2-1/2 percent.
• At 2:30 PM, Fed Chair Jerome Powell holds a press briefing following the FOMC announcement.
On COVID (focus on hospitalizations and deaths):
Hospitalizations have almost quadrupled from the lows in April 2022.
 Click on graph for larger image.
This graph shows the daily (columns) and 7-day average (line) of deaths reported.
| COVID Metrics | ||||
|---|---|---|---|---|
| Now | Week Ago | Goal | ||
| New Cases per Day2 | 124,549 | 127,314 | ≤5,0001 | |
| Hospitalized2🚩 | 36,312 | 34,737 | ≤3,0001 | |
| Deaths per Day2 | 367 | 384 | ≤501 | |
| 1my goals to stop daily posts, 27-day average for Cases, Currently Hospitalized, and Deaths 🚩 Increasing 7-day average week-over-week for Cases, Hospitalized, and Deaths ✅ Goal met. | ||||
 Click on graph for larger image.
This graph shows the daily (columns) and 7-day average (line) of deaths reported.
Average daily deaths bottomed in July 2021 at 214 per day.
July Vehicle Sales Forecast: Increase to 13.3 million SAAR
by Calculated Risk on 7/26/2022 04:42:00 PM
From WardsAuto: Not a Surge but July U.S. Light-Vehicle Sales Tracking Above Past Two Months (pay content). Brief excerpt:
"Wards Intelligence partner LMC Automotive is pegging the entire year at 14.3 million units, meaning the second-half SAAR will have to total 14.8 million units, up from first-half 2022’s 13.7 million ..."
 Click on graph for larger image.
This graph shows actual sales from the BEA (Blue), and Wards forecast for July (Red).
The Wards forecast of 13.3 million SAAR, would be up about 2% from last month, and down 9% from a year ago (sales were starting to weaken in mid-2021, due to supply chain issues).
Vehicle sales is usually a transmission mechanism for Federal Open Market Committee (FOMC) policy (far behind housing). However, this time, vehicle sales have been suppressed by supply chain issues, and will probably not be significantly impacted by higher interest rates.
Freddie Mac: Mortgage Serious Delinquency Rate decreased in June
by Calculated Risk on 7/26/2022 02:59:00 PM
Freddie Mac reported that the Single-Family serious delinquency rate in June was 0.76%, down from 0.80% May. Freddie's rate is down year-over-year from 1.86% in June 2021.
Freddie's serious delinquency rate peaked in February 2010 at 4.20% following the housing bubble and peaked at 3.17% in August 2020 during the pandemic.
These are mortgage loans that are "three monthly payments or more past due or in foreclosure".
 Click on graph for larger image
Mortgages in forbearance are being counted as delinquent in this monthly report but are not reported to the credit bureaus.
This is very different from the increase in delinquencies following the housing bubble. Lending standards have been fairly solid over the last decade, and most of these homeowners have equity in their homes - and they will be able to restructure their loans once (if) they are employed.
The serious delinquency rate was at 0.60% just prior to the pandemic - almost back.
New Home Sales Decrease Sharply, Record Months of Unsold Inventory Under Construction
by Calculated Risk on 7/26/2022 11:48:00 AM
Today, in the Calculated Risk Real Estate Newsletter: New Home Sales Decrease Sharply, Record Months of Unsold Inventory Under Construction
Brief excerpt:
The next graph shows the months of supply by stage of construction. “Months of supply” is inventory at each stage, divided by the sales rate.You can subscribe at https://calculatedrisk.substack.com/.
There are just over 0.83 months of completed supply (red line). This is about two-thirds of the normal level.
The inventory of new homes under construction is at 6.22 months (blue line) - well above the normal level. This elevated level of homes under construction is due to supply chain constraints. This is the all-time record; above the previous record set in 1980.
And a record 110 thousand homes have not been started - about 2.24 months of supply (grey line) - more than double the normal level. Homebuilders are probably waiting to start some homes until they have a firmer grasp on prices and demand.

New Home Sales Decrease Sharply to 590,000 Annual Rate in June
by Calculated Risk on 7/26/2022 10:09:00 AM
The Census Bureau reports New Home Sales in June were at a seasonally adjusted annual rate (SAAR) of 590 thousand.
The previous three months were revised down significantly.
Sales of new single‐family houses in June 2022 were at a seasonally adjusted annual rate of 590,000, according to estimates released jointly today by the U.S. Census Bureau and the Department of Housing and Urban Development. This is 8.1 percent below the revised May rate of 642,000 and is 17.4 percent below the June 2021 estimate of 714,000.
emphasis added
 Click on graph for larger image.
The first graph shows New Home Sales vs. recessions since 1963. The dashed line is the current sales rate.
New home sales are now below pre-pandemic levels.
The second graph shows New Home Months of Supply.
 The months of supply increased in June to 9.3 months from 8.4 months in May.
 The all-time record high was 12.1 months of supply in January 2009. The all-time record low was 3.5 months, most recently in October 2020.
This is well above the top of the normal range (about 4 to 6 months of supply is normal).
"The seasonally‐adjusted estimate of new houses for sale at the end of June was 457,000. This represents a supply of 9.3 months at the current sales rate."
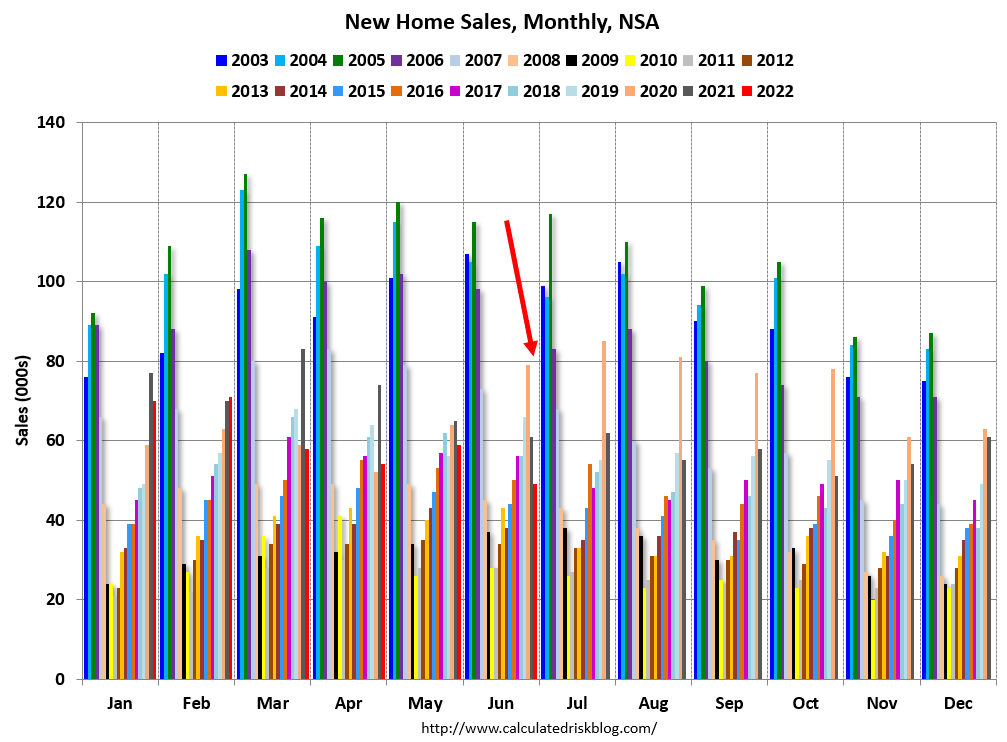 The last graph shows sales NSA (monthly sales, not seasonally adjusted annual rate).
In June 2022 (red column), 49 thousand new homes were sold (NSA). Last year, 61 thousand homes were sold in June.
The all-time high for June was 115 thousand in 2005, and the all-time low for June was 28 thousand in 2010 and in 2011.
This was well below expectations, and sales in the three previous months were revised down significantly. I'll have more later today.
Comments on May Case-Shiller and FHFA House Price Increases
by Calculated Risk on 7/26/2022 09:41:00 AM
Today, in the Calculated Risk Real Estate Newsletter: Case-Shiller National Index up 19.7% Year-over-year in May
Excerpt:
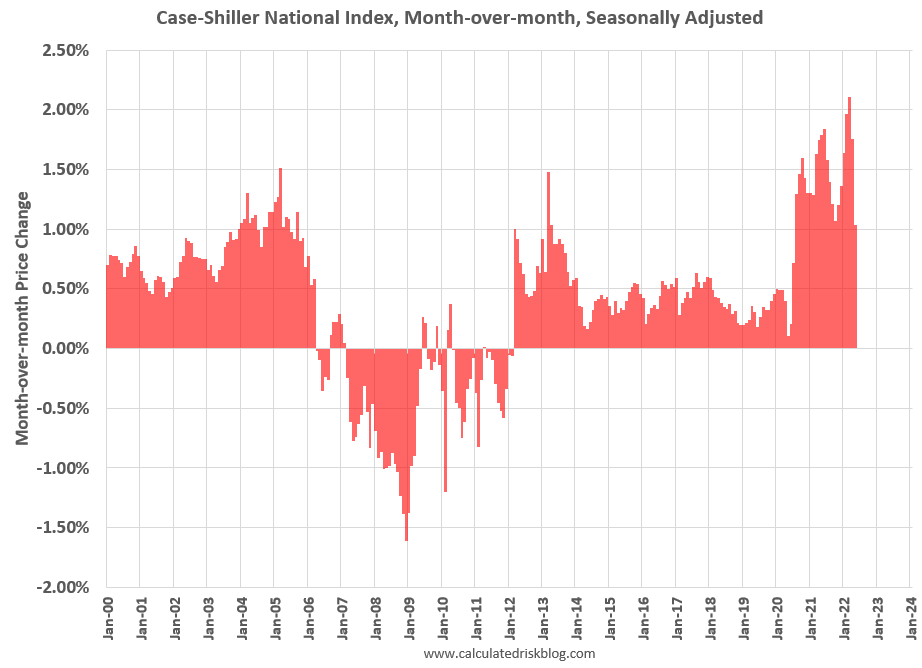
Both the Case-Shiller House Price Index (HPI) and the Federal Housing Finance Agency (FHFA) HPI for May were released today. Here is a graph of the month-over-month (MoM) change in the Case-Shiller National Index Seasonally Adjusted (SA).
The Case-Shiller Home Price Indices for “May” is a 3-month average of March, April and May closing prices. May closing prices include some contracts signed in January, so there is a significant lag to this data.
The MoM increase in Case-Shiller was at 1.04%. This was the smallest MoM increase since July 2020, and since this includes closings in March and April, this suggests price growth has slowed sharply.
There is much more in the article. You can subscribe at https://calculatedrisk.substack.com/
Case-Shiller: National House Price Index increased 19.7% year-over-year in May
by Calculated Risk on 7/26/2022 09:10:00 AM
S&P/Case-Shiller released the monthly Home Price Indices for May ("May" is a 3-month average of March, April and May prices).
This release includes prices for 20 individual cities, two composite indices (for 10 cities and 20 cities) and the monthly National index.
From S&P: S&P Corelogic Case-Shiller Index Reports Annual Home Price Gain Of 19.7% In May
The S&P CoreLogic Case-Shiller U.S. National Home Price NSA Index, covering all nine U.S. census divisions, reported a 19.7% annual gain in May, down from 20.6% in the previous month. The 10-City Composite annual increase came in at 19.0%, down from 19.6% in the previous month. The 20-City Composite posted a 20.5% year-over-year gain, down from 21.2% in the previous month.
Tampa, Miami, and Dallas reported the highest year-over-year gains among the 20 cities in May. Tampa led the way with a 36.1% year-over-year price increase, followed by Miami with a 34.0% increase, and Dallas with a 30.8% increase. Four of the 20 cities reported higher price increases in the year ending May 2022 versus the year ending April 2022.
...
Before seasonal adjustment, the U.S. National Index posted a 1.5% month-over-month increase in May, while the 10-City and 20-City Composites posted increases of 1.4% and 1.5%, respectively.
After seasonal adjustment, the U.S. National Index posted a month-over-month increase of 1.0%, and the 10-City and 20-City Composites both posted increases of 1.3%.
In May, all 20 cities reported increases before and after seasonal adjustments.
“Housing data for May 2022 continued strong, as price gains decelerated slightly from very high levels,” says Craig J. Lazzara, Managing Director at S&P DJI. “The National Composite Index rose by 19.7% for the 12 months ended May, down from April’s 20.6% year-over-year gain. We see a similar pattern in the 10-City Composite (up 19.0% in May vs. 19.6% in April) and in the 20-City Composite (+20.5% vs. +21.2%). Despite this deceleration, growth rates are still extremely robust, with all three composites at or above the 98th percentile historically
emphasis added
 Click on graph for larger image.
 The first graph shows the nominal seasonally adjusted Composite 10, Composite 20 and National indices (the Composite 20 was started in January 2000).
The Composite 10 index is up 1.3% in May (SA).
The Composite 20 index is up 1.3% (SA) in May.
The National index is 60% above the bubble peak (SA), and up 1.0% (SA) in May. The National index is up 119% from the post-bubble low set in February 2012 (SA).
 The second graph shows the year-over-year change in all three indices.
The Composite 10 SA is up 19.0% year-over-year. The Composite 20 SA is up 20.5% year-over-year.
The National index SA is up 19.7% year-over-year.
Price increases were slightly lower than expectations. I'll have more later.
Monday, July 25, 2022
Tuesday: New Home Sales, Case-Shiller House Prices, Richmond Fed Mfg
by Calculated Risk on 7/25/2022 08:55:00 PM
 Tuesday:
• At 9:00 AM ET, S&P/Case-Shiller House Price Index for May. The consensus is for a 21.0% year-over-year increase in the Comp 20 index for May.
• Also at 9:00 AM, FHFA House Price Index for May. This was originally a GSE only repeat sales, however there is also an expanded index.
• At 10:00 AM, New Home Sales for June from the Census Bureau. The consensus is for 666 thousand SAAR, down from 696 thousand in May.
• Also at 10:00 AM, Richmond Fed Survey of Manufacturing Activity for July.
On COVID (focus on hospitalizations and deaths):
Hospitalizations have almost quadrupled from the lows in April 2022.
 Click on graph for larger image.
This graph shows the daily (columns) and 7-day average (line) of deaths reported.
| COVID Metrics | ||||
|---|---|---|---|---|
| Now | Week Ago | Goal | ||
| New Cases per Day2 | 120,032 | 129,355 | ≤5,0001 | |
| Hospitalized2 | 33,226 | 34,347 | ≤3,0001 | |
| Deaths per Day2 | 365 | 380 | ≤501 | |
| 1my goals to stop daily posts, 27-day average for Cases, Currently Hospitalized, and Deaths 🚩 Increasing 7-day average week-over-week for Cases, Hospitalized, and Deaths ✅ Goal met. | ||||
 Click on graph for larger image.
This graph shows the daily (columns) and 7-day average (line) of deaths reported.
Average daily deaths bottomed in July 2021 at 214 per day.
Will Housing Inventory Follow the Normal Seasonal Pattern?
by Calculated Risk on 7/25/2022 03:09:00 PM
Today, in the Calculated Risk Real Estate Newsletter: Will Housing Inventory Follow the Normal Seasonal Pattern?
A brief excerpt:
The next couple of months will be important for housing inventory. Will inventory follow the normal seasonal pattern and peak in the summer? Or will inventory peak later in the year (like October or November)?There is much more in the article. You can subscribe at https://calculatedrisk.substack.com/
My current outlook on house prices assumes that inventory will continue to increase into the Fall.
...
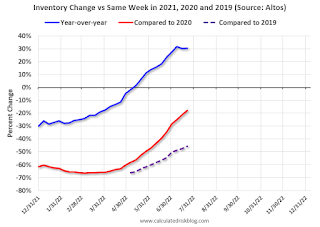
The second graph uses the Altos inventory data and shows the trend comparing to the same week in 2020 and 2019. The dotted red line is the recent trend compared to 2020 - and at the current pace, inventory will be up compared to 2020 in late August. The dashed grey line is comparing to 2019, and based on the current trend, it is possible inventory will be back to 2019 levels by the beginning of 2023.

Black Knight: Mortgage Delinquency Rate increased in June; Remains Well below Pre-Pandemic Levels
by Calculated Risk on 7/25/2022 11:19:00 AM
From Black Knight: Black Knight’s First Look: Mortgage Delinquencies and Foreclosure Starts Edge Higher in June but Remain Well Below Pre-Pandemic Levels
• The national delinquency rate rose nine basis points from May to reach 2.84% after hitting consecutive record lows in each of the prior three monthsAccording to Black Knight's First Look report, the percent of loans delinquent increased 3.3% in June compared to May and decreased 35% year-over-year.
• Increases were broad-based – the number of borrowers a single payment past due rose 5%, while 90-day delinquencies broke a 21-month streak of improvement with a modest 1% uptick from the prior month
• Foreclosure starts were also up 27% in June – still 40% below pre-pandemic levels – marking a 441% year-over-year increase, a significant rise from pandemic-driven lows
• Starts also represented the highest share (4%) of serious delinquencies since March 2020, but less than half the rate in the years leading up to the pandemic
• Active foreclosure inventory rose by 16K in the month as volumes continue to slowly come off the record lows brought on by widespread moratoriums and forbearance protections in 2020/21
• Prepayment activity was down another 7% in June with prepays now down by 64% from the same time last year as rising rates put downward pressure on both purchase and refinance lending
emphasis added
Black Knight reported the U.S. mortgage delinquency rate (loans 30 or more days past due, but not in foreclosure) was 2.84% in June, up from 2.75% in May.
The percent of loans in the foreclosure process increased in June to 0.53%, from 0.50% in May. This is increasing from very low levels due to the foreclosure moratoriums.
The number of delinquent properties, but not in foreclosure, is down 809,000 properties year-over-year, and the number of properties in the foreclosure process is up 45,000 properties year-over-year.
| Black Knight: Percent Loans Delinquent and in Foreclosure Process | ||||
|---|---|---|---|---|
| June 2022 | May 2022 | June 2021 | June 2020 | |
| Delinquent | 2.84% | 2.75% | 4.37% | 7.59% |
| In Foreclosure | 0.53% | 0.50% | 0.27% | 0.36% |
| Number of properties: | ||||
| Number of properties that are delinquent, but not in foreclosure: | 1,511,000 | 1,461,000 | 2,320,000 | 4,034,000 |
| Number of properties in foreclosure pre-sale inventory: | 190,000 | 174,000 | 145,000 | 192,000 |
| Total Properties | 1,700,000 | 1,635,000 | 2,466,000 | 4,226,000 |
Housing Inventory July 25th Update: Up 30.5% Year-over-year
by Calculated Risk on 7/25/2022 09:05:00 AM
Inventory is increasing rapidly. Inventory bottomed seasonally at the beginning of March 2022 and is now up 118% since then. More than double!
Altos reports inventory is up 30.5% year-over-year and is now 20.2% above the peak last year.
 Click on graph for larger image.
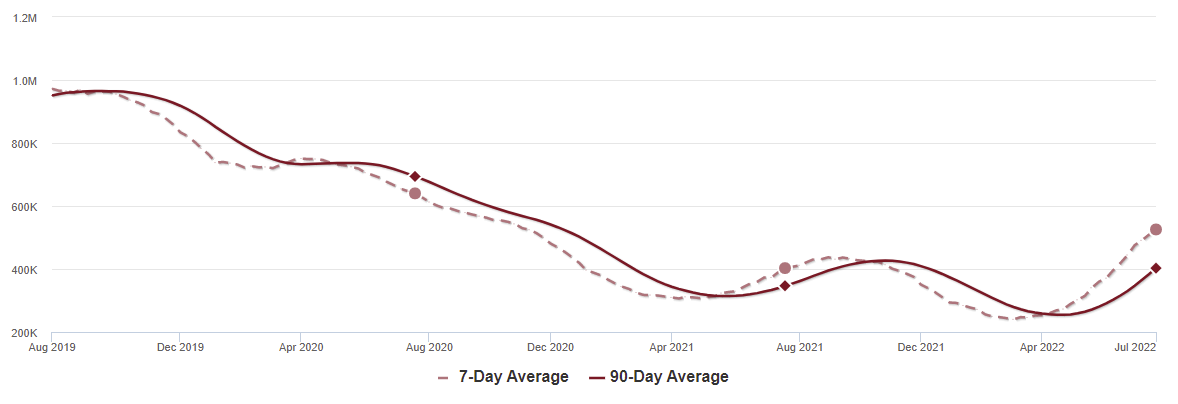
This inventory graph is courtesy of Altos Research.
 Click on graph for larger image.
This inventory graph is courtesy of Altos Research.
As of July 22nd, inventory was at 526 thousand (7-day average), compared to 509 thousand the prior week.
Inventory was up 3.3% from the previous week. Inventory is increasing much faster than normal for this time of year (both in percentage terms and in total inventory added).
Inventory is still historically low. Compared to the same week in 2021, inventory is up 30.5% from 403 thousand, however compared to the same week in 2020 inventory is down 17.9% from 640 thousand. Compared to 3 years ago, inventory is down 45.8% from 969 thousand.
Here are the inventory milestones I’m watching for with the Altos data:
1. The seasonal bottom (happened on March 4th for Altos) ✅
2. Inventory up year-over-year (happened on May 13th for Altos) ✅
3. Inventory up compared to two years ago (currently down 17.9% according to Altos)
4. Inventory up compared to 2019 (currently down 45.8%).
1. The seasonal bottom (happened on March 4th for Altos) ✅
2. Inventory up year-over-year (happened on May 13th for Altos) ✅
3. Inventory up compared to two years ago (currently down 17.9% according to Altos)
4. Inventory up compared to 2019 (currently down 45.8%).

Here is a graph of the inventory change vs 2021, 2020 (milestone 3 above) and 2019 (milestone 4).
The blue line is the year-over-year data, the red line is compared to two years ago, and dashed purple is compared to 2019.
Two years ago (in 2020) inventory was declining all year, so the two-year comparison will get easier all year.
Based on the recent increases in inventory, my current estimate is inventory will be up compared to 2020 in late August of this year (next month), and back to 2019 levels at the beginning of 2023.
Mike Simonsen discusses this data regularly on Youtube.
Five High Frequency Indicators for the Economy
by Calculated Risk on 7/25/2022 08:16:00 AM
These indicators are mostly for travel and entertainment. It is interesting to watch these sectors recover as the pandemic subsides. Notes: I've added back gasoline supplied to see if there is an impact from higher gasoline prices. Apple has discontinued "Apple mobility", and restaurant traffic is mostly back to normal.
The TSA is providing daily travel numbers.
This data is as of July 24th.
 Click on graph for larger image.
This data shows the 7-day average of daily total traveler throughput from the TSA for 2019 (Light Blue), 2020 (Black), 2021 (Blue) and 2022 (Red).
The dashed line is the percent of 2019 for the seven-day average.
The 7-day average is down 12.1% from the same day in 2019 (87.9% of 2019). (Dashed line)
Air travel - as a percent of 2019 - has been moving sideways over the last several months, off about 10% from 2019 - with some ups and downs, usually related to the timing of holidays.
 This data shows domestic box office for each week and the median for the years 2016 through 2019 (dashed light blue).
 Black is 2020, Blue is 2021 and Red is 2022.
The data is from BoxOfficeMojo through July 21st.
Note that the data is usually noisy week-to-week and depends on when blockbusters are released.
Movie ticket sales were at $206 million last week, down about 18% from the median for the week.
Note that the data is usually noisy week-to-week and depends on when blockbusters are released.
Movie ticket sales were at $206 million last week, down about 18% from the median for the week.
 This graph shows the seasonal pattern for the hotel occupancy rate using the four-week average.
 The red line is for 2022, black is 2020, blue is the median, and dashed light blue is for 2021. Dashed purple is 2019 (STR is comparing to a strong year for hotels).
This data is through July 16th. The occupancy rate was down 7.4% compared to the same week in 2019.
The 4-week average of the occupancy rate is close to the median rate for the previous 20 years (Blue).
Notes: Y-axis doesn't start at zero to better show the seasonal change.
Notes: Y-axis doesn't start at zero to better show the seasonal change.

This graph, based on weekly data from the U.S. Energy Information Administration (EIA), shows gasoline supplied compared to the same week of 2019.
Blue is for 2020. Purple is for 2021, and Red is for 2022.
As of July 15th, gasoline supplied was down 7.5% compared to the same week in 2019.
Recently gasoline supplied has been running somewhat below 2019 levels.
Here is some interesting data on New York subway usage (HT BR).
 This graph is from Todd W Schneider.
 This graph shows weekly turnstile entries since 2015.
Currently traffic is less than half of normal.
Currently traffic is less than half of normal.
This data is through Friday, July 22nd.
He notes: "Data updates weekly from the MTA’s public turnstile data, usually on Saturday mornings".
Sunday, July 24, 2022
Sunday Night Futures
by Calculated Risk on 7/24/2022 06:41:00 PM
Weekend:
• Schedule for Week of July 24, 2022
• FOMC Preview: 75bp Hike
Monday:
• At 8:30 AM ET, Chicago Fed National Activity Index for June. This is a composite index of other data.
• At 10:30 AM, Dallas Fed Survey of Manufacturing Activity for July.
From CNBC: Pre-Market Data and Bloomberg futures S&P 500 are down 5 and DOW futures are down 55 (fair value).
Oil prices were mixed over the last week with WTI futures at $95.51 per barrel and Brent at $104.18 per barrel. A year ago, WTI was at $72, and Brent was at $74 - so WTI oil prices are up 33% year-over-year.
Here is a graph from Gasbuddy.com for nationwide gasoline prices. Nationally prices are at $4.33 per gallon. A year ago, prices were at $3.15 per gallon, so gasoline prices are up $1.18 per gallon year-over-year.
FOMC Preview: 75bp Hike
by Calculated Risk on 7/24/2022 09:46:00 AM
Expectations are the FOMC will announce a 75bp rate increase in the federal funds rate at the meeting this week.
From Merrill Lynch:
1 Projections of change in real GDP and inflation are from the fourth quarter of the previous year to the fourth quarter of the year indicated.
The unemployment rate was at 3.6% in June. So far, the economic slowdown has not pushed up the unemployment rate.
2 Projections for the unemployment rate are for the average civilian unemployment rate in the fourth quarter of the year indicated.
As of May 2022, PCE inflation was up 6.3% from May 2021. This was below the cycle high of 6.6% YoY in March. Analysts are expecting inflation to decline slowly.
PCE core inflation was up 4.7% in May year-over-year. This was below the cycle high of 5.3% YoY in February.
"We look for the Fed to lift the target range for the federal funds rate by 75bp to 2.25-2.5% while keeping its balance sheet normalization policies in place. ... We look for Chair Powell to repeat similar messages from the June FOMC meeting; namely that inflation is too high, the Fed is committed to restoring price stability, and some pain may be needed to bring inflation lower. Looking ahead, we expect another 50bp increase in September and two additional 25bp rate hikes by year end, which would bring the target range for the federal funds rate to 3.25-3.50%."From Goldman Sachs:
"We expect a 75bp rate hike at the July FOMC meeting next week. ... The key question for next week is what guidance Chair Powell will give about the size of a likely rate hike in September. We expect that Fed officials will want to keep their options open and will avoid any strong guidance. ... We continue to expect a 50bp hike in September and 25bp hikes in November and December to a terminal rate of 3.25-3.5%."
Analysts will be looking for comments on the size of future rate hikes.
Projections will not be released at this meeting. For review, here are the June projections.
In June, most participants expected thirteen 25bp rate hikes in 2022. The FOMC raised rates 25 bp in March, 50 bp in May, and 75 bp in June.
Wall Street forecasts have been revised down further since June due to the ongoing negative impacts from the pandemic. the war in Ukraine and financial tightening. For example, from BofA:
Wall Street forecasts have been revised down further since June due to the ongoing negative impacts from the pandemic. the war in Ukraine and financial tightening. For example, from BofA:
"We now forecast 1.1% GDP growth for 2022 and expect growth to slow to -0.2% in 2023"
| GDP projections of Federal Reserve Governors and Reserve Bank presidents, Change in Real GDP1 | ||||
|---|---|---|---|---|
| Projection Date | 2022 | 2023 | 2024 | |
| June 2022 | 1.5 to 1.9 | 1.3 to 2.0 | 1.5 to 2.0 | |
| Mar 2022 | 2.5 to 3.0 | 2.1 to 2.5 | 1.8 to 2.0 | |
The unemployment rate was at 3.6% in June. So far, the economic slowdown has not pushed up the unemployment rate.
| Unemployment projections of Federal Reserve Governors and Reserve Bank presidents, Unemployment Rate2 | ||||
|---|---|---|---|---|
| Projection Date | 2022 | 2023 | 2024 | |
| June 2022 | 3.6 to 3.8 | 3.8 to 4.1 | 3.9 to 4.1 | |
| Mar 2022 | 3.4 to 3.6 | 3.3 to 3.6 | 3.2 to 3.7 | |
As of May 2022, PCE inflation was up 6.3% from May 2021. This was below the cycle high of 6.6% YoY in March. Analysts are expecting inflation to decline slowly.
| Inflation projections of Federal Reserve Governors and Reserve Bank presidents, PCE Inflation1 | ||||
|---|---|---|---|---|
| Projection Date | 2022 | 2023 | 2024 | |
| June 2022 | 5.0 to 5.3 | 2.4 to 3.0 | 2.0 to 2.5 | |
| Mar 2022 | 4.1 to 4.7 | 2.3 to 3.0 | 2.1 to 2.4 | |
PCE core inflation was up 4.7% in May year-over-year. This was below the cycle high of 5.3% YoY in February.
| Core Inflation projections of Federal Reserve Governors and Reserve Bank presidents, Core Inflation1 | ||||
|---|---|---|---|---|
| Projection Date | 2022 | 2023 | 2024 | |
| June 2022 | 4.2 to 4.5 | 2.5 to 3.2 | 2.1 to 2.5 | |
| Mar 2022 | 3.9 to 4.4 | 2.4 to 3.0 | 2.1 to 2.4 | |

In Memoriam: Doris "Tanta" Dungey


| Privacy Policy |
| Copyright © 2007 - 2025 CR4RE LLC |
| Excerpts NOT allowed on x.com |