 RSS Feed
 by Calculated Risk on 3/31/2010 10:40:00 PM
Wednesday, March 31, 2010
Jim the Realtor on Short Sales: "Rampant Fraud and Deceit"
First: the buyer should find out if it is a HAFA short sale (starts April 5th). If so, the "negotiator fee" must be disclosed and be part of the agent's fee (total agent fee not to exceed 6%). From HAFA:
The amount of the real estate commission that may be paid, not to exceed 6% of the contract sales price, and notification if any portion of the commission must be paid to a contractor of the servicer that has been retained to assist the listing broker with the transaction.As an aside, if the homeowner or buyer is an agent, they are not eligible for any commission.
Any commission that would otherwise be paid to you or the buyer must be reduced from the commission due on sale.Second: as part of a HAFA short sale, the lender(s) must agree not to pursue a deficiency. If the lender balks on a short sale - I'd ask them about HAFA.
Third: Where are the regulators? Jim the Realtor is talking about rampant fraud in San Diego. Hello? Is anybody listening?
"There is rampant fraud and deceit being imposed by Realtors throughout the county. It's embarrassing."
California Gasoline Usage declines for 4th Consecutive Year
by Calculated Risk on 3/31/2010 06:55:00 PM
From David Baker at the San Francisco Chronicle: State gas usage falls for 4th straight year
Driven lower by high prices and the recession, gasoline sales in California fell for the fourth year in a row during 2009, state officials reported Tuesday.
...
Annual gas sales in California peaked at 15.9 billion gallons in 2005 and have tumbled 7 percent since then.
 Click on graph for larger image in new window.
This graph shows the percent change of taxable gallons of gasoline compared to the same quarter of the prior year.
In addition to gasoline usage being down for four straight years, driven by higher prices and then the recession, usage turned down again in Q4 2009 - probably because prices are up over $3 per gallon again.
Fannie Mae: Delinquencies Increase in January
by Calculated Risk on 3/31/2010 02:54:00 PM
Here is the monthly Fannie Mae hockey stick graph for January ... Click on graph for larger image in new window.
Fannie Mae reported today that the rate of serious delinquencies - at least 90 days behind - for conventional loans in its single-family guarantee business increased to 5.52% in January, up from 5.38% in December - and up from 2.77% in January 2009.
"Includes seriously delinquent conventional single-family loans as a percent of the total number of conventional single-family loans."
Fed's Lockhart on Employment
by Calculated Risk on 3/31/2010 01:06:00 PM
I'd like to highlight a few key points from Atlanta Fed President Dennis Lockhart's speech today: Prospects for Sustained Recovery and Employment Gains
The normal state of affairs in the country's labor market is a dynamic mix of separations from employment and new job creation. There are two causes of separations—layoffs and voluntarily quitting a job, or so-called quits. The BLS began collecting data on these factors in 2000.Lockhart discusses two key mismatches, and the housing bubble was a direct cause of both. The first - lower geographical mobility because of the inability to sell a home - is like atherosclerosis for the economy. Usually people can move freely in the U.S. to pursue employment, but many people are tied to an anchor (an underwater mortgage) and solutions like a mortgage modification that requires them to stay in the home for 5 years doesn't help with worker mobility.
In 2008 and 2009, layoffs surged. Fortunately, the number of layoffs per month has recently returned to prerecession levels.
In addition, quits are at a decade-low level likely in part because of the uncertainty of job availability.
Today's slow pace of employment gains is due more to the slow pace of job creation, not the high rate of layoffs. Job gains, as conventionally understood, require two things: a vacancy and a worker able to fill that vacancy. For most of 2009, vacancies were relatively flat while unemployment continued to rise. This condition suggests the existence of what labor economists call "match inefficiencies."
There are two key types of match inefficiency. One is geographic mismatch. In 2008, the percentage of individuals living in a county or state different than the previous year was the lowest recorded in more than 50 years of data. People may be reluctant to relocate for a new job if the value of their house has declined. In addition, many who would like to move are under water in their mortgage or can't sell their homes.
The second inefficiency is skills mismatch. In simple terms, the skills people have don't match the jobs available. Coming out of this recession there may be a more or less permanent change in the composition of jobs. Skill mismatches require new training, and there is evidence that adult education institutions have responded to this need. For instance, officials at Miami-Dade College in Florida, which is the largest college in the country and a grantor of associate and vocational degrees, told us they have recently seen a strong increase in enrollment, especially of men in their 20s.
This evidence of retooling is encouraging, but, to be realistic, structural adjustment takes time.
The second - skills mismatch - is partly because so many people went into the construction industry because it was the highest paying job. These workers may be highly skilled in their trade, but their skills are probably not transferable to the new jobs being created. I wouldn't be surprised to read of job shortages in some fields, while the unemployment rate remains very high because of the skills mismatch.
And more from Lockhart:
Looking forward, the consensus forecast for March is that the economy will add 200,000 new jobs. That number includes a boost from temporary government hiring for the census.This is another key point: Zero payroll jobs is not a magic number. It takes about 125+ thousand payroll jobs added per month to keep the unemployment rate steady over time, and probably close to 200 thousand jobs per month to reduce the unemployment rate by 1% over the next year.
However, according to an Atlanta Fed estimate, we need to add about that number to payrolls each month for the next year to bring unemployment down a full percentage point. This estimate assumes that the growth in the labor force stays in line with the growth in the population.
Restaurant Index increases in February
by Calculated Risk on 3/31/2010 10:56:00 AM
This is one of several industry specific indexes I track each month.  Click on graph for larger image in new window.
The current situation for restaurants is still weak, but the index improved because of the outlook for sales growth, capital spending plans, and staffing levels.
Unfortunately the data for this index only goes back to 2002.
Note: Any reading below 100 shows contraction for this index.
From the National Restaurant Association (NRA): Positive Outlook Pushes Restaurant Performance Index To Highest Level in More Than Two Years
[T]the National Restaurant Association’s Restaurant Performance Index (RPI) rose to ... 99.0, up 0.7 percent from January and its strongest level since November 2007.
“The RPI’s strong gain in February was the result of broad-based improvements among the forward-looking indicators,” said Hudson Riehle, senior vice president of the Research and Knowledge Group for the Association. “Restaurant operators’ optimism for sales growth stood at its strongest level in 29 months, with capital spending plans also rising to a two-year high.”
“In addition, restaurant operators reported a positive outlook for staffing gains for the first time in more than two years,” Riehle added. “This bodes well for replacing the more than 280,000 eating and drinking place jobs lost during the recession.”
...
Restaurant operators reported negative same-store sales for the 21st consecutive month in February, with the overall results similar to the January performance.
...
Customer traffic also remained soft in February, as restaurant operators reported net negative traffic for the 30th consecutive month.
...
Along with continued soft sales and traffic performances, capital spending activity continued to drop off.
emphasis added
MBA: Mortgage Applications Increase
by Calculated Risk on 3/31/2010 08:55:00 AM
The MBA reports: Mortgage Refinance Applications Increase in Latest MBA Weekly Survey
The Market Composite Index, a measure of mortgage loan application volume, increased 1.3 percent on a seasonally adjusted basis from one week earlier. ...
“Purchase applications have increased over the past month, and are now at their highest level since last October when many homebuyers were rushing to get loans closed before the expected expiration of the homebuyer tax credit,” said Michael Fratantoni, MBA’s Vice President of Research and Economics. “We may be seeing a similar pattern now, as the extended version of the tax credit ends next month.”
The Refinance Index decreased 1.3 percent from the previous week and the seasonally adjusted Purchase Index increased 6.8 percent from one week earlier. This is the highest Purchase Index since the week ending October 30, 2009. ...
The refinance share of mortgage activity decreased to 63.2 percent of total applications from 65.0 percent the previous week. This is the lowest refinance share recorded in the survey since the week ending October 23, 2009. ...
The average contract interest rate for 30-year fixed-rate mortgages increased to 5.04 percent from 5.01 percent, with points increasing to 1.07 from 0.76 (including the origination fee) for 80 percent loan-to-value (LTV) ratio loans.
 Click on graph for larger image in new window.
This graph shows the MBA Purchase Index and four week moving average since 1990.
The recent uptick in purchase applications is probably related to buyers trying to beat the expiration of the tax credit.
I've heard from some real estate agents that activity seems to have picked up, more than the normal seasonal increase, and the MBA data would seem to suggest this is happening. However I expect any increase in activity this year to be less than the increase last year.
ADP: Private Employment decreased 23,000 in March
by Calculated Risk on 3/31/2010 08:15:00 AM
ADP reports:
Nonfarm private employment decreased 23,000 from February to March on a seasonally adjusted basis, according to the ADP National Employment Report®. The estimated change of employment from January 2010 to February 2010 was revised down slightly, from a decline of 20,000 to a decline of 24,000.Note: ADP is private nonfarm employment only (no government jobs).
The March employment decline was the smallest since employment began falling in February of 2008. Yet, the lack of improvement in employment from February to March is consistent with the pause in the decline of initial unemployment claims that occurred during the winter.
Since employment as measured by the ADP Report was not restrained in February by the effects of inclement weather, today’s figure does not incorporate a weather-related rebound that could be present in this month’s BLS data. In addition, today’s figure does not include any federal hiring in March for the 2010 Census. For both these reasons, it is reasonable to expect that Friday’s employment figure from the BLS will be stronger than today’s estimate in the ADP National Employment Report.
This is far below the consensus forecast of an increase of 40,000 private sector jobs in March.
The BLS reports on Friday, and the consensus is for an increase of 200,000 payroll jobs in March, on a seasonally adjusted (SA) basis, because of Census 2010 hiring and a bounce back from the snow storms. The underlying trend will be much lower ...
Tuesday, March 30, 2010
Live Chat with BLS experts on Friday
by Calculated Risk on 3/30/2010 11:58:00 PM
The BLS will host a live chat on Friday starting at 9:30 AM ET.
You can submit questions in advance here or submit questions during the event. I'm planning on posting the event on the blog (I'm not involved), so you can (hopefully) read the Q&A and ask questions from the blog on Friday morning.
I sent an advance question asking how we should adjust the seasonally adjusted headline payroll number for the NSA 2010 Census hiring data to try to determine the underlying trend (not counting the snow storms!).
| Friday, April 2, 2010 from 9:30 to 10:30 a.m. EDT. From the BLS: "BLS subject matter experts will take your questions on national employment and unemployment data, with a particular focus on the figures for March that will be released that morning at 8:30 a.m. EDT." |
LA Times: 'Gated Ghetto' in SoCal
by Calculated Risk on 3/30/2010 08:51:00 PM
Building gated communities for young families in exurbia was a great idea ...
From Alana Semuels at the LA Times: From bucolic bliss to 'gated ghetto'
The 427-home Willowalk tract, built by developer D.R. Horton, featured eight distinct "villages" within its block walls. Along with spacious homes, Willowalk boasted four lakes, a community pool and clubhouse. Fanciful street names such as Pink Savory Way and Bee Balm Road added to the bucolic image.
...
Home foreclosures have devastated neighborhoods throughout the country, but the transformation from suburban paradise to blighted community has been especially stark in places like Willowalk -- isolated developments on the far fringes of metropolitan areas that found ready buyers when home prices were soaring but then saw an exodus as values crashed.
Vacant homes are sprinkled throughout Willowalk, betrayed by foot-high grass. Others are rented, including some to families that use government Section 8 vouchers to live in homes with granite countertops and vaulted ceilings.
...
The contrast between occupied and empty houses is evident on one block, where high grass in weedy clumps gives way to a neatly mowed lawn with handwritten signs pleading "Please do not let your dog poop on our yard."
Government Housing Support Update
by Calculated Risk on 3/30/2010 06:03:00 PM
One of the key questions is: Will house prices fall as the government support for housing eases? From CNBC: Housing Prices May Be Heading for a Double Dip
Anyone thinking housing prices have reached a bottom had better do some recalculating. Despite Tuesday's Case Schiller report showing smaller declines in January, housing prices may already be in another free fall.Few people use the FHFA index anymore, but I do think prices will fall further in many areas. And I think the key housing price indexes, Case-Shiller and First American CoreLogic, have not bottomed yet - although it is possible.
Newly revised numbers are pointing to the decline.
The Federal Housing Finance Agency's (FHFA) adjusted figures show a housing price decline of 2 percent in December and 0.6 percent decline in January—reversing some regional price increases in 2009.
And more pricing dips are predicted.
Right now the Case-Shiller composite 10 index is 4.4% above the bottom of May 2009 (seasonally adjusted), and CoreLogic's index is 3.5% above the bottom of March 2009 (NSA), so it will not take much of a decline to see new post-bubble lows.
Last year I listed some of the temporary Government housing support programs (as opposed to permanent programs like tax breaks). This included:
Marshall & Ilsley Corporation (M&I) today announced it has extended its foreclosure moratorium an additional 90 days – through June 30, 2010. The initial moratorium was announced on December 18, 2008, as part of M&I's Homeowner Assistance Program. The moratorium is on all owner-occupied residential loans for customers who agree to work in good faith to reach a successful repayment agreement. The moratorium applies to applicable loans in all M&I markets.And other lenders are clearly not been aggresive in foreclosing.
So although some key programs are ending (MBS purchase program and housing tax credit), there are still a number of temporary programs providing support for the housing market.
Irish banks may require up to €32 billion
by Calculated Risk on 3/30/2010 02:28:00 PM
From the IrishTimes.com: Irish banks may require up to €32 billion to cover losses
Irish banks may require up to €32 billion to cover the losses from bad property loans transferred to the National Asset Management Agency (Nama), it has emerged.And all the details from the Minister for Finance.
The true scale of the “black hole” left in the sector by toxic property debt was laid bare today as Nama confirmed the initial tranche of bad loans would be acquired at a discount of 47 per cent, substantially more than the Government’s initial estimate of 30 per cent.
| Book value of amounts transferred in Tranche 1 | Price paid by NAMA for tranche 1 | Haircut | |
|---|---|---|---|
| AIB | €3.29 | €1.88 | 43% |
| BOI | €1.93 | €1.26 | 35% |
| Anglo | €10.00 | €5.00(1) | 50% |
| INBS | €0.67 | €0.28 | 58% |
| EBS | €0.14 | €0.09 | 36% |
(1) Estimate; every 1% increase in haircut reduces price paid by NAMA for
tranche 1 by €100m
Philly Fed State Coincident Indicators
by Calculated Risk on 3/30/2010 12:41:00 PM
 Click on map for larger image.
Here is a map of the three month change in the Philly Fed state coincident indicators. Twenty five states are showing declining three month activity. The index increased in 18 states, and was unchanged in 7
Here is the Philadelphia Fed state coincident index release for February.
In the past month, the indexes increased in 21 states, decreased in 22, and remained unchanged in seven for a one-month diffusion index of -2. Over the past three months, the indexes increased in 18 states, decreased in 25, and remained unchanged in seven for a three-month diffusion index of -14.
 The second graph is of the monthly Philly Fed data of the number of states with one month increasing activity. Based on this indicator, most of the U.S. was in recession in early 2008.
Although the graph shows the recession ending in July 2009 (based on other data), just over half the country was still in recession in February according to this index.
Note: this graph includes states with minor increases (the Philly Fed lists as unchanged).
Case-Shiller House Price Graphs for January
by Calculated Risk on 3/30/2010 10:44:00 AM
Finally. Every month the S&P website crashes when the Case-Shiller data is released.
IMPORTANT: These graphs are Not Seasonally Adjusted (NSA). Unfortunately this month only the NSA data is currently available. Usually I report the SA data, but that isn't available.
S&P/Case-Shiller released the monthly Home Price Indices for January (actually a 3 month average).
The monthly data includes prices for 20 individual cities, and two composite indices (10 cities and 20 cities). Click on graph for larger image in new window.
The first graph shows the nominal not seasonally adjusted Composite 10 and Composite 20 indices (the Composite 20 was started in January 2000).
The Composite 10 index is off 30.2% from the peak, and down about 0.2% in January (media reports are an increase seasonally adjusted - but that data isn't available).
The Composite 20 index is off 29.6% from the peak, and down about 0.4% in January (NSA). The second graph shows the Year over year change in both indices.
The Composite 10 is essentially flat compared to January 2009.
The Composite 20 is off 0.7% from January 2009.
The third graph shows the price declines from the peak for each city included in S&P/Case-Shiller indices. Prices decreased (NSA) in 18 of the 20 Case-Shiller cities in January NSA.
On a SA basis from the NY Times: U.S. Home Prices Prices Inch Up, but Troubles Remain
Twelve of the cities in the index went up in January from December. Los Angeles was the biggest gainer, up 1.7 percent. Chicago was the biggest loser, dropping 0.8 percent.NOTE: Usually I report the Seasonally Adjusted data (see NY Times article), but that data wasn't available. So remember these graphs are NSA.
Case-Shiller House Prices increase in January
by Calculated Risk on 3/30/2010 09:04:00 AM
From Bloomberg: Home Prices in 20 U.S. Cities Increased 0.3% in January
The S&P/Case-Shiller home-price index climbed 0.3 percent from the prior month on a seasonally adjusted basis after a similar gain in December, the group said today in New York. The gauge was down 0.7 percent from January 2009, the smallest year- over-year decrease in two years.Graphs soon (S&P site always crashes when this data is released).
...
“While we continue to see improvements in the year-over- year data for all 20 cities, the rebound in housing prices seen last fall is fading,” David Blitzer, chairman of the index committee at S&P, said in a statement.
Monday, March 29, 2010
Housing: Sales activity picking up
by Calculated Risk on 3/29/2010 10:16:00 PM
As expected, sales are picking up again (contracts must be signed before April 30th to qualify for the Federal tax credit):
From David Streitfeld at the NY Times: Spurt of Home Buying as End of Tax Credit Looms (ht Ann)
After several disastrous months for home sales across the country, when volume dropped by 23 percent, the pace appears to be picking up again. The number of Des Moines homes under contract in February rose by a third from the January level. The number of pending contracts jumped 10 percent in Naples, Fla., 14 percent in Houston and 21 percent in Portland, Ore.And unfortunately some people are calling for an extension:
These deals will be reflected in the national sales reports when they become final, this month or next. There is no evidence that prices have begun to move in response to the higher volume. Indeed, so many homes are coming on the market that prices might well fall further.
Robert Shiller, a professor of economics at Yale and co-developer of the Standard & Poor’s/Case-Shiller housing price index, is an early advocate. He thinks the credit was a bad idea that nevertheless the market cannot do without.Dr. Shiller is right that the credit was a bad idea, but he is forgetting that existing home sales add little to the economy - and encouraging new home sales with an excess supply is counterproductive.
“You don’t make drug addicts go cold turkey,” Mr. Shiller said. “The credit interferes with the market in an arbitrary way, but ending it now would be psychologically powerful. People will be in a bad mood about buying a house.” He advocates phasing it out gradually.
I am hearing from agents that sales activity is picking up in California too. But I don't expect the increase in sales to be as significant this May and June (when contracts close), as last October and November when the first tax credit was expiring.
We must remember not to mistake activity with accomplishment (to quote John Wooden). This little extra activity does nothing to reduce the overall supply.
Ireland to Report Bank Writedowns Tuesday
by Calculated Risk on 3/29/2010 07:52:00 PM
Two different perspectives, first from The Times: Ireland on the brink of full-scale bank nationalisation
The Republic of Ireland faced the prospect last night of having most of its banking system nationalised amid growing speculation that the Dublin Government would raise its stakes in both remaining private sector operators — Allied Irish Bank and Bank of Ireland.But Karl Whelan at The Irish Economy blog writes: Super Tuesday Leaks
[A] report [yesterday] that the Government’s stake in AIB would rise from 25 per cent to 70 per cent and its holding in BoI would be lifted from 16 per cent to 40 per cent.
...
With the Irish Nationwide and EBS building societies being merged and nationalised, and Anglo Irish Bank, the other large banking company, also nationalised, most of the industry would be in the State’s hands.
Ireland is the first significant Western country to be faced with the humiliation of wholesale bank nationalisation in this crisis, although the Republic took its three main banks into state ownership 18 months ago.
There is nothing new about the idea of the state potentially owning 70 percent of AIB. Even based on previous expectations for NAMA discounts, this was always a possibility. ... [I]t is hard to reconcile the continuing circulation of the same ownership statistics as before with the new information (if such it is) on discounts and also on capital levels.The world has come full circle. The main stream media screams "nationalization" and the blog keeps the numbers in perspective.
Note: NAMA is National Asset Management Agency, a "bad bank" set up by the government to take many of the distressed assets in Ireland. This was a very different approach than in the U.S.
Market and Greece Update
by Calculated Risk on 3/29/2010 04:00:00 PM
First, from the NY Times: In Crucial Test, Greece Raises $6.7 Billion in Bond Sale
The bonds, worth $6.7 billion, were priced to yield 6 percent, according to banks that managed the sale, meaning that Greece was paying a princely 3.34 percentage points above what Germany, considered the European benchmark, pays to borrow at a similar maturity. It was also well above the rates paid by governments in Portugal, Spain, Ireland and Italy, other countries whose indebtedness has caused concern.Since it is almost the end of Q1 ... here is a market update:
 Click on graph for larger image in new window.
The first graph shows the S&P 500 since 1990.
The dashed line is the closing price today. The S&P 500 was first at this level in December 1998; over 11 years ago.
The S&P 500 is up 73.4% from the bottom in 2009 (497 points), and still off 25% from the peak (392 points below the max).

The second graph is from Doug Short of dshort.com (financial planner): "Four Bad Bears".
Note that the Great Depression crash is based on the DOW; the three others are for the S&P 500.
Residential Investment Stalled
by Calculated Risk on 3/29/2010 01:37:00 PM
The BEA released an update to the underlying detail tables for Q4 today. The following graph uses the updated data for Residential Investment through Q4, and an estimate for Q1 based on housing data through February (a 10% annualized decline in residential investment).
Note: Residential Investment includes new single family structures, new multi-family structures, home improvement, brokers' commissions on sale of structures and a few minor categories. Click on graph for large image.
This graph shows total Residential Investment, and single-family structures, both as a percent of GDP.
Residential investment (RI) is one of the best leading indicators for the economy. Usually RI as percent of GDP is declining before a recession, and climbs sharply coming out of a recession.
Note: The 2001 recession was a business led recession. Some readers will notice the sharp decline in 1966 and wonder why the economy didn't slide into a recession - the answer is the rapid build-up for the Vietnam war kept the economy out of recession (not the best antidote).
But this time RI is moving sideways. This time is different.
The reason RI is moving sideways is because of the huge overhang of existing housing units (both single family and rental units). And this is one of the key reasons I think the current recovery will be sluggish and choppy - and that unemployment will stay elevated for some time.
Stated simply: One of the usual engines of recovery - residential investment - isn't contributing this time.
ATA Truck Tonnage Index declines in February
by Calculated Risk on 3/29/2010 10:56:00 AM
From the American Trucking Association: ATA Truck Tonnage Index Fell 0.5 Percent in February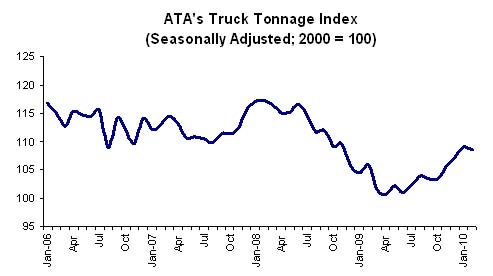 Click on graph for slightly larger image in new window.
The American Trucking Associations’ advance seasonally adjusted (SA) For-Hire Truck Tonnage Index decreased 0.5 percent in February, following a revised 1.9 percent increase in January [revised down from 3.1%]. The latest drop put the SA index at 108.5 (2000=100), down from 109.1 in January.Trucking is a coincident indicator for the economy, but the snow makes it difficult to tell about February.
...
Compared with February 2009, SA tonnage increased 2.6 percent, which was the third consecutive year-over-year gain. For the first two months of 2010, SA tonnage was up 3.5 percent compared with the same period last year. For all of 2009, the tonnage index contracted 8.7 percent, which was the largest annual decrease since 1982.
ATA Chief Economist Bob Costello said that the February tonnage reading is difficult to interpret because of the severe winter storms that impacted truck freight movements during the month, particularly on the East Coast.
...
Trucking serves as a barometer of the U.S. economy, representing nearly 69 percent of tonnage carried by all modes of domestic freight transportation, including manufactured and retail goods. Trucks hauled 10.2 billion tons of freight in 2008. Motor carriers collected $660.3 billion, or 83.1 percent of total revenue earned by all transport modes.
February Personal Income Flat, Spending Increases
by Calculated Risk on 3/29/2010 08:30:00 AM
From the BEA: Personal Income and Outlays, January 2010
Personal income increased $1.2 billion, or less than 0.1 percent ... Personal consumption expenditures (PCE) increased $34.7 billion, or 0.3 percent.Stagnant income and increased spending means the saving rate declined again ...
...
Real PCE -- PCE adjusted to remove price changes -- increased 0.3 percent in February, compared with an increase of 0.2 percent in January.
...
Personal saving -- DPI less personal outlays -- was $340.0 billion in February, compared with $374.9 billion in January. Personal saving as a percentage of disposable personal income was 3.1 percent in February, compared with 3.4 percent in January.
 Click on graph for large image.
This graph shows the saving rate starting in 1959 (using a three month trailing average for smoothing) through the February Personal Income report. The saving rate fell to 3.1% in February.
I still expect the saving rate to rise over the next couple of years - possibly to 8% or more - slowing the growth in PCE.
The following graph shows real Personal Consumption Expenditures (PCE) through February (2005 dollars). Note that the y-axis doesn't start at zero to better show the change.
 The quarterly change in PCE is based on the change from the average in one quarter, compared to the average of the preceding quarter.
The colored rectangles show the quarters, and the blue bars are the real monthly PCE.
The increase in PCE in February was fairly strong (a 3.0% annual rate over the last three months). Using the Two Month average method, this suggests PCE growth in Q1 2010 will be around 3.0%. That will be the highest growth rate since Q1 2007, however this is being driven by less saving and transfer payments - not growth in income.
The National Bureau of Economic Research (NBER) uses several measures to determine if the economy is in recession. One of the measures is real personal income less transfer payments (see NBER memo). This declined in February to $9,006.4 billion (SAAR) from $9,020.2 billion in January, and is barely above the low of September 2009 ($9,000 billion).
 This graph shows real personal income less transfer payments since 1969.
This measure of economic activity is moving sideways - similar to what happened following the 2001 recession.
To sum it up:
This is a decent report for PCE, but PCE growth is not sustainable without income growth.
Sunday, March 28, 2010
Edmunds.com: Vehicle Sales driven by Incentives in March
by Calculated Risk on 3/28/2010 08:24:00 PM
In the earlier Weekly Summary and a Look Ahead post, I forgot to mention that U.S. vehicle sales will be released on Thursday.
From Edmunds.com:
Edmunds.com analysts predict that March's Seasonally Adjusted Annualized Rate (SAAR) will be 12.4 million, up from 10.3 million in February 2010.
“Although this SAAR sounds promising, it’s too early to wave the flag and say that the economy has turned the corner,” Edmunds.com CEO Jeremy Anwyl told AutoObserver.com. “Incentives drove sales this month, but those were defensive moves in response to Toyota stepping up incentives and are unlikely to last because inventories are simply not high enough to justify them in the long term.”
 Click on graph for larger image in new window.
This graph shows the historical light vehicle sales (seasonally adjusted annual rate) from the BEA (blue) and a forecast for March from Edmunds.com.
Excluding the cash-for-clunkers month of August 2009, Edmunds is forecasting the highest sales rate since Sept 2008.
As Edmunds notes, the expected jump in March sales was driven by Toyota's incentive program to regain market share - and the response of the other manufacturers. As always I'll be posting the sales reports and an estimate of the SAAR around 4 PM ET on Thursday.
Weekly Summary and a Look Ahead
by Calculated Risk on 3/28/2010 12:30:00 PM
The employment report for March will be the focus this week, but there are several other key releases too.
On Monday, the Personal Income and Outlays report for February will be released by the BEA at 8:30 AM. The consensus is for a 0.1% increase in income and 0.3% increase in spending. This will provide a reasonable estimate of Q1 Personal Consumption Expenditure (PCE) growth.
On Tuesday, the January Case-Shiller house Price Index will be released at 9:00 AM. The consensus is for a small decline in prices (not seasonally adjusted). Consumer confidence will be released at 10 AM and former Fed Chairman Paul Volcker will be speaking on financial reform at noon.
On Wednesday, the ADP March employment report will be released (consensus is for 40,000 net private sector payroll jobs in March). This report excludes all government jobs and is not distorted by the temporary Census hiring. At 9:45 AM the Chicago PMI index for March will be released (consensus is for expansion, but at a slower rate than in February). At 10 AM, the Census Bureau will release the February Factory Orders report.
Also on Wednesday, Atlanta Fed President Dennis Lockhart will speak about employment.
On Thursday, the closely watched initial weekly unemployment claims will be released. Also the ISM Manufacturing Index for March at 10 AM (Consensus is for slightly less expansion in March), and Census Bureau will release February Construction Spending at 10 AM (consensus is for a decline of about 1.1%).
Also on Thursday, personal bankrutpcy filings for March will be released. Update: Also on Thursday, the auto manufacturers will releases March sales. The expectation is for a sharp rise to over 12 million units (SAAR) because of incentives.
And on Friday, the BLS will release the March employment report. The consensus is for 190,000 net payroll jobs, however this is distorted by both the February snow storms and temporary Census hiring (see Employment: March Madness). The consensus is for no change in the unemployment rate (9.7%), but historically the Census hiring has pushed down the unemployment rate in the March to May period – so we might see a slight decline. Goldman Sachs is estimate net payrolls increased 275,000 in March.
Also on Friday the FDIC will probably close several more banks. Once again I’ll be watching Puerto Rico!
And a summary of last week ...
A few stories:HAMP Principal Write-downs More on HAMP "Improvements" From David Streitfeld at the NY Times: A Bold U.S. Plan to Help Struggling Homeowners From Renae Merle at the WaPo: Second mortgages complicate efforts to help homeowners
The Census Bureau reported New Home Sales in February were at a seasonally adjusted annual rate (SAAR) of 308 thousand. This is a new record low and a decrease from the revised rate of 315 thousand in January (revised from 309 thousand).
 Click on graph for larger image in new window.
The first graph shows monthly new home sales (NSA - Not Seasonally Adjusted).
Note the Red columns for 2010. In February 2010, 24 thousand new homes were sold (NSA).
This is below the previous record low of 29 thousand hit three times; in February 2009, 1982 and 1970.
 The second graph shows New Home Sales vs. recessions for the last 45 years. New Home sales fell off a cliff, but after increasing slightly, are now 6% below the previous record low in January 2009.
 Sales of new single-family houses in February 2010 were at a seasonally adjusted annual rate of 308,000, according to estimates released jointly today ... This is 2.2 percent (±15.3%)* below the revised January rate of 315,000 and is 13.0 percent (±12.2%) below the February 2009 estimate of 354,000.Obviously this was another extremely weak report.
 This graph shows existing home sales, on a Seasonally Adjusted Annual Rate (SAAR) basis since 1993.
 Sales in February 2010 (5.02 million SAAR) were 0.6% lower than last month, and were 7.0% higher than February 2009 (4.69 million SAAR).
Note: existing home sales are counted at closing, so even though contracts must be signed in April to qualify for the tax credit, buyers have until June 30th to close.
 The second graph shows nationwide inventory for existing homes.
According to the NAR, inventory increased to 3.59 million in February from 3.27 million in January. The all time record high was 4.57 million homes for sale in July 2008.
Inventory is not seasonally adjusted and there is a clear seasonal pattern - inventory should increase further in the spring.
Note: This index is a leading indicator for Commercial Real Estate (CRE) investment.
 This graph shows the Architecture Billings Index since 1996. The index has remained below 50, indicating falling demand, since January 2008.
Historically, according to the AIA, there is an "approximate nine to twelve month lag time between architecture billings and construction spending" on non-residential construction. This suggests further significant declines in CRE investment through all of 2010, and probably longer.
 Here is a comparison of the Moodys/REAL Commercial Property Price Index (CPPI) and the Case-Shiller composite 20 index.
CRE prices only go back to December 2000.
The Case-Shiller Composite 20 residential index is in blue (with Dec 2000 set to 1.0 to line up the indexes).
CRE prices peaked in late 2007 and are now 40% below the peak in October 2007. Prices are at about the same level as early 2003.
Last week the Department of Transportation (DOT) reported that vehicle miles driven in January were down from January 2009:
Travel on all roads and streets changed by -1.6% (-3.7 billion vehicle miles) for January 2010 as compared with January 2009. Travel for the month is estimated to be 222.8 billion vehicle miles.
 This graph shows the percent change from the same month of the previous year as reported by the DOT.
 As the DOT noted, miles driven in January 2010 were down -1.6% compared to January 2009, and miles driven have declined 2.9% compared to January 2008, and are down 4.7% compared to January 2007. This is a multi-year decline, and miles driven appear to be falling again.
From the BLS: Regional and State Employment and Unemployment Summary
 This graph shows the high and low unemployment rates for each state (and D.C.) since 1976. The red bar is the current unemployment rate (sorted by the current unemployment rate).
Fifteen states and D.C. now have double digit unemployment rates. New Jersey and Indiana are close.
Four states and set new series record highs: Florida, Nevada, Georgia and North Carolina. Three other states tied series record highs: California, Rhode Island and South Carolina.
Best wishes to all.
Aargh! Beware of reporting on the March Employment Report
by Calculated Risk on 3/28/2010 09:20:00 AM
I read this from Bloomberg this morning: Payrolls Probably Increased in March
Employers in the U.S. probably added jobs in March for the second time in more than two years, setting the stage for a broadening of the expansion, economists said before a report this week.Aargh.
Payrolls probably rose by 190,000, the most in three years, after declining 36,000 in February, according to the median forecast of 62 economists surveyed by Bloomberg News before the Labor Department’s April 2 report.
As I noted earlier this month in Employment: March Madness, a headline number of 200,000 net payroll jobs might be considered weak!
The March report will be distorted by two factors: 1) any bounce back from the snow storms in February, and 2) the decennial Census hiring that picked up sharply in March.
These are real payroll jobs, but the Census hiring is temporary - and the Census jobs that are added in March, April and May will all be lost over the following 6+ months.
What we are interested in is the underlying trend of payroll job growth. To find that number we need to adjust for the Census jobs (although they are reported NSA), and we also need to adjust for the February snow storms. Later this year we will need to add the Census jobs back to find the trend.
The important point is 190,000 is probably a weak number for March - and probably not "setting the stage for a broadening of the expansion" - although we need to see the details.
Saturday, March 27, 2010
Growth of Problem Banks (Unofficial)
by Calculated Risk on 3/27/2010 09:49:00 PM
By request here is a graph of the number of banks on the unofficial problem bank list over time.
We started posting the Unofficial Problem Bank list in early August 2009 (credit: surferdude808). The FDIC's official problem bank list is comprised of banks with a CAMELS rating of 4 or 5, and the list is not made public (just the number of banks and assets every quarter). Note: Bank CAMELS ratings are not made public.
CAMELS is the FDIC rating system, and stands for Capital adequacy, Asset quality, Management, Earnings, Liquidity and Sensitivity to market risk. The scale is from 1 to 5, with 1 being the strongest.
As a substitute for the CAMELS ratings, surferdude808 is using publicly announced formal enforcement actions, and also media reports and company announcements that suggest to us an enforcement action is likely, to compile a list of possible problem banks in the public interest. Some of this data is released with a lag, for example the FDIC announced the February enforcement actions yesterday. Click on graph for larger image in new window.
This graph shows the number of banks on the unofficial list. The number has grown by almost 76% since early August 2009 - even with all the bank failures (failures are removed from the list).
The three red dots are the number of banks on the official problem bank list as announced in the FDIC quarterly banking profile for Q2, Q3, and Q4. The dots are lagged one month because of the delay in announcing formal actions.
The unofficial count is close, but is slightly lower than the official count - probably mostly due to timing issues.
Based on the current trend, there is a reasonable chance that the unofficial problem bank list will be over 1,000 banks later this year ...
Leonhardt: "Heading Off the Next Financial Crisis"
by Calculated Risk on 3/27/2010 05:36:00 PM
Here is a long piece from David Leonhardt in the New York Times Sunday magazine: Heading Off the Next Financial Crisis (ht Ann). A few excerpts:
To reduce the odds of a future crisis, the Obama plan would take three basic steps. First, regulators would receive more authority to monitor everything from mortgages to complex securities. This is meant to keep future financial time bombs, like the no-documentation loans and collateralized debt obligations of the past decade, from becoming rife. Second — and most important — financial firms would be forced to reduce the debt they take on and to hold more capital in reserve. This is the equivalent of requiring home buyers to make larger down payments: more capital will give firms a bigger cushion when investments start to go bad. Finally, if that cushion proves insufficient, the government would be allowed to seize a collapsing financial firm, much as it can already do with a traditional bank. Regulators would then keep the firm operating long enough to prevent a panic and slowly sell off its pieces.And on the stress tests ...
Will this work? It is difficult to know. No one can be sure where the next bubble or crisis will come from or, as a result, how to prevent it.
The crisis has made Wall Street much more conservative. But this will not last. It never does. Left to their own devices, financial firms will again take on big debts and big risks. They have a lot of incentive to do so. A Wall Street Journal analysis found that if one set of stricter leverage standards had been in place during the five years before the crisis, it would have reduced the biggest firms’ profitability by almost 25 percent.The banks hate the stress tests because they will expose their risk taking (and therefore reduce short term profits) - and they will fight hard to not have the tests part of the regular regulatory practice. That is a strong argument for making the stress tests a regular practice. Publish the test scenarios - and the results for each bank.
The model for setting future capital rules is the stress tests that the Fed conducted last year to gauge the strength of individual banks. Geithner convinced Obama to make those tests a core part of the financial-rescue strategy, and they ended up being something of a turning point in the crisis.
...
The stress tests, remember, were conducted when banks were financially and politically weak. When times were good over the previous decade, Fed officials — and not just Alan Greenspan — neglected to use the powers they did have. They came to believe the bubble rationales that Wall Street offered. It is not hard to see how that could happen again. The most telling case study may be Geithner himself.
Leonhardt covers a lot of ground ... a nice weekend read.
Fed's Tarullo Argues for Regular Stress Tests with Public Release of Results
by Calculated Risk on 3/27/2010 12:59:00 PM
From Fed Governor Daniel Tarullo: Lessons from the Crisis Stress Tests
The Supervisory Capital Assessment Program (SCAP) was fashioned in early 2009 as a key element of a crucial plan to stabilize the U.S. financial system. The stress tests, as they have been popularly called, required development on the fly, and under enormous pressure, of ideas that academics and supervisors had been considering for some time. After describing the concept, design, and implementation of last year's tests, I will explain how our experience has helped prompt major changes in Federal Reserve supervision of the nation's largest financial institutions. Then I will discuss how this experience has stimulated debate over the merits of publicly releasing supervisory information.Tarullo reviews the stress tests, and then argues that the public release of data was helpful (I agree):
As you know, unlike other countries that conducted stress exercises, we took the highly unusual step of publicly reporting the findings of the SCAP, including the capital needs and loss estimates for each of the 19 banks. This departure from the standard practice of keeping examination information confidential was based on the belief that greater transparency of the process and findings would help restore confidence in U.S. banks at a time of great uncertainty. Supervisors released the methodology and assumptions underlying the stress test first and then, two weeks later, the results for individual institutions. ...And then Tarullo argues for regular stress tests (I agree again):
The merits of publicly releasing firm-specific SCAP results were much debated within the Federal Reserve. In particular, some feared that weaker banks might be significantly harmed by the disclosures. In the end, though, market participants vindicated our decision.
To this end, the Federal Reserve is now implementing a more closely coordinated supervisory system in which a cross-firm, horizontal perspective is an organizing supervisory principle. We will concentrate on all activities within the holding companies that can create risk to the firm and the financial system, not just those that increase risk for insured depository institutions.And Turallo argues the macro assumptions and the individual stress test results should be made public:
An essential component of this new system will be a quantitative surveillance mechanism for large, complex financial organizations that will combine a more macroprudential, multidisciplinary approach with the horizontal perspective. Quantitative surveillance will use supervisory information, firm-specific data analysis, and market-based indicators to identify developing strains and imbalances that may affect multiple institutions, as well as emerging risks to specific firms. Periodic forward-looking scenario analyses will enhance our understanding of the potential effects of adverse changes in the operating environment on individual firms and on the system as a whole.
In fact, I believe that the most useful steps toward creating a practical, macroprudential supervisory perspective will be those that connect the firm-specific information and insight gained from traditional microprudential supervision to analysis of systemwide developments and emerging stresses. Here, precisely, is where our SCAP experience has helped lead the way.
[T]he release of details about assumptions, methods, and conclusions would expose the supervisory approach to greater outside scrutiny and discussion. Sometimes those discussions will help us improve our assumptions or methodology. At other times disclosure might reassure investors about the quality of the tests. Either way, the public's reaction to our assumptions and methods would be useful.I supported the stress tests of the largest financial institutions and I think this would be a helpful regular exercise (probably on an annual basis). I think another set of macro assumptions should be released (base case and severe), and the same level of detailed company specific information be released as for the SCAP.
...
[To increase transparency, the supervisors could] follow the SCAP precedent, with periodic release of detailed information about the assumptions, methods, and results of a cross-firm, horizontal, forward-looking exercise, including firm-specific outcomes. This approach would probably maximize both the potential benefits and potential risks. Note, however, that the possibility of a destabilizing market reaction may be lower if such information is released frequently, as major unpleasant surprises would be less likely with frequent, detailed disclosures.
The FSA is already doing regular stress tests in the U.K.:
We have now embedded our new approach to stress testing into our normal supervisory process. This includes supplementing firms’ own stress testing with supervisory stress testing of major firms. This involves regularly updating the stress test scenarios.The initial stress tests were very helpful, I think it is time for the Treasury and Fed to release another set of macro assumptions and stress test the banks again - and also release the company specific results.
Morning HAMP
by Calculated Risk on 3/27/2010 08:45:00 AM
Two articles and a favorable reaction from Laurie Goodman at Amherst ...
The Obama administration is about to ramp up its efforts to tackle second mortgages as part of an aggressive program announced by the White House on Friday to address foreclosures. ... Government officials have estimated that about 50 percent of troubled borrowers have a second mortgage. But a year after federal officials launched an initial program to lower payments on these second loans, not a single homeowner has been helped.Note: Merle is referring to the HAMP Second Lien Modification Program (2MP) to modify 2nd liens - and that program was updated yesterday too.
...
Just a few banks hold most of the second liens, according to data from Inside Mortgage Finance. Of the more than $840 billion in home-equity lines and piggyback loans outstanding, Bank of America has about $147 billion of them, while Wells Fargo and J.P. Morgan Chase have $124 billion and $118 billion of the market, respectively. Citigroup has about $53 billion of these loans on its books.
They have all signed up for the administration program announced last year, but none has taken action yet.
The new measures ... are aimed not only at the seven million households that are behind on their mortgages but, in a significant expansion of aid that proved immediately controversial, the 11 million that simply owe more on their homes than they are worth.
...
The latest programs, together with foreclosure assistance efforts already in place, are aimed at helping as many as four million embattled owners keep their houses. But the measures, which will take as long as six months to put into practice, might easily fall victim to some of the conflicting interests that have bedeviled efforts to date. None of these programs have the force of law, and lenders have often seen no good reason to participate.
To lubricate its efforts, the government plans to spread taxpayers’ money around liberally. ... All told, the new measures are expected to cost about $50 billion.
Today’s Treasury announcement represents a huge step forward in efforts to address the housing crisis. We have argued repeatedly that the housing market has two deep underlying problems: (1) “housing overhang” (i.e. the number of loans that are already in delinquent status or in foreclosure, most of which have substantial negative equity) and (2) the large number of borrowers with negative equity who are still paying but who are destined to go delinquent. We have estimated the housing overhang at >7 million units. Add to that the borrowers with considerable negative equity who have not yet defaulted and we arrive at approximately 12 million borrowersAlthough I'm not as optimistic as Goodman on the principal reduction program (as far as the number of homeowners who will be helped), these new program are a significant change. I've calling 2010 the "year of the short sale" and I think the HAFA short sale changes (like doubling the amount 2nd lien holders receive) will have an impact.
conceivably facing foreclosure over the next few years.
...
While there is no silver bullet to solving the housing crisis, we believe Treasury’s new program attacks the real problem: negative equity.
...
The changes in the HAMP modification program, with principal reduction moved front and center, is a very important development. While the actual impact depends on the implementation details, we believe this will dramatically improve the success rate on mortgage modifications. This will, in turn, help cushion future home price depreciation, and limit further housing market deterioration.
Friday, March 26, 2010
Unofficial Problem Bank List increases to 684
by Calculated Risk on 3/26/2010 11:54:00 PM
This is an unofficial list of Problem Banks compiled only from public sources. Changes and comments from surferdude808:
As anticipated last week, the FDIC released its enforcement actions for February, which contributed to major changes in the Unofficial Problem Bank List. The list includes 684 institutions with aggregate assets of $351.2 billion, up from 653 institutions with assets of $332 billion last week.The list is compiled from regulator press releases or from public news sources (see Enforcement Action Type link for source). The FDIC data is released monthly with a delay, and the Fed and OTC data is more timely. The OCC data is a little lagged. Credit: surferdude808.
Additions are 35 institutions with assets of $20.3 billion while 4 institutions with assets of $1 billion were removed. Removals include the three failures this week -- Desert Hills Bank ($497 million), Unity National Bank ($301 million), and Key West Bank ($88 million), and one action termination against Citizens Bank, New Tazewell, TN ($150 million).
Most notable among the 35 additions are Citizens Bank, Flint, MI ($11.3 billion Ticker: CRBC); Mile High Banks, Longmont, CO ($1.3 billion); United Security Bank, Fresno, CA ($694 million Ticker: UBFO); First Central Savings Bank, Glen Cove, NY ($683 million); and Finance Factors, Ltd., Honolulu, HI ($654 million).
In addition, Bank of Florida Corporation (Ticker: BOFL), with consolidated assets of $1.5 billion, announced that its three banking subsidiaries -- Bank of Florida - Southeast, Bank of Florida - Southwest, and Bank of Florida - Tampa Bay, received a Prompt Corrective Action order from the FDIC. The other new addition via a Prompt Corrective Action is AmericanFirst Bank, Clermont, FL ($90 million).
A few institutions already on the list also received a Prompt Corrective Action order including AmericanWest Bank, Spokane, WA ($1.6 billion Ticker: AWBC.PK); Ventura County Business Bank, Oxnard, CA ($93 million Ticker: VCBB.OB); and High Desert State Bank, Albuquerque, NM ($82 million).
See description below table for Class and Cert (and a link to FDIC ID system).
For a full screen version of the table click here.
The table is wide - use scroll bars to see all information!
NOTE: Columns are sortable - click on column header (Assets, State, Bank Name, Date, etc.)
Class: from FDIC
The FDIC assigns classification codes indicating an institution's charter type (commercial bank, savings bank, or savings association), its chartering agent (state or federal government), its Federal Reserve membership status (member or nonmember), and its primary federal regulator (state-chartered institutions are subject to both federal and state supervision). These codes are:Cert: This is the certificate number assigned by the FDIC used to identify institutions and for the issuance of insurance certificates. Click on the number and the Institution Directory (ID) system "will provide the last demographic and financial data filed by the selected institution".N National chartered commercial bank supervised by the Office of the Comptroller of the Currency SM State charter Fed member commercial bank supervised by the Federal Reserve NM State charter Fed nonmember commercial bank supervised by the FDIC SA State or federal charter savings association supervised by the Office of Thrift Supervision SB State charter savings bank supervised by the FDIC
Bank Failure #41: Desert Hills Bank, Phoenix, Arizona
by Calculated Risk on 3/26/2010 07:03:00 PM
Not with the sound of money
But with banks failing
by Soylent Green is People
From the FDIC:New York Community Bank, Westbury, New York, Assumes All of the Deposits of Desert Hills Bank, Phoenix, Arizona
Desert Hills Bank, Phoenix, Arizona, was closed today by the Arizona Department of Financial Institutions, which appointed the Federal Deposit Insurance Corporation (FDIC) as receiver....Hey - the FDIC used #40 twice! This is really 41 ...
As of December 31, 2009, Desert Hills Bank had approximately $496.6 million in total assets and $426.5 million in total deposits. ...
The FDIC estimates that the cost to the Deposit Insurance Fund (DIF) will be $106.7 million. .... Desert Hills Bank is the 40th FDIC-insured institution to fail in the nation this year, and the first in Arizona. The last FDIC-insured institution closed in the state was Valley Capital Bank, N.A., Mesa, on December 11, 2009.
Bank Failures #38, #39 and #40: Florida and Georgia
by Calculated Risk on 3/26/2010 06:07:00 PM
Banks versus Bair's big sluggers
First inning triple.
by Soylent Green is People
From the FDIC: CharterBank, West Point, Georgia, Assumes All of the Deposits of McIntosh Commercial Bank, Carrollton, Georgia
McIntosh Commercial Bank, Carrollton, Georgia, was closed today by the Georgia Department of Banking and Finance, which appointed the Federal Deposit Insurance Corporation (FDIC) as receiver. ...From the FDIC: Centennial Bank, Conway, Arkansas, Assumes All of the Deposits of Key West Bank, Key West, Florida
As of December 31, 2009, McIntosh Commercial Bank had approximately $362.9 million in total assets and $343.3 million in total deposits. ...
The FDIC estimates that the cost to the Deposit Insurance Fund (DIF) will be $123.3 million. ... McIntosh Commercial Bank is the 38th FDIC-insured institution to fail in the nation this year, and the sixth in Georgia. The last FDIC-insured institution closed in the state was Bank of Hiawassee, Hiawassee, on March 19, 2010.
Key West Bank, Key West, Florida, was closed today by the Office of Thrift Supervision, which appointed the Federal Deposit Insurance Corporation (FDIC) as receiver. ...From the FDIC: Bank of the Ozarks, Little Rock, Arkansas, Assumes All of the Deposits of Unity National Bank, Cartersville, Georgia
As of December 31, 2009, Key West Bank had approximately $88.0 million in total assets and $67.7 million in total deposits....
The FDIC estimates that the cost to the Deposit Insurance Fund (DIF) will be $23.1 million. ... Key West Bank is the 39th FDIC-insured institution to fail in the nation this year, and the sixth in Florida. The last FDIC-insured institution closed in the state was Old Southern Bank, Orlando, on March 12, 2010.
Unity National Bank, Cartersville, Georgia, was closed today by the Office of the Comptroller of the Currency, which appointed the Federal Deposit Insurance Corporation (FDIC) as receiver....It is Friday!
As of December 31, 2009, Unity National Bank had approximately $292.2 million in total assets and $264.3 million in total deposits. ...
The FDIC estimates that the cost to the Deposit Insurance Fund (DIF) will be $67.2 million. ... Unity National Bank is the 40th FDIC-insured institution to fail in the nation this year, and the seventh in Georgia. The last FDIC-insured institution closed in the state was McIntosh Commercial Bank, Carrollton, earlier today.
More on HAMP "Improvements"
by Calculated Risk on 3/26/2010 02:49:00 PM
There are four elements to the Making Home Affordable Program Enhancements:
1. Temporary Assistance for Unemployed Homeowners While They Search for Re-EmploymentThe focus is on principal writedowns, but possibly the bigger impact will be from the fourth point - the HAFA program (short sales and deed-in-lieu).
2. Requirement to Consider Alternative Principal Write-down Approach and Increased Principal Write-down Incentives
3. Improvements to Reach More Borrowers with HAMP Modifications
4. Helping Homeowners Move to More Affordable Housing
The temporary assistance is just that - temporary. Hopefully the homeowner will find a job otherwise most borrowers will be moved on to #4.
4. Helping Homeowners Move to More Affordable HousingI think this change will impact the most borrowers (I think principal reduction will be a limited tool). Treasury is doubling the incentive for 2nd lien holders (may still not be enough), and increasing the incentive for servicers and borrowers.Increase incentives to provide more homeowners with foreclosure alternatives Increase payoffs to subordinate lien holders who agree to release borrowers from debt to facilitate greater use of foreclosure alternatives including short sales or deeds-in-lieu. The new payoff schedule allows servicers to increase the maximum payoff to subordinate lien holders to 6 percent of the outstanding loan balance and doubles from $1,000 to $2,000 the incentive reimbursement that is available to investors for subordinate lien payoffs, subject to an overall cap of $6,000. Increase servicer incentive payments from $1,000 to $1,500 to increase use of foreclosure alternatives and encourage additional outreach to homeowners unable to complete a modification. Double relocation assistance payment for borrowers successfully completing foreclosure alternative to $3,000 Help homeowners who use a short sale or deed-in-lieu to transition more quickly to housing they can afford.
This is the HAFA program that is scheduled to start in early April. This will probably only apply to around 3 million of the 8 million homeowners who are delinquent on their mortgage (initial guess). And probably only about half of those 3 million will receive a modification or use a short sale.


