by Calculated Risk on 3/28/2010 12:30:00 PM
Sunday, March 28, 2010
Weekly Summary and a Look Ahead
The employment report for March will be the focus this week, but there are several other key releases too.
On Monday, the Personal Income and Outlays report for February will be released by the BEA at 8:30 AM. The consensus is for a 0.1% increase in income and 0.3% increase in spending. This will provide a reasonable estimate of Q1 Personal Consumption Expenditure (PCE) growth.
On Tuesday, the January Case-Shiller house Price Index will be released at 9:00 AM. The consensus is for a small decline in prices (not seasonally adjusted). Consumer confidence will be released at 10 AM and former Fed Chairman Paul Volcker will be speaking on financial reform at noon.
On Wednesday, the ADP March employment report will be released (consensus is for 40,000 net private sector payroll jobs in March). This report excludes all government jobs and is not distorted by the temporary Census hiring. At 9:45 AM the Chicago PMI index for March will be released (consensus is for expansion, but at a slower rate than in February). At 10 AM, the Census Bureau will release the February Factory Orders report.
Also on Wednesday, Atlanta Fed President Dennis Lockhart will speak about employment.
On Thursday, the closely watched initial weekly unemployment claims will be released. Also the ISM Manufacturing Index for March at 10 AM (Consensus is for slightly less expansion in March), and Census Bureau will release February Construction Spending at 10 AM (consensus is for a decline of about 1.1%).
Also on Thursday, personal bankrutpcy filings for March will be released. Update: Also on Thursday, the auto manufacturers will releases March sales. The expectation is for a sharp rise to over 12 million units (SAAR) because of incentives.
And on Friday, the BLS will release the March employment report. The consensus is for 190,000 net payroll jobs, however this is distorted by both the February snow storms and temporary Census hiring (see Employment: March Madness). The consensus is for no change in the unemployment rate (9.7%), but historically the Census hiring has pushed down the unemployment rate in the March to May period – so we might see a slight decline. Goldman Sachs is estimate net payrolls increased 275,000 in March.
Also on Friday the FDIC will probably close several more banks. Once again I’ll be watching Puerto Rico!
And a summary of last week ...
A few stories:HAMP Principal Write-downs More on HAMP "Improvements" From David Streitfeld at the NY Times: A Bold U.S. Plan to Help Struggling Homeowners From Renae Merle at the WaPo: Second mortgages complicate efforts to help homeowners
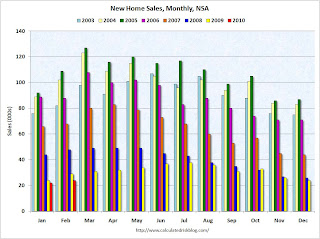
The Census Bureau reported New Home Sales in February were at a seasonally adjusted annual rate (SAAR) of 308 thousand. This is a new record low and a decrease from the revised rate of 315 thousand in January (revised from 309 thousand).
 Click on graph for larger image in new window.
The first graph shows monthly new home sales (NSA - Not Seasonally Adjusted).
Note the Red columns for 2010. In February 2010, 24 thousand new homes were sold (NSA).
This is below the previous record low of 29 thousand hit three times; in February 2009, 1982 and 1970.
 The second graph shows New Home Sales vs. recessions for the last 45 years. New Home sales fell off a cliff, but after increasing slightly, are now 6% below the previous record low in January 2009.
 Sales of new single-family houses in February 2010 were at a seasonally adjusted annual rate of 308,000, according to estimates released jointly today ... This is 2.2 percent (±15.3%)* below the revised January rate of 315,000 and is 13.0 percent (±12.2%) below the February 2009 estimate of 354,000.Obviously this was another extremely weak report.
 This graph shows existing home sales, on a Seasonally Adjusted Annual Rate (SAAR) basis since 1993.
 Sales in February 2010 (5.02 million SAAR) were 0.6% lower than last month, and were 7.0% higher than February 2009 (4.69 million SAAR).
Note: existing home sales are counted at closing, so even though contracts must be signed in April to qualify for the tax credit, buyers have until June 30th to close.
 The second graph shows nationwide inventory for existing homes.
According to the NAR, inventory increased to 3.59 million in February from 3.27 million in January. The all time record high was 4.57 million homes for sale in July 2008.
Inventory is not seasonally adjusted and there is a clear seasonal pattern - inventory should increase further in the spring.
Note: This index is a leading indicator for Commercial Real Estate (CRE) investment.
 This graph shows the Architecture Billings Index since 1996. The index has remained below 50, indicating falling demand, since January 2008.
Historically, according to the AIA, there is an "approximate nine to twelve month lag time between architecture billings and construction spending" on non-residential construction. This suggests further significant declines in CRE investment through all of 2010, and probably longer.
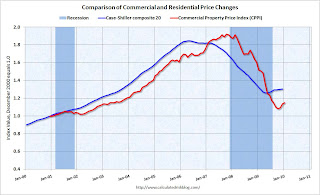
 Here is a comparison of the Moodys/REAL Commercial Property Price Index (CPPI) and the Case-Shiller composite 20 index.
CRE prices only go back to December 2000.
The Case-Shiller Composite 20 residential index is in blue (with Dec 2000 set to 1.0 to line up the indexes).
CRE prices peaked in late 2007 and are now 40% below the peak in October 2007. Prices are at about the same level as early 2003.
Last week the Department of Transportation (DOT) reported that vehicle miles driven in January were down from January 2009:
Travel on all roads and streets changed by -1.6% (-3.7 billion vehicle miles) for January 2010 as compared with January 2009. Travel for the month is estimated to be 222.8 billion vehicle miles.
 This graph shows the percent change from the same month of the previous year as reported by the DOT.
 As the DOT noted, miles driven in January 2010 were down -1.6% compared to January 2009, and miles driven have declined 2.9% compared to January 2008, and are down 4.7% compared to January 2007. This is a multi-year decline, and miles driven appear to be falling again.
From the BLS: Regional and State Employment and Unemployment Summary
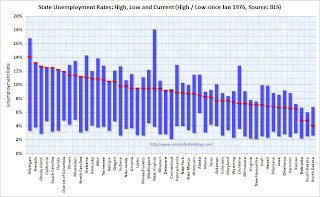
 This graph shows the high and low unemployment rates for each state (and D.C.) since 1976. The red bar is the current unemployment rate (sorted by the current unemployment rate).
Fifteen states and D.C. now have double digit unemployment rates. New Jersey and Indiana are close.
Four states and set new series record highs: Florida, Nevada, Georgia and North Carolina. Three other states tied series record highs: California, Rhode Island and South Carolina.
Best wishes to all.


