by Calculated Risk on 3/17/2009 04:25:00 PM
Tuesday, March 17, 2009
Housing Starts: Is this the Bottom?
Update: Please don't confuse a bottom in single family housing starts with a bottom in house prices! See next post: Housing: Two Bottoms.
The title to this post would have been laughable in 2008 or 2007, but as I noted in Looking for the Sun, there is a reasonable chance housing starts will bottom sometime this year - so I suppose it is not too early to start looking.
A few key points:
 Click on graph for larger image in new window.
From the Census Bureau: "The seasonally adjusted estimate of new houses for sale at the end of January was 342,000. This represents a supply of 13.3 months at the current sales rate."
But the increase in Months of Supply has been driven by the denominator (sales), even though the numerator (inventory) has been falling steadily. note: Months of supply = inventory / sales.
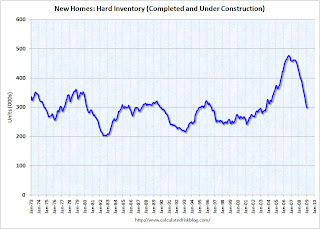
 The second graph shows the level of hard inventory for new homes (completed plus under construction). With starts below sales, hard inventory has been falling for some time.
 Unless sales fall further, the months of supply should start to decline even with the current level of starts.
And this brings up a key point:
However it is possible to compare "Single Family Starts, Built for Sale" to New Home sales on a quarterly basis. The quarterly report shows there were 65,000 single family starts, built for sale, in Q4 2008 and that is less than the 82,000 new homes sold for the same period. This data is Not Seasonally Adjusted (NSA). This suggests homebuilders were selling more homes than they are starting – but not by much.
However starts have fallen much further in Q1 (almost 25% from Q4) although sales have fallen too (we only have January data for sales so far).
Note: new home sales are reported when contracts are signed, so it is appropriate to compare sales to starts (as opposed to completions), although this isn’t perfect because homebuilders have recently been stuck with “unintentional spec homes” because of the high cancellation rates.
 This graph provides a quarterly comparison of housing starts and new home sales. In 2005, and most of 2006, starts were higher than sales, and inventories of new homes rose sharply. For the last several quarters, starts have been below sales – and new home inventories have been falling - but it continues to be a race to the bottom between starts and sales.
 Of course, unless sales stabilize soon, starts might have to fall further.


