 RSS Feed
 by Calculated Risk on 2/28/2011 02:08:00 PM
Showing posts with label retail. Show all posts
Showing posts with label retail. Show all posts
Monday, February 28, 2011
Restaurant Performance Index declines in January
This is one of several industry specific indexes I track each month.
 Click on graph for larger image in graph gallery.
The index declined to 100.2 in January, barely indicating expansion.
More "Blame it on the snow!"
Unfortunately the data for this index only goes back to 2002.
From the National Restaurant Association: Restaurant Performance Index Declined in January Amid Weather-Dampened Sales and Traffic Levels
The National Restaurant Association’s Restaurant Performance Index (RPI) – a monthly composite index that tracks the health of and outlook for the U.S. restaurant industry – stood at 100.2 in January, down 0.8 percent from its December level. Despite the decline, January marked the fourth time in the last five months that the RPI stood above 100, which signifies expansion in the index of key industry indicators.
...
Due in large part to extreme weather conditions in some parts of the country, sales levels were dampened in January. Thirty-nine percent of restaurant operators reported a same-store sales gain between January 2010 and January 2011, down from 48 percent of operators who reported higher same-store sales in December.
...
Restaurant operators also reported a net decline in customer traffic levels in January.
...
For the fourth consecutive month, restaurant operators reported a positive outlook for staffing gains in the months ahead.
Tuesday, February 15, 2011
Retail Sales increased 0.3% in January
by Calculated Risk on 2/15/2011 08:30:00 AM
On a monthly basis, retail sales increased 0.3% from December to January(seasonally adjusted, after revisions), and sales were up 7.8% from January 2010.
 Click on graph for larger image in new window.
This graph shows retail sales since 1992. This is monthly retail sales, seasonally adjusted (total and ex-gasoline).
Retail sales are up 13.7% from the bottom, and now 0.4% above the pre-recession peak.

The second graph shows the year-over-year change in retail sales (ex-gasoline) since 1993.
Retail sales ex-gasoline increased by 7.1% on a YoY basis (7.8% for all retail sales).
Here is the Census Bureau report:
The U.S. Census Bureau announced today that advance estimates of U.S. retail and food services sales for January, adjusted for seasonal variation and holiday and trading-day differences, but not for price changes, were $381.6 billion, an increase of 0.3 percent (±0.5%) from the previous month, and 7.8 percent (±0.7%) above January 2010.This was below expectations for a 0.5% increase. Retail sales ex-autos were up 0.3%; also below expectations of a 0.5% increase. Although lower than expected, retail sales are now above the pre-recession peak in November 2007.
• Also, from the NY Fed: Empire State Manufacturing Survey
The Empire State Manufacturing Survey indicates that conditions for New York manufacturers continued to improve in February. The general business conditions index rose 3.5 points to 15.4. The new orders index edged down just slightly, to 11.8. The shipments index retreated 14 points, reversing much of January's 18-point surge, but remained positive at 11.3. The inventories index continued to climb from its December low, reaching its highest level since April. The index for number of employees fell, but the average workweek measure moved up. The prices paid index climbed to a two-and-a half-year high in February, but the measure for prices received was little changed, suggesting some pressure on profit margins. The forward-looking indexes continued to signal widespread optimism, though to a somewhat lesser degree than in January. Indexes for expected prices, both paid and received, declined moderately, after reaching multiyear highs last month.This was slightly above expectations for an increase to 15.0.
Monday, January 31, 2011
Restaurant Performance Index Shows Expansion in December
by Calculated Risk on 1/31/2011 11:54:00 PM
This is one of several industry specific indexes I track each month.
 Click on graph for larger image in graph gallery.
Unfortunately the data for this index only goes back to 2002.
Note: Any reading above 100 shows expansion for this index.
From the National Restaurant Association (NRA): Restaurant Industry Entering 2011 on Positive Note, as Restaurant Performance Index Posted Strong Gain in December
Driven by expanding same-store sales and customer traffic levels as well as growing optimism among restaurant operators, the outlook for the restaurant industry improved in December. The National Restaurant Association’s Restaurant Performance Index (RPI) – a monthly composite index that tracks the health of and outlook for the U.S. restaurant industry – stood at 101.0 in December, up a strong 1.1 percent from its November level.
...
For the third time in the last four months, restaurant operators reported a net increase in same-store sales. ... Restaurant operators also reported a net increase in customer traffic levels in December.
Friday, January 14, 2011
Retail Sales increased 0.6% in December
by Calculated Risk on 1/14/2011 08:30:00 AM
On a monthly basis, retail sales increased 0.6% from November to December(seasonally adjusted, after revisions), and sales were up 7.9% from December 2009.
 Click on graph for larger image in new window.
This graph shows retail sales since 1992. This is monthly retail sales, seasonally adjusted (total and ex-gasoline).
Retail sales are up 13.5% from the bottom, and now 0.2% above the pre-recession peak.

The second graph shows the year-over-year change in retail sales (ex-gasoline) since 1993.
Retail sales ex-gasoline increased by 7.4% on a YoY basis (7.9% for all retail sales).
Here is the Census Bureau report:
The U.S. Census Bureau announced today that advance estimates of U.S. retail and food services sales for December, adjusted for seasonal variation and holiday and trading-day differences, but not for price changes, were $380.9 billion, an increase of 0.6 percent (±0.5%) from the previous month, and 7.9 percent (±0.7%) above December 2009. Total sales for the 12 months of 2010 were up 6.6 percent (±0.4%) from 2009. Total sales for the October through December 2010 period were up 7.8 percent(±0.5%) from the same period a year ago. The October to November 2010 percent change was unrevised from +0.8 percent (±0.2%).This was below expectations for a 0.8% increase. Retail sales ex-autos were up 0.5%; also below expectations of a 0.7% increase.
Although slightly lower than expected, retail sales are now above the pre-recession peak in November 2007.
Monday, January 03, 2011
Restaurant Performance Index slips in November
by Calculated Risk on 1/03/2011 03:30:00 PM
This is one of several industry specific indexes I track each month.
 Click on graph for larger image in new window.
Unfortunately the data for this index only goes back to 2002.
Note: Any reading above 100 shows expansion for this index.
From the National Restaurant Association (NRA): Restaurant Performance Index Declined in November as Sales and Traffic Slipped
As a result of a downtick in same-store sales and customer traffic levels, the National Restaurant Association’s Restaurant Performance Index (RPI) fell below 100 in November. The RPI – a monthly composite index that tracks the health of and outlook for the U.S. restaurant industry – stood at 99.9 in November, down 0.8 percent from October. November marked the first time in three months that the RPI stood below 100, the level above which signifies expansion in the index of key industry indicators.This is just one month of slight contraction, but something to watch.
...
For the first time in three months, restaurant operators reported a net decline in same-store sales. ... Restaurant operators also reported a net decline in customer traffic levels in November.
Tuesday, December 14, 2010
Retail Sales increase 0.8% in November
by Calculated Risk on 12/14/2010 08:50:00 AM
On a monthly basis, retail sales increased 0.8% from October to November(seasonally adjusted, after revisions), and sales were up 7.7% from November 2009.
 Click on graph for larger image in new window.
This graph shows retail sales since 1992. This is monthly retail sales, seasonally adjusted (total and ex-gasoline).
Retail sales are up 12.8% from the bottom, and only off 0.3% from the pre-recession peak.
 The second graph shows the year-over-year change in retail sales (ex-gasoline) since 1993.
Retail sales ex-gasoline increased by 6.9% on a YoY basis (7.7% for all retail sales).
Here is the Census Bureau report:
The U.S. Census Bureau announced today that advance estimates of U.S. retail and food services sales for November, adjusted for seasonal variation and holiday and trading-day differences, but not for price changes, were $378.7 billion, an increase of 0.8 percent (±0.5%) from the previous month, and 7.7 percent (±0.7%) above November 2009. Total sales for the September through November 2010 period were up 7.8 percent (±0.5%) from the same period a year ago. The September to October 2010 percent change was revised from +1.2 percent (±0.5%) to +1.7 percent (±0.2%).This was above expectations for a 0.6% increase (and October was revised up). Retail sales ex-autos were up 1.2%, above expectations of a 0.6% increase.
Retail sales are almost back to the pre-recession peak in November 2007.
Monday, November 29, 2010
Restaurant Performance Index highest in three years
by Calculated Risk on 11/29/2010 10:45:00 PM
This is one of several industry specific indexes I track each month.
 Click on graph for larger image in new window.
Unfortunately the data for this index only goes back to 2002.
Note: Any reading above 100 shows expansion for this index.
From the National Restaurant Association (NRA): Restaurant Performance Index highest in three years
"The National Restaurant Association’s Restaurant Performance Index in October reached 100.7. This is the highest level for the index in over three years, since September 2007, and reflects a strengthening environment of consumer spending at restaurants." said Hudson Riehle, senior vice president of the Research and Knowledge Group for the National Restaurant Association.
Restraurants are a discretionary expense, and this expansion suggests consumers are becoming more confident.
Monday, November 15, 2010
Retail Sales increase 1.2% in October
by Calculated Risk on 11/15/2010 08:30:00 AM
On a monthly basis, retail sales increased 1.2% from September to October (seasonally adjusted, after revisions), and sales were up 7.3% from October 2009.
Retail sales increased 0.4% ex-autos - about at expectations.
 Click on graph for larger image in new window.
This graph shows retail sales since 1992. This is monthly retail sales, seasonally adjusted (total and ex-gasoline).
Retail sales are up 11.2% from the bottom, and only off 1.8% from the pre-recession peak.
 The second graph shows the year-over-year change in retail sales (ex-gasoline) since 1993.
Retail sales ex-gasoline increased by 6.6% on a YoY basis (7.3% for all retail sales).
Here is the Census Bureau report:
The U.S. Census Bureau announced today that advance estimates of U.S. retail and food services sales for October, adjusted for seasonal variation and holiday and trading-day differences, but not for price changes, were $373.1 billion, an increase of 1.2 percent (±0.5%) from the previous month, and 7.3 percent (±0.7%) above October 2009.
Friday, November 05, 2010
Seasonal Retail Hiring off to fast start in October
by Calculated Risk on 11/05/2010 02:21:00 PM
According to the BLS employment report, retailers hired seasonal workers at about the pre-crisis pace in October.
 Click on graph for larger image.
Typically retail companies start hiring for the holiday season in October, and really increase hiring in November. Here is a graph that shows the historical net retail jobs added for October, November and December by year.
This really shows the collapse in retail hiring in 2008 and modest rebound in 2009.
Retailers hired 150.9 thousand workers (NSA) net in October. This is about the same level as in 2003 through 2006. Note: this is NSA (Not Seasonally Adjusted), retailers hired 28 thousand workers SA in October.
This suggests retailers are fairly optimistic about the holiday season.
Earlier employment posts:
Wednesday, October 06, 2010
Seasonal Retail Hiring Outlook: "Dim"
by Calculated Risk on 10/06/2010 03:30:00 PM
Typically retail companies start hiring for the holiday season in October, and really increase hiring in November. Here is a graph that shows the historical net retail jobs added for October, November and December by year and a forecast for 2010.
 Click on graph for larger image in new window.
This really shows the collapse in retail hiring in 2008 and the weak recovery in 2009. This also shows how the season has changed over time - back in the '80s, retailers hired mostly in December. Now the peak month is November, and many retailers start hiring seasonal workers in October.
From Stephanie Clifford and Catherine Rampell at the NY Times: Dim Outlook for Holiday Jobs
As the economy sputters, prospects are dimming for unemployed workers who were banking on a seasonal retail job to carry them through the holidays. ...Last year - looking at the graph - retailers held back on hiring in October and waited until November (as Challenger Gray expects to happen again this year). The increase to 600,000 is significant, but still below the levels of 1992 through 2007 - except for the recession year of 2001.
The recruiting firm Challenger, Gray & Christmas, forecasts that retailers will add up to 600,000 jobs in October, November and December, compared with a net gain of 501,400 holiday jobs over the same three months in 2009.
...
Challenger Gray expects that companies may wait to hire until November or December — once they have a feel for how much consumers are willing to spend.
This hiring will be watched closely, and I suspect seasonal hiring will be stronger than in 2009, but well below the 700+ thousand jobs in 2004 through 2007.
Note: Clifford and Rampell also note that the supply chain for retailers is long - and many retailers placed orders earlier this year when the outlook seemed brighter to some (not to those paying attention!).
While retailers are just now making plans for Christmas hiring, they had to make plans for Christmas merchandise months ago, and that lag might create some inventory problems.Last year the retailers ran lean on inventory, but if this year is slow, there will be plenty of discounting.
Tuesday, September 14, 2010
Retail Sales increase in August
by Calculated Risk on 9/14/2010 08:30:00 AM
On a monthly basis, retail sales increased 0.4% from July to August (seasonally adjusted, after revisions), and sales were up 3.6% from August 2009. Retail sales increased 0.6% ex-autos. 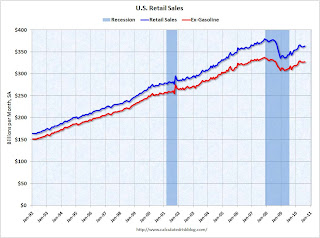 Click on graph for larger image in new window.
This graph shows retail sales since 1992. This is monthly retail sales, seasonally adjusted (total and ex-gasoline).
Retail sales are up 8.4% from the bottom, but still off 4.3% from the pre-recession peak.
Retail sales are still below the April level - and have mostly moved sideways for six months. The second graph shows the year-over-year change in retail sales (ex-gasoline) since 1993.
Retail sales ex-gasoline increased by 3.0% on a YoY basis (3.6% for all retail sales). The year-over-year comparisons were easier earlier this year since retail sales collapsed in late 2008.
Here is the Census Bureau report:
The U.S. Census Bureau announced today that advance estimates of U.S. retail and food services sales for August, adjusted for seasonal variation and holiday and trading-day differences, but not for price changes, were $363.7 billion, an increase of 0.4 percent (±0.5%)* from the previous month, and 3.6 percent (±0.5%) above August 2009. Total sales for the June through August 2010 period were up 4.7 percent (±0.3%) from the same period a year ago. The June to July 2010 percent change was revised from +0.4 percent (±0.5%)* to +0.3 percent (±0.2%).
Monday, September 13, 2010
On Retail Seasonal Hiring
by Calculated Risk on 9/13/2010 01:04:00 PM
October is the first month for seasonal retail hiring - and most hiring happens in November. So it is probably time to start looking ahead.
According to a survey released last week, most retailers plan on hiring about the same number of seasonal workers as last year (a weak year), however about one-fifth expect to hire more.
Here was an article from the WSJ: Holiday Job Outlook Stays Flat
Most major American retailers plan to hire the same number of temporary holiday workers as last year, according to a survey by a top industry consultant, underscoring that store chains continue to view the coming season with caution.
Still, the annual Hay Group survey ... found that more than one-fifth of respondents expected to hire more seasonal help than in 2009 ...
 Click on graph for larger image.
The first graph shows that seasonally adjusted (blue) and not seasonally adjusted (red) retail employment. There is a clear seasonal pattern (no surprise).
Not only is overall retail employment down, but seasonal hiring was very low in 2008, and still weak in 2009.
 The second graph shows the seasonal hiring by the three key months (October, November and December).
 Although seasonal hiring bounced back last year, it was still the second weakest year since 1989 (only 2008 was worse). From this early survey, it sounds like there should be some increase in seasonal hiring - but it will still be a very weak year.
Tuesday, August 31, 2010
Restaurant Index shows contraction in July
by Calculated Risk on 8/31/2010 04:14:00 PM
This is one of several industry specific indexes I track each month.  Click on graph for larger image in new window.
Same store sales and customer traffic both declined in July (on a year-over-year basis). This is the fourth consecutive month of declines.
Unfortunately the data for this index only goes back to 2002.
Note: Any reading above 100 shows expansion for this index.
From the National Restaurant Association (NRA): Restaurant Industry Outlook Remained Uncertain in July as Restaurant Performance Index Remains Essentially Flat
As a result of soft sales and traffic levels and a deteriorating outlook among restaurant operators, the National Restaurant Association’s comprehensive index of restaurant activity remained essentially flat in July. The Association’s Restaurant Performance Index (RPI) – a monthly composite index that tracks the health of and outlook for the U.S. restaurant industry – stood at 99.4 in July, down 0.1 percent from June and its fourth consecutive decline. In addition, the RPI stood below 100 for the third consecutive month, which signifies contraction in the index of key industry indicators.Restaurants are a discretionary expense, and this contraction could be because of the sluggish recovery or might suggest further weakness in consumer spending in the months ahead.
...
Restaurant operators reported negative same-store sales for the fourth consecutive month in July, with the overall results similar to the June performance.
...
Restaurant operators also reported a net decline in customer traffic levels in July.
...
Restaurant operators have become less optimistic about their prospects for sales growth in recent months.
emphasis added
Friday, August 13, 2010
Retail Sales increase 0.4% in July
by Calculated Risk on 8/13/2010 08:30:00 AM
On a monthly basis, retail sales increased 0.4% from June to July (seasonally adjusted, after revisions), and sales were up 5.5% from July 2009. Retail sales increased 0.2% ex-autos.  Click on graph for larger image in new window.
This graph shows retail sales since 1992.
This is monthly retail sales, seasonally adjusted (total and ex-gasoline).
Retail sales are up 8.1% from the bottom, but still off 4.5% from the pre-recession peak. The second graph shows the year-over-year change in retail sales (ex-gasoline) since 1993.
Retail sales ex-gasoline increased by 4.8% on a YoY basis (5.5% for all retail sales). The year-over-year comparisons are easy now since retail sales collapsed in late 2008.
Here is the Census Bureau report:
The U.S. Census Bureau announced today that advance estimates of U.S. retail and food services sales for July, adjusted for seasonal variation and holiday and trading-day differences, but not for price changes, were $362.7 billion, an increase of 0.4 percent (±0.5%)* from the previous month, and 5.5 percent (±0.5%) above July 2009. Total sales for the May through July 2010 period were up 5.9 percent (±0.3%) from the same period a year ago. The May to June 2010 percent change was revised from -0.5 percent (±0.5%)* to -0.3 percent (±0.2%).This was close to expectations.
Wednesday, July 14, 2010
Retail Sales fall 0.5% in June
by Calculated Risk on 7/14/2010 08:30:00 AM
On a monthly basis, retail sales decreased 0.5% from May to June (seasonally adjusted, after revisions), and sales were up 4.8% from June 2009.  Click on graph for larger image in new window.
This graph shows retail sales since 1992.
This is monthly retail sales, seasonally adjusted (total and ex-gasoline).
Retail sales are up 7.3% from the bottom, but still off 5.2% from the pre-recession peak. The second graph shows the year-over-year change in retail sales (ex-gasoline) since 1993.
Retail sales ex-gasoline increased by 4.5% on a YoY basis (4.8% for all retail sales). The year-over-year comparisons are easy now since retail sales collapsed in late 2008.
Here is the Census Bureau report:
The U.S. Census Bureau announced today that advance estimates of U.S. retail and food services sales for June, adjusted for seasonal variation and holiday and trading-day differences, but not for price changes, were $360.2 billion, a decrease of 0.5 percent (±0.5%)* from the previous month, but 4.8 percent (±0.7%) above June 2009. Total sales for the April through June 2010 period were up 6.8 percent (±0.3%) from the same period a year ago. The April to May 2010 percent change was revised from -1.2 percent (±0.5%) to -1.1 percent (±0.2%).Retail sales have declined for two consecutive months. This is another weak report, and the decline in sales was worse than expected.
Friday, June 11, 2010
Retail Sales decline in May
by Calculated Risk on 6/11/2010 08:30:00 AM
On a monthly basis, retail sales decreased 1.2% from April to May (seasonally adjusted, after revisions), and sales were up 6.9% from May 2009 (easy comparison).  Click on graph for larger image in new window.
This graph shows retail sales since 1992. This is monthly retail sales, seasonally adjusted (total and ex-gasoline).
The red line shows retail sales ex-gasoline and shows the increase in final demand ex-gasoline has been sluggish.
Retail sales are up 8% from the bottom, but still off 4.6% from the pre-recession peak. The second graph shows the year-over-year change in retail sales (ex-gasoline) since 1993.
Retail sales ex-gasoline increased by 5.6% on a YoY basis (6.9% for all retail sales). The year-over-year comparisons are easy now since retail sales collapsed in late 2008. Retail sales bottomed in December 2008.
Here is the Census Bureau report:
The U.S. Census Bureau announced today that advance estimates of U.S. retail and food services sales for May, adjusted for seasonal variation and holiday and trading-day differences, but not for price changes, were $362.5 billion, a decrease of 1.2 percent (±0.5%) from the previous month, but 6.9 percent (±0.7%) above May 2009.This is just one month, but this is a weak report.
Friday, May 14, 2010
Retail Sales increase in April
by Calculated Risk on 5/14/2010 08:30:00 AM
On a monthly basis, retail sales increased 0.4% from March to April (seasonally adjusted, after revisions), and sales were up 8.8% from April 2009 (easy comparison).  Click on graph for larger image in new window.
This graph shows retail sales since 1992. This is monthly retail sales, seasonally adjusted (total and ex-gasoline).
The red line shows retail sales ex-gasoline and shows the increase in final demand ex-gasoline has been sluggish.
Retail sales are up 9.2% from the bottom, but still off 3.6% from the pre-recession peak. The second graph shows the year-over-year change in retail sales (ex-gasoline) since 1993.
Retail sales ex-gasoline increased by 6.9% on a YoY basis (8.8% for all retail sales). The year-over-year comparisons are easy now since retail sales collapsed in late 2008. Retail sales bottomed in December 2008.
Here is the Census Bureau report:
The U.S. Census Bureau announced today that advance estimates of U.S. retail and food services sales for April, adjusted for seasonal variation and holiday and trading-day differences, but not for price changes, were $366.4 billion, an increase of 0.4 percent (±0.5%)* from the previous month and 8.8 percent (±0.5%) above April 2009. Total sales for the February through April 2010 period were up 7.3 percent (±0.3%) from the same period a year ago. The February to March 2010 percent change was revised from +1.9 percent (±0.5%) to +2.1 percent (±0.4%).The strongest sector was building material and garden equipment sales - and that might have been positively impacted by the homebuyer tax credit. Still this is a reasonably strong report.
Wednesday, April 14, 2010
Retail Sales increase sharply in March
by Calculated Risk on 4/14/2010 08:44:00 AM
On a monthly basis, retail sales increased 1.6% from February to March (seasonally adjusted, after revisions), and sales were up 7.6% from March 2009 (easy comparison).  Click on graph for larger image in new window.
This graph shows retail sales since 1992. This is monthly retail sales, seasonally adjusted (total and ex-gasoline).
The red line shows retail sales ex-gasoline and shows the increase in final demand ex-gasoline has been sluggish.
Retail sales are up 8.3% from the bottom, but still off 4.4% from the peak. The second graph shows the year-over-year change in retail sales (ex-gasoline) since 1993.
Retail sales ex-gasoline increased by 5.3% on a YoY basis (7.6% for all retail sales). The year-over-year comparisons are easy now since retail sales collapsed in late 2008. Retail sales bottomed in December 2008.
Here is the Census Bureau report:
The U.S. Census Bureau announced today that advance estimates of U.S. retail and food services sales for March, adjusted for seasonal variation and holiday and trading-day differences, but not for price changes, were $363.2 billion, an increase of 1.6 percent (±0.5%) from the previous month and 7.6 percent (±0.5%) above March 2009. Total sales for the January through March 2010 period were up 5.5 percent (±0.3%) from the same period a year ago. The January to February 2010 percent change was revised from +0.3 percent (±0.5%)* to +0.5 percent (±0.3%).This is a strong retail sales report.
Friday, March 12, 2010
Retail Sales increase in February
by Calculated Risk on 3/12/2010 08:30:00 AM
On a monthly basis, retail sales increased 0.3% from January to February (seasonally adjusted, after revisions), and sales were up 4.5% from February 2009 (easy comparison).
UPDATE: January was revised down sharply. Jan was originally reported at $355.8 billion, an increase of 0.5% from December.
February was reported at $355.5 billion - a decline without the revision to January.
January has been revised down to $354.3 or an increase of 0.1% from December. Click on graph for larger image in new window.
This graph shows retail sales since 1992. This is monthly retail sales, seasonally adjusted (total and ex-gasoline).
The red line shows retail sales ex-gasoline and shows the increase in final demand ex-gasoline has been sluggish.
Retail sales are up 6.0% from the bottom, but still off 6.4% from the peak. Retail ex-gasoline are up 3.6% from the bottom and still off 5.4% from the peak. The second graph shows the year-over-year change in retail sales (ex-gasoline) since 1993.
Retail sales ex-gasoline increased by 2.1% on a YoY basis (4.5% for all retail sales). The year-over-year comparisons are easy now since retail sales collapsed in late 2008. Retail sales bottomed in December 2008.
Here is the Census Bureau report:
The U.S. Census Bureau announced today that advance estimates of U.S. retail and food services sales for February, adjusted for seasonal variation and holiday and trading-day differences, but not for price changes, were $355.5 billion, an increase of 0.3 percent (±0.5%)* from the previous month and 3.9 percent (±0.5%) above February 2009.
...
Gasoline stations sales were up 24.0 percent (±1.5%) from February 2009 and nonstore retailers sales were up 11.8 percent (±1.7%) from last year.
Friday, February 12, 2010
Retail Sales increase 0.5% in January
by Calculated Risk on 2/12/2010 08:30:00 AM
On a monthly basis, retail sales increased 0.5% from December to January (seasonally adjusted), and sales were up 4.7% from January 2009 (easy comparison).  Click on graph for larger image in new window.
This graph shows retail sales since 1992. This is monthly retail sales, seasonally adjusted (total and ex-gasoline).
This shows that retail sales fell off a cliff in late 2008, and appear to have bottomed.
The red line shows retail sales ex-gasoline and shows the increase in final demand ex-gasoline has been sluggish. The second graph shows the year-over-year change in retail sales since 1993.
Retail sales increased by 4.7% on a YoY basis. The year-over-year comparisons are easy now since retail sales collapsed in late 2008. Retail sales bottomed in December 2008.
Here is the Census Bureau report:
The U.S. Census Bureau announced today that advance estimates of U.S. retail and food services sales for January, adjusted for seasonal variation and holiday and trading-day differences, but not for price changes, were $355.8 billion, an increase of 0.5 percent (±0.5%)* from the previous month and 4.7 percent (±0.5%) above January 2009.
...
Gasoline stations sales were up 29.0 percent (±1.5%) from January 2009


