 RSS Feed
 by Calculated Risk on 11/02/2010 10:00:00 AM
Showing posts with label housing economics. Show all posts
Showing posts with label housing economics. Show all posts
Tuesday, November 02, 2010
Q3 2010: Homeownership Rate at 1999 Levels
The Census Bureau reported the homeownership and vacancy rates for Q3 2010 this morning.
 Click on graph for larger image in new window.
The homeownership rate was at 66.9%, the same level as in Q2. This is at about the level of early 1999.
Note: graph starts at 60% to better show the change.
The homeownership rate increased in the '90s and early '00s because of changes in demographics and "innovations" in mortgage lending. The increase due to demographics (older population) will probably stick, so I've been expecting the rate to decline to around 66%, and probably not all the way back to 64% to 65%. I'll revisit this soon - and the impact on the homebuilders.
 The homeowner vacancy rate was at 2.5% in Q3 2010. This is the same level as in Q2, and below the of 2.9% in 2008.
A normal rate for recent years appears to be about 1.7%.
This leaves the homeowner vacancy rate about 0.8% above normal. This data is not perfect, but based on the approximately 75 million homeowner occupied homes, we can estimate that there are close to 600 thousand excess vacant homes.
The rental vacancy rate declined to 10.3% in Q3 2010 from 10.6% in Q2.
 This decline fits with the Reis apartment vacancy data and the NMHC apartment survey. This report is nationwide and includes homes for rent.
It's hard to define a "normal" rental vacancy rate based on the historical series, but we can probably expect the rate to trend back towards 8%. According to the Census Bureau there are close to 41 million rental units in the U.S. If the rental vacancy rate declined from 10.3% to 8%, then 2.3% X 41 million units or about 950 thousand excess units would have to be absorbed.
This suggests there are still about 1.55 million excess housing units. These excess units will keep pressure on housing starts, rents and house prices for some time.
NOTE: The graphs in this post link to a new Gallery graphics tool (Thanks Ken!). This CR Gallery is a collection of current graphs from the blog. There are tabs for several categories: Employment, New home Sales, etc.
Click on a tab, and a gallery is loaded. Then thumbnails appear below the main graph for all of the graphs in the selected gallery. Click on the thumbnails to view each graph. The title below each large image is a link to the related blog post on Calculated Risk (or click on the main image to view the blog post).
The "print" key displays the full size image of the selected graph for printing from your browser. Enjoy!
Saturday, September 18, 2010
Lawler: US Households: Why Researchers / Analysts are “Confused”
by Calculated Risk on 9/18/2010 08:00:00 AM
CR Note: This from economist Tom Lawler.
[On Thursday, the Census Department released a report] entitled “Income, Poverty, and Health Insurance Coverage in the United State: 2009,” which was widely covered in the press, included a table showing an “estimate” of the number of US households in the US as of March 2010 --- 117,538,000, up just 357,000 from March 2009. The report also shows historical data on this estimated number of households, which is derived from a special Current Population Survey. The table with that data has tons of footnotes, which note that there have been multiple revisions in this so-called “time series.”
This ‘household estimate,” which is not subject to rigorous population or housing unit “controls,” is one of at least five household series one can “pick up” from various Census sources. And, of course, they are all unbelievably inconsistent, both in terms of levels and changes.
Below are various household (“occupied housing units") estimates from different reports/sources. Note that the Housing Vacancy Survey has quarterly average “estimates,” but I am just showing its annual data. I am also only showing data back to 2000.
| US Households: What's the "Right" Number? (thousands of units) | ||||||
|---|---|---|---|---|---|---|
| AHS (avg) | ACS (avg) | HVS, 2008 vintage (avg) | HVS, unadj (avg) | CPS (Mar) | Decennial Census (April 1) | |
| 2000 | 104,819 | 102,555 | 105,720 | 106,434 | 105,480 | |
| 2001 | 105,435 | 106,429 | 103,772 | 107,010 | 108,239 | |
| 2002 | 107,367 | 104,994 | 104,965 | 109,297 | ||
| 2003 | 105,842 | 108,420 | 105,636 | 105,560 | 111,278 | |
| 2004 | 109,902 | 106,971 | 106,588 | 112,000 | ||
| 2005 | 108,871 | 111,091 | 108,667 | 108,231 | 113,343 | |
| 2006 | 111,617 | 109,736 | 109,575 | 114,384 | ||
| 2007 | 110,692 | 112,378 | 110,173 | 110,306 | 116,011 | |
| 2008 | 113,101 | 110,475 | 111,409 | 116,783 | ||
| 2009 | 111,861 | 111,344 | 111,344 | 117,181 | ||
| 2010 | 117,538 | |||||
| AHS (avg)* | ACS (avg) | HVS, 2008 vintage (avg) | HVS, unadj (avg) | CPS (Mar) | Decennial Census (April 1) | |
| 2001 | 1,610 | 1,217 | 1,290 | 1,805 | ||
| 2002 | 204 | 938 | 1,222 | -2,045 | 1,058 | |
| 2003 | 204 | 1,053 | 642 | 595 | 1,981 | |
| 2004 | 1,515 | 1,483 | 1,335 | 1,028 | 722 | |
| 2005 | 1,515 | 1,189 | 1,696 | 1,643 | 1,343 | |
| 2006 | 911 | 527 | 1,069 | 1,344 | 1,041 | |
| 2007 | 911 | 761 | 437 | 731 | 1,627 | |
| 2008 | 585 | 723 | 302 | 1,103 | 772 | |
| 2009 | 585 | 869 | -65 | 398 | ||
| 357 | ||||||
| *AHS: annual average for 2-year period | ||||||
The “HVS” is the Housing Vacancy Survey, which is the quarterly Census report that includes the homeownership rates and vacancy rates. This report is not actually designed to measure the size of the housing stock (or the number of households), but rather vacancy rates. The “2008 vintage” data are attempts to create a household estimate consistent with historical housing stock estimates from other Census reports. The “unadjusted” HVS data use periodic updates of the housing stock estimates (and updated forecasts), but do not correct for past over- or under-estimates of the housing stock – thus creating multiple discrete shifts in this time series.
I include this one because recently someone sent me a report asking me to comment on a piece by a firm which including showing a decline in the number of households in 2009, citing a Census report. This confused me, but I figured out that the hapless “analyst” had used this “unadjusted” series, which is absolutely useless as a time series. The 2009 and 2010 HVS household (and housing stock) data, are going to be revised downward materially in the upcoming Q3/10 report, reflecting the updated July 1, 2009 housing stock estimates released this June, and then revised in September, which show a MUCH lower housing stock than that assumed by the HVS.
All of these data are available on various Census sources or in vendor economic databases, but the caveats/concerns/issues associated with using them as a time series are often either barely mentioned in footnotes, or not mentioned at all.
Even a casual glance at the [above table] indicates that [these] various measures – some of which cover slightly different time spans, and some (such as the ACS) is a different “concept,” at times show vastly different trends, for reasons that are not at first glance clear. As many housing analysts have noted, how fast the current “excess” supply of housing (which in and of itself is extremely difficult to gauge, given the apparent unreliability of the data!) can be absorbed is heavily dependent both on the level of new construction and the growth in households. Sadly, there not only does not exist a reliable time series of household growth that enables one to look at the behavior during business downturns/recoveries, but there is no reliable time series to gauge how fast/slow RECENT growth has been – though the combined data suggest extremely slow growth over the last few years.
On the housing stock, Census – which released updated housing stock estimates through July 1, 2009 in June (based on a pretty simplistic methodology) -- updated those estimates this month to reflect the fact that the June estimates did not incorporate state/local inputs. [The next table] are the revised housing stock estimates back to July 1, 2000. Census does not have a reliable annual time series for earlier periods.
| Census Housing Stock Estimates, July 1 | |
|---|---|
| Revised 2009 Vintage | |
| 7/1/2000 | 116,300,799 |
| 7/1/2001 | 117,905,005 |
| 7/1/2002 | 119,456,206 |
| 7/1/2003 | 121,076,837 |
| 7/1/2004 | 122,824,501 |
| 7/1/2005 | 124,711,041 |
| 7/1/2006 | 126,500,212 |
| 7/1/2007 | 128,132,164 |
| 7/1/2008 | 129,313,137 |
| 7/1/2009 | 129,969,653 |
| 7/1/2001 | 1,604,206 |
| 7/1/2002 | 1,551,201 |
| 7/1/2003 | 1,620,631 |
| 7/1/2004 | 1,747,664 |
| 7/1/2005 | 1,886,540 |
| 7/1/2006 | 1,789,171 |
| 7/1/2007 | 1,631,952 |
| 7/1/2008 | 1,180,973 |
| 7/1/2009 | 656,516 |
In the “Vintage 2008” HVS data, it was assumed that the housing stock from mid 2008 to mid 2009 increased by about 1,140,000, and that from the spring of 2009 to the spring of 2010 the housing stock increased by a similar amount. In fact, of course, it did not, and as a result there will be sizable downward revisions in the HVS’ estimated household growth in 2009 and so far in 2010.
CR Note: The above was from Tom Lawler. I've tried to figure out when the excess supply will be absorbed, but as Tom points out, it is difficult since there is no reliable time series of household growth.
Thursday, August 21, 2008
Borrowing Trouble: Merrill Lynch on Housing
by Calculated Risk on 8/21/2008 11:25:00 AM
Merrill Lynch released a research note earlier this week: Wall-to-wall homes. This piece was widely quoted, and - as bearish as I am on housing - I believe this analysis is incorrect.
Starting with the 3rd paragraph:
"Single starts dropped to 641k in July, the lowest since January 1991, but even this is well ahead of the pace of sales."Yes and no. It is correct that starts of one unit structures declined to 641K (SAAR) in July according to the Census Bureau. However it is a mistake to compare one unit starts directly with new home sales. The main problem is one unit starts include homes built for or directly by owners. The quarterly data from the Census Bureau mostly resolves this problem, and the quarterly data shows that starts are now running below new home sales - so inventory of new homes is declining (Note: this needs to be adjusted for cancellations too, but even then new home inventory is declining sharply).
More Merrill:
"Given our expectation for sales to decline by 1% in July to 411k units, we expect months’ supply to drop to 9.4 months from 10.4 in June."I think Merrill meant they expect new home inventory to decline to 411K units in July or about 3% (from 426K SA in June). That would put the months of supply in July near Merrill's estimate of 9.4 months - a sharp decline from the recent high of 11.2 months in March 2008.
This takes us to Merrill's first paragraph:
"[H]ome building needs to contract by another 30% ... and stay in that range through at least the end of 2009 in order to get months’ supply down, in our view."This begs the question: down to what? Merrill just argued (correctly in my view) that months of supply will probably decline in July, but in this statement they are arguing that starts need to fall another 30% to get months of supply down. Really?
 Click on graph for larger image in new window.
This graph shows the months of supply metric over the last 45 years. During the boom, the months of supply was around 4, but in more normal markets, the months of supply is usually around 5 to 6.
At the current rate of starts (single family, built for sale) and new home sales, the months of supply will probably decline to the low 8s by the end of 2008. That is about half way to a normal market! Yes, new home sales will probably decline a little further because of tighter lending standards, but starts will probably fall further too (based on permits) - so the bottom line is I expect inventory and months of supply to continue to decline for the rest of 2008.
The biggest problem for home builders is the huge overhang of existing homes for sale, especially distressed properties. This will keep a lid on new home sales for some time - so there won't be much of a rebound in sales, and the housing correction will probably look like an "L" (sharp drop and then flat). But, it is clear that the new home inventory correction is already under way.
And a final excerpt from Merrill:
"Housing completions remained elevated at 1035k in July (791k singles and 244k multi units), which will not help the supply situation ..."This is just confusing. Completions are important for looking at residential construction employment, but they are not as useful for supply. This is because most homes are sold early in the process, before they are started or early in the construction process. Starts are better for analyzing supply - or completions with a six month lag (time to build a home), and once again, you can't compare starts (or completions) directly to sales because many homes are not "built for sale".
I remain bearish on housing in general, and there is no question there are many negatives for the housing market. I expect prices to fall for some time in the bubble markets because prices are still too high relative to incomes and rents, and because of the huge overhang of inventory, especially REOs and other distressed properties. There are also serious problems building in the Alt-A market, see Tanta's Subprime and Alt-A: The End of One Crisis and the Beginning of Another and Reset Vs. Recast, Or Why Charts Don't Match. And there are well publicized problems with Fannie and Freddie, and other lenders are still tightening standards.
But we don't need to borrow trouble. Single family starts (built for sale) have fallen enough that new home inventory and months of supply is now declining.
Tuesday, April 29, 2008
Homeownership and Vacancy Rates
by Calculated Risk on 4/29/2008 06:04:00 PM
Yesterday the Census Bureau reported the homeownership and vacancy rates for Q1 2008. Here are a few graphs and some analysis ... Click on graph for larger image.
The homeownership rate is now back to the levels of the summer of 2001. Note: graph starts at 60% to better show the change.
The declining homeownership rate shows the huge drag on the housing market of the shift - at the margin - of households moving from ownership to renting.
The homeownership vacancy rate increased to a record 2.9% (from 2.8% in Q3).
The second graph shows the homeowner vacancy rate since 1956. A normal rate for recent years appears to be about 1.7%. There is some noise in the series, quarter to quarter, so perhaps the vacancy rate has stabilized in the 2.7% to 2.9% range. Still this leaves the homeowner vacancy rate almost 1.2% above normal, and with approximately 75 million homeowner occupied homes; this gives about 900 thousand excess vacant homes.
The rental vacancy rate increased to 10.1% in Q1 2008, from 9.6% in Q4. The rental vacancy rate had been trending down slightly for almost 3 years (with some noise).
It's hard to define a "normal" rental vacancy rate based on the historical series, but we can probably expect the rate to trend back towards 8%. According to the Census Bureau there are 35.7 million rental units in the U.S. If the rental vacancy rate declined from 10.1% to 8%, there would be 2.1% X 35.7 million units or about 750,000 units absorbed.
This would suggest there are about 750 thousand excess rental units in the U.S. that need to be absorbed. There are also approximately 200 thousand to 250 thousand excess new homes above the normal inventory level (for home builders).
If we add this up, 750 thousand excess rental units, 900 thousand excess vacant homes, and 200 thousand excess new home inventory, this gives 1.85 million excess housing units in the U.S. that need to be absorbed over the next few years. (Note: this data is noisy, so it's hard to compare numbers quarter to quarter, but this is probably a reasonable approximation).
These excess units will keep pressure on housing starts and prices for some time.
Thursday, March 06, 2008
Fed: Household Percent Equity Plummets in Q4
by Calculated Risk on 3/06/2008 12:27:00 PM
The Fed released the Q4 Flow of Funds report today: Flow of Funds.
The Fed report shows that household real estate assets decreased from $20.325 Trillion in Q3 to $20.155 Trillion in Q4. That is a decline of $170.2 billion.
When we subtract out new single family structure investment and residential improvement, the value of existing household real estate assets declined by $282 Billion.
The simple math: Decrease in household assets: $20,154.7 billion minus $20,324.9 billion equals minus $170.2 billion. Now subtract investment in new single family structures ($259.7 Billion Seasonally Adjusted Annual Rate) and improvements ($187.2 Billion SAAR). Note: to make it simple, divide the SAAR by 4.
Finally negative $170.2B minus $259.7/4 minus $187.2B/4 equals a decline in existing assets of $282 Billion.
Household percent equity was at an all time low of 47.8%. Click on graph for larger image.
This graph shows homeowner percent equity since 1952. Even though prices have risen dramatically in recent years, the percent homeowner equity has fallen significantly (because of mortgage equity extraction 'MEW'). With prices now falling - and expected to continue to fall - the percent homeowner equity will probably decline rapidly in the coming quarters.
Note: approximately 31% of household have no mortgage. So the 50+ milllion households with mortgage have far less equity than 47.8%. The second graph shows household real estate assets and mortgage debt as a percent of GDP. Household assets as a percent of GDP is now declining, although mortgage debt as a percent of GDP still increased slightly in Q4.
This is just the beginning. If house prices fall 20%, households will lose $4 trillion in equity. If they fall 30%, households will lose $6 trillion in equity.
Saturday, March 01, 2008
Shiller: How a Bubble Stayed Under the Radar
by Calculated Risk on 3/01/2008 08:45:00 PM
Professor Shiller writes in the NY Times: How a Bubble Stayed Under the Radar
Shiller discusses “information cascades” that can lead rational people to make investment errors (like not realizing there was a bubble in the housing market).
Last year, in response to a speech by Minneapolis Federal Reserve President Gary H. Stern, I wrote:
Stern's subject was economic education. He appears to suggest policy makers overestimated the skills of American consumers, and therefore underestimated the need for more regulation - obviously referring to the housing slump.Shiller provides a possible explanation for the inaction of policy makers.
This assertion seems absurd.
It was the policy makers who didn't recognize rampant speculation in the housing market. While we joked about "liar loans" here on Calculated Risk, the policy makers were congratulating themselves on the "ownership society". I'd argue home buyers who used no money down option ARMs were making a rational choice: they were balancing the odds of a big payday with little financial risk - if the property continued to appreciate - with the stigma of a foreclosure on their record. Obviously many home buyers felt the stigma was worth the risk. I don't see that as a lack of economic education, rather a rational choice given the circumstances.
But I can't think of a good excuse for the inaction of the policy makers.
Sunday, February 10, 2008
Housing as an Engine of Recovery
by Calculated Risk on 2/10/2008 04:00:00 PM
Update: Professor Krugman adds some more and suggests I'm too optimistic: Postmodern recessions
Post-moderation recessions haven’t been deliberately engineered by the Fed, they just happen when credit bubbles or other things get out of hand.Note: Don’t miss Tanta’s post this morning: Let's Talk about Walking Away.
And while they haven’t been as deep as the older type of recession, they’ve proved hard to end (not officially, but in terms of employment), precisely because housing — which is the main thing that responds to monetary policy — has to rise above normal levels rather than recover from an interest-imposed slump.
I've written extensively about using housing as a leading indicator for recessions. Last year, at the Jackson Hole conference, Professor Leamer of the UCLA Anderson Forecast presented a very readable paper on this topic: Housing and the Business Cycle
The following graph shows that housing usually leads the economy into recession.
 Click on graph for larger image.
This graph shows New Home Sales vs. recessions for the last 45 years. New Home sales were falling prior to every recession, with the exception of the business investment led recession of 2001.
Note that the escalation of the Vietnam War in the '60s kept the economy out of recession, even though New Home sales were falling. I've also indicated the probably current recession - possibly starting in December (as shown on graph).
But here is a key point: not only does housing usually lead the economy into recession, but housing is usually an engine for recovery as the economy emerges from recession.
 The second graph is constructed by normalizing new home sales at the end of the last six recessions. Then the median is plotted as a percent from the recession bottom. Note that month zero is the last month of each recession.
This shows that typically housing bottoms a few months before the rest of the economy - and then acts as an engine of growth coming out of the recession.
 The third graph is the data for each of the last 6 recessions. Notice that housing didn't boom coming out of the 2001 recession (an investment led recession), and faltered following the recession ending in July 1980 (green line) because of the double dip recession of 1980 and '81/'82.
For the last 6 recessions, housing bottomed 2 to 9 months before the end of the recession.
Given the current fundamentals of housing – significant oversupply, falling demand – it is very unlikely that housing will act as an engine of growth any time soon. We need to see a significant reduction in supply before there will be any increase in residential investment.
So, for those expecting a 2nd half recovery in the economy, I believe they need to look elsewhere for growth – and they need to argue this time is different, i.e. that the economy will recover before housing this time.
More likely the economy will remain sluggish well into 2009 and the effects of the recession will linger. It is possible that fiscal and monetary stimulus will provide some 2nd half boost to GDP, but if that does take the economy out of an official recession, then I believe a double dip recession (or something that feels like one) is very probable.
Housing is still the key to the economy. And the housing outlook remains grim.
Monday, February 04, 2008
Why Doesn't the IRS Just Use Pay Pal?
by Anonymous on 2/04/2008 09:25:00 AM
All I can say is thank heavens that World Series thing is over so that those of us who couldn't care less about basketball can get back to important things, like deleting spam and serious economic analysis.
You know this whole idea is a scam just by the fact that the government -- which could just scale back what it withholds from our paychecks for a few weeks -- is making such a big show of putting checks in the mail. I wouldn't be surprised if they send Ed McMahon to our doors with those giant checks. Nothing would make me save for retirement more than seeing Ed McMahon in person and realizing that no matter what you do to your body, you might live into your mid-80s.
But the government doesn't want us to bank that money or use it to pay off debts. It believes we will go out and spend the money, and that will make our houses worth a lot again. The idea is this: Say, for instance, I got $600, and I spent it on strippers. Those strippers would then buy clothes at Bebe, and the person who owns Bebe would buy the crappy house I overpaid for and get me out of the financial predicament caused by unscrupulous mortgage lenders and not by my addiction to strip joints.
Friday, January 18, 2008
Norris: Maybe Money Would Help
by Anonymous on 1/18/2008 10:56:00 AM
Sorry to be so behind today, but I've been staring at these paragraphs of Floyd Norris's for a couple of hours. I still don't quite know what to say. But I'm sure you all do:
The ideal home buyer now — in a reverse of what was true for years — is a renter who is not burdened with a house. Such a buyer will need a down payment from somewhere, and he or she will need enough income to meet the monthly payments for the foreseeable future, including any increase in adjustable rates that seems probable.If I'm reading this correctly, the suggestion is that we could use a real economy (one that, say, provides down payments from something other than home sales and income from something other than home sales) to create first-time homebuyers who will buy existing homes from people who want to upgrade into a new home by selling the old home for a profit. Have I been drinking too much cough syrup?
But not owning a home, which may be hard to sell, is a big plus.
A year ago, having a home that had appreciated in value meant that an owner could trade up to a more expensive home. Now it means that the homeowner cannot move until the old home is sold, and that is getting more difficult.
First, the seller has to find a buyer who can get a mortgage. Second, the price has to be high enough to pay off the old mortgage and leave enough cash for the down payment on a new home. Both were taken for granted a year ago. In many markets, neither is a sure thing now.
Wednesday, January 02, 2008
NY Times Article in Pictures
by Calculated Risk on 1/02/2008 02:59:00 PM
This morning I excerpted from Goodman and Bajaj's article in the NY Times: In the Land of Many Ifs. Here is the story in graphs (NY Times excerpts in italics):
"An era of free-flowing credit and speculation has led to a far-flung empire of vacant, unsold homes — 2.1 million, or about 2.6 percent of the nation’s housing stock ..."
 Click on graph for larger image.
The first graph shows the homeowner vacancy rate since 1956. A normal rate for recent years appears to be about 1.7%. The current homeowner vacancy rate is 2.6%.
This leaves the homeowner vacancy rate almost 1% above normal, or about 750 thousand excess homes.
But this only part of the excess housing inventory story. The rental vacancy rate is 9.8% - off the 2004 record of 10.4% - but still significantly above the normal rate. And new home inventory is also near record levels.
Here is a rough estimate of the excess inventory (see this post for details):
| Source | Units |
| Rental Units | 700,000 |
| Vacant Homeowner Units | 750,000 |
| Excess Builder Inventory | 250,000 |
| Total | 1,700,000 |
"... economists suggest ... national home prices [will] fall by at least 15 percent from their peak. So far, prices have dropped a little more than 5 percent, according to the Standard & Poor’s Case-Shiller home price index."
 This graph shows the S&P/Case-Shiller index is 5% off the peak, and the OFHEO index declined slightly last quarter.
To put this potential price declines into perspective, this graph shows 15% and 30% nominal price declines for the S&P/Case-Shiller U.S. National Home Price Index and the OFHEO, Purchase Only, SA index.
A 15% nominal price decline would take prices back to late 2004 for both indices. A 30% price decline for Case-Shiller would take prices back to mid-2003; 30% for OFHEO would take prices back to late 2002.
... default rates on loans to homeowners with relatively good credit ... are rising sharply ... This is a potentially ominous sign ... The spike in foreclosures is happening even before many mortgages have reset to higher rates, suggesting that borrowers are falling behind because their homes are worth less.Here is a graph of the overall MBA mortgage delinquency rate since 1979.

This is the overall delinquency rate, and it is at the highest rate since 1986. As noted, delinquencies are getting worse in every category - including prime fixed rate mortgages - and getting worse at a faster rate in every category.
Through the recent era of multiplying housing prices, Americans have turned increased home values into cash via sales, refinanced mortgages and home equity loans — more than $800 billion a year from 2004 to 2006, according to several analysts. The pace of this flow has slowed sharply in recent months.Here are the Kennedy-Greenspan estimates (NSA - not seasonally adjusted) of home equity extraction through Q3 2007, provided by Jim Kennedy based on the mortgage system presented in "Estimates of Home Mortgage Originations, Repayments, and Debt On One-to-Four-Family Residences," Alan Greenspan and James Kennedy, Federal Reserve Board FEDS working paper no. 2005-41.
 For Q3 2007, Dr. Kennedy has calculated Net Equity Extraction as $133.0 billion, or 5.2% of Disposable Personal Income (DPI).
This graph shows the net equity extraction, or mortgage equity withdrawal (MEW), results, both in billions of dollars quarterly (not annual rate), and as a percent of personal disposable income. As homeowner equity declines sharply in the coming quarters - household real estate equity declined $128 Billion in Q3 - combined with tighter lending standards, equity extraction should decline significantly and impact consumer spending.
And from the NY Times graphic:
"In the last 50 years, most recessions have been preceded by a sharp drop in residential investment. Some economists worry the historical pattern doesn't bode well for the economy in 2008."This graph shows Residential Investment (RI) as a percent of GDP since 1960.
 Residential investment, as a percent of GDP, has fallen to 4.51% in Q3 2007, and is now below the median for the last 50 years of 4.56%.
Although RI has fallen significantly from the cycle peak in 2005 (6.3% of GDP in Q3 2005), RI as a percent of GDP is still well above all the significant troughs of the last 50 year (all below 4% of GDP). Based on these past declines, RI as a percent of GDP could still decline significantly over the next year or so.
Monday, December 31, 2007
Housing Summary
by Calculated Risk on 12/31/2007 08:54:00 PM
 | What is that pig? It's from Tanta's Excel Art. A Mortgage Pig™ exclusive. Raindrops Keep Falling on My Pig Warning: this is a large (2 MB) Excel File. And yes, the Mortgage Pig™ is wearing lipstick. |
Happy New Year to All!
The following are some excerpts (with graphs) from a few housing posts in December. Follow the link for the entire post.
From Homeowners With Negative Equity
The following graph shows the number of homeowners with no or negative equity, using the most recent First American data, with several different price declines.
 Click on graph for larger image.
At the end of 2006, there were approximately 3.5 million U.S. homeowners with no or negative equity. (approximately 7% of the 51 million household with mortgages).
By the end of 2007, the number will have risen to about 5.6 million.
If prices decline an additional 10% in 2008, the number of homeowners with no equity will rise to 10.7 million.
The last two categories are based on a 20%, and 30%, peak to trough declines.
From: Home Builders and Homeownership Rates
From 1995 to 2005, the U.S. homeownership rate climbed from 64% to 69%, or about 0.5% per year.
 The graph shows the homeownership rate since 1965. Note the scale starts at 60% to better show the recent change.
The reasons for the change in homeownership rate will be discussed [see here], but here are two key points: 1) The change in the homeownership rate added about half a million new homeowners per year, as compared to a steady homeownership rate, 2) the rate (red arrow is trend) appears to be heading down.
From: MBA Mortgage Delinquency Graph
Here is a graph of the MBA mortgage delinquency rate since 1979.This is the overall delinquency rate, and it is at the highest rates since 1986. As noted earlier this morning, delinquencies are getting worse in every category - including prime fixed rate mortgages - and getting worse at a faster rate in every category.
NOTE on 12/31/2007: See: Defaults on Insured Mortgages Reach Record
From: Housing Inventory and Rental Units
 Renting is a substitute for owning, and to understand the current excess housing inventory, we also need to consider rental units.
This graph shows the number of occupied (blue) and vacant (red) rental units in the U.S. (all data from the Census Bureau).
From: Downey Financial Non-Performing Assets
 From the Downey Financial 8-K released on Dec 14th.
This would be a nice looking chart, except those are the percent non-performing assets by month.
From: NAHB: Builder Confidence Unchanged at Record Low
 The NAHB reports that builder confidence was unchanged at a record low 19 in December.
NAHB: Builder Confidence Remains Unchanged For Third Consecutive Month
Builder confidence in the market for new single-family homes remained unchanged for a third consecutive month in December as problems in the mortgage market and excess inventory issues continued, according to the latest NAHB/Wells Fargo Housing Market Index (HMI), released today. The HMI held even at 19 this month, its lowest reading since the series began in January 1985.
From: Single Family Starts Fall to Lowest Level Since April 1991
 Here is a long term graph of starts and completions. Completions follow starts by about 6 to 7 months.
Look at what is about to happen to completions: Completions were at a 1,344 million rate in November, but are about to follow starts to below the 1.2 million level. I'd expect completions to fall rapidly over the next few months, impacting residential construction employment.
From: November New Home Sales
According to the Census Bureau report, New Home Sales in November were at a seasonally adjusted annual rate of 647 thousand. Sales for October were revised down to 711 thousand, from 728 thousand. Numbers for August and September were also revised down.
 | Sales of new one-family houses in November 2007 were at a seasonally adjusted annual rate of 647,000 ... This is 9.0 percent below the revised October rate of 711,000 and is 34.4 percent below the November 2006 estimate of 987,000. |
 | The Not Seasonally Adjusted monthly rate was 46,000 New Homes sold. There were 71,000 New Homes sold in November 2006. November '07 sales were the lowest November since 1995 (46,000). |
From: More on New Home Sales
 This graph shows New Home Sales vs. Recession for the last 35 years. New Home sales were falling prior to every recession, with the exception of the business investment led recession of 2001.
 This is what we call Cliff Diving!
And this shows why so many economists are concerned about a possible consumer led recession - possibly starting right now.
From: November Existing Home Sales
 The graph shows the Not Seasonally Adjusted (NSA) sales per month for the last 3 years. Note that on an NSA basis, November sales were slightly below October.
The impact of the credit crunch is obvious as sales in September, October and November declined sharply from earlier in the year.
For existing homes, sales are reported at the close of escrow. So November sales were for contracts signed in September and October.
From: More on November Existing Home Sales
 Click on graph for larger image.
 This graph shows the seasonally adjusted annual rate of reported new and existing home sales since 1994. Since sales peaked in the summer of 2005, both new and existing home sales have fallen sharply.
Ignoring the occasional month to month increases, it is clear that sales of both new and existing homes are in free fall.
 The second graph shows the annual sales and year end inventory since 1982 (sales since 1969), normalized by the number of owner occupied units. This shows the annual variability in the turnover of existing homes, with a median of 6% of owner occupied units selling per year.
Currently 6% of owner occupied units would be about 4.6 million existing home sales per year. This indicates that the turnover of existing homes - November sales were at a 5.0 million Seasonally Adjusted Annual Rate (SAAR) - is still above the historical median.
This suggests sales will fall much further in 2008.
Happy New Year to All! Best Wishes from CR and Tanta.
Saturday, December 29, 2007
Looking back at 2007 Housing Predictions
by Calculated Risk on 12/29/2007 04:54:00 PM
At the end of 2006, I offered some predictions for housing in 2007. Looking back it's hard to believe these predictions were out of the mainstream.
My overall view for the 2007 housing market was "falling prices, falling sales, falling residential construction employment, falling starts, falling MEW, falling percentage of equity, and rising foreclosures".
I expected that "existing home sales will "surprise" to the downside, perhaps in the 5.6 to 5.8 million unit range". It now looks like existing home sales will be close to 5.6 million.
I expected prices to fall "1% to 3% nationwide" as measured by OFHEO. OFHEO reports that the Purchase Only index are up 1.1% for the first three quarters, with prices falling in Q3. It now looks like OFHEO prices will be about flat for the year. Another index, S&P / Case-Shiller, shows prices down 3.7% through the first three quarters of 2007.
I also argued "Foreclosures will be approaching record levels in some states." If anything, I was too optimistic on foreclosures. In California, Notice of Default activity is well above previous record levels.
| Click on graph for larger image. This graph shows the NODs filed in California since 1992. For 2007, the number is estimated at the total for the first 3 quarters (46,670 in Q1, 53,943 in Q2, and 72,571 in Q3) plus an estimate of Q4 at the same rate as Q3. |  |
| The second graph shows the NODs normalized by the approximate number of owner occupied units in California. Normalized, 2007 foreclosure activity is 33% higher than '96 (the previous record year), as opposed to 51% higher in nominal numbers. |  |
And my biggest error was on residential construction employment. I argued:
"We will see record residential construction job losses in 2007.According to the BLS, residential construction employment has only fallen 222K in 2007. I've been showing this graph all year:
... the loss of 400K to 600K residential construction employment jobs over the next 6 months."
 This graph shows starts, completions and residential construction employment. (starts are shifted 6 months into the future). Completions and residential construction employment were highly correlated, and Completions typically lag Starts by about 6 months.
There are many reasons why the BLS reported employment hasn't fallen as far as expected (blue line). Some of the possible explanations include: the BLS has not correctly accounted for illegal immigrants working in the construction industry, the BLS Birth/Death model might have missed the turning point in residential construction employment, many workers have moved to commercial work, and many workers (subcontractors) are underemployed.
There is some merit to to all of these arguments, and I think the answer will be some combination of these explanations. The concern now is that if commercial construction spending slows, as appears likely from the recent Fed loan survey, then workers that have moved to commercial construction will have no work opportunities.
This was the concern expressed by the director of forecasting of the NAHB in August. From Reuters: Construction job losses could top 1 million
"The ability of nonresidential to continue absorbing additional workers is going to be limited, and that's going to put downward pressure on construction employment overall," [Bernard Markstein, director of forecasting at the National Association of Home Builders] said, adding that cuts may be deeper than in the 1990s.Whatever the reason, I was too pessimistic on residential construction employment in 2007.
And finally, for amusement, Jon Lansner at the O.C. Register interviews local economist Mark Schniepp: Economist eyes home sales pickup in ‘08. This is an amazing quote:
A year ago, we didn’t know what a subprime loan was, nor did anyone expect the likelihood of a “credit crunch.”Oh yeah.
Economist Mark Schniepp, Dec 29, 2007
Tanta and I have been writing about subprime loans for as long as this blog has existed. And as far as a credit crunch, back in January I mentioned the possibility of "a credit crunch based on bad loans in the RE sector (and possibly in CRE and C&D too)".
And many others were discussing these issues too.
We all make errors in forecasting - no one has a crystal ball - but I'm endlessly amused by the 'no one could have known' excuse.
Tuesday, December 18, 2007
Video: Krugman Speaks at Google Dec 14th
by Calculated Risk on 12/18/2007 08:11:00 PM
Krugman speaks at Google on Dec 14th. |
Paul Krugman is a professor of economics and international affairs at Princeton University, and the author or editor of 20 books and more than 200 professional journal articles. In recognition of his work, he has received the John Bates Clark Medal from the American Economic Association, an award given every two years to the top economist under the age of 40. The Economist said he is "the most celebrated economist of his generation."
Wednesday, December 12, 2007
We're All Subprime Now, Episode XVIII
by Anonymous on 12/12/2007 09:30:00 AM
The Wall Street Journal is troubled by Fannie Mae's recent imposition of a 25 bps "adverse market fee" for new mortgage production. "Mortgage Pain Hits Prudent Borrowers":
Fannie Mae, the giant government-sponsored mortgage investor, last week raised costs for many borrowers by quietly adding a 0.25% up-front charge on all new mortgages that it buys or guarantees. On a $400,000 mortgage, that would mean an extra $1,000 in fees, almost certain to be passed on to the consumer. Freddie Mac, the other big government-sponsored mortgage investor, is expected to impose a similar fee soon, according to a person familiar with the situation."A tax on homeownership." I swear, if the National Association of Builders didn't exist, I'd have to invent them. For comic relief. Ditto with "a higher interest rate than would normally apply."
...
In a statement, Fannie said the new fee is needed "to ensure that what we charge aligns with the risk we bear." The National Association of Home Builders labeled the fee "a broad tax on homeownership." More than 40% of all mortgages outstanding are owned or guaranteed by Fannie or Freddie.
The fee is the latest in a series of moves by Fannie and Freddie that raise the cost of credit for some borrowers. Late last month, they imposed surcharges that affect mortgage borrowers who have credit scores below 680, on a standard scale of 300 to 850, and who are borrowing more than 70% of a property's value. For example, someone with a credit score of 650 would pay a surcharge of 1.25% of the loan amount for a mortgage to be sold to Fannie. On a $300,000 loan, that would mean extra fees of $3,750. The fee could be paid in cash or in the form of a higher interest rate than
would normally apply.
Fannie also is raising down-payment requirements for loans it purchases or guarantees in places where house prices are falling, which by some measures is most of the country. In these declining markets, lenders will need to cut by five percentage points the maximum percentage of the home's estimated value that can be financed. For instance, for types of loans that Fannie normally would allow to cover up to 100% of the estimated value, the ceiling now is 95% in declining markets.
Here's the deal: if you are taking out a mortgage--any mortgage--in a period of time in which home prices are rapidly falling, the financial future of lenders and builders is uncertain, and bailouts are already on the table, you may wish to call yourself "prudent" because you're getting a conforming fixed and your FICO score is better than those subprime people's. You may, therefore, feel sorry for yourself because you'll pay that extra quarter.
Or, you can wonder if maybe you should wait that extra half-hour after lunch before entering the swimming pool. Whatever. I'd like to hear the case for the GSEs backing off on fees right now.
In the interests of maximum nerdage, I'd also like to point out that the "no maximum financing in a declining market" rule that is mentioned here is not "new." It has always been the rule. Fannie and Freddie are taking the opportunity presented to them by current events to remind everyone that it is still on the books. Some people may think it's new, but some people think a "declining market" is, well, new. Unheard of. Not normal, you might say.
We should note that this rule does not simply change a 100% maximum to a 95% maximum. There are many maximum LTVs, depending on occupancy, purpose, FICO, property type, loan type (fixed versus ARM), and so on. So there are those 90% cash-outs that will be 85% cash-outs, and those 80% multi-unit loans that will be 75%. Cue more howling from the "prudent."
Tuesday, December 11, 2007
Housing Inventory and Rental Units
by Calculated Risk on 12/11/2007 03:47:00 PM
Renting is a substitute for owning, and to understand the current excess housing inventory, we also need to consider rental units. Click on graph for larger image.
This graph shows the number of occupied (blue) and vacant (red) rental units in the U.S. (all data from the Census Bureau).
In an earlier post, Home Builders and Homeownership Rates, I discussed the decade long decline in the total number of rental units - from 1995 to 2004 - and how that related to the rising homeownership rate.
The builders didn't stop building apartment units in 1995, instead the decline in the total units came from rental to owner conversions, and units being demolished (a fairly large number of housing units are demolished every year).
And even though the total number of rental units was declining, this didn't completely offset the number of renters moving to homeownership, so the rental vacancy rate started moving up - from about 8% in 1995 to over 10% in 2004.
The total number of rental units (red and blue) bottomed in Q2 2004, and started climbing again. Since Q2 2004, there have been 2.6 million units added to the rental inventory. This increase in units almost offset the recent strong migration from ownership to renting, so the rental vacancy rate has only declined slightly (from a peak of 10.4% in 2004 to 9.8% in the most recent quarter).
Where did these 2.6 rental units come from?
The Census Bureau's Housing Units Completed, by Intent and Design shows 773K units completed as 'built for rent' since Q2 2004. This means that another 1.8+ million rental units came from conversions from ownership to rental.
These could be older out-of-service units being brought back to the rental market, condo "reconversions", flippers becoming landlords, or homeowners renting their previous homes instead of selling. But this shows the substantial excess inventory in 2004 and 2005 that didn't show up in the new home or existing home inventory numbers at the time.
Back in 2006, I estimated the excess housing inventory at 1.1 million to 1.4 million units. The number is higher now since the home builders have continued to build too many homes. Note: of course price is a factor. With the rental vacancy still above the normal range, there are probably 700 thousand excess rental units in the U.S. (assuming the vacancy rate falls back to 8%).
Here is a rough estimate of the excess inventory:
| Source | Units |
| Rental Units | 700,000(1) |
| Vacant Homeowner Units | 750,000(2) |
| Excess Builder Inventory | 250,000(3) |
| Total | 1,700,000 |
(1) calculated based a decline in the rental vacancy rate from 9.8% to 8%.
(2) based on the homeowner vacancy rate declining from 2.7% to 1.7% on 75 million units.
(3) Based on a return to 5 months of hard inventory (completed or in process). This includes an extra 100,000 units based on rising cancellation rates.
Note: this is another step towards my housing forecast for 2008.
Thursday, December 06, 2007
Fed: Existing Household Real Estate Assets Decline $67 Billion in Q3
by Calculated Risk on 12/06/2007 07:16:00 PM
Here is some more data from the Fed's Flow of Funds report.
The Fed report shows that household real estate assets increased from $20.94 Trillion in Q2 to $20.99 Trillion in Q3. However, when we subtract out new single family structure investment and residential improvement, the value of existing household real estate assets declined by $67 Billion.
The simple math: Increase in household assets: $20,991.18 Billion minus $20,937.62 Billion equals $53.56 Billion. Now subtract investment in new single family structures ($297.2 Billion Seasonally Adjusted Annual Rate) and improvements ($185.8 Billion SAAR). Note: to make it simple, divide the SAAR by 4.
Finally $53.56B minus $297.2B/4 minus $185.8B/4 equals a decline in existing assets of $67.2B. This was a quarterly price decline of about 0.3%, about the same as the OFHEO House Price index decline.
As mentioned earlier, household equity declined by $128 Billion in Q3.
Household debt increased by $182.1 Billion in Q3 (down from $213.6B in Q2, and up slightly from $181.48B in Q1 2007). The mortgage equity withdrawal numbers will probably still be fairly strong in Q3.
Household percent equity was at an all time low of 50.4%.
This graph shows homeowner percent equity since 1954. Even though prices have risen dramatically in recent years, the percent homeowner equity has fallen significantly (because of mortgage equity extraction 'MEW'). With prices now falling - and expected to continue to fall - the percent homeowner equity will probably decline rapidly in the coming quarters.
Also note that this percent equity includes all homeowners. Based on the methodology in this post, aggregate percent equity for households with a mortgage has fallen to 33% from 36% at the end of 2006.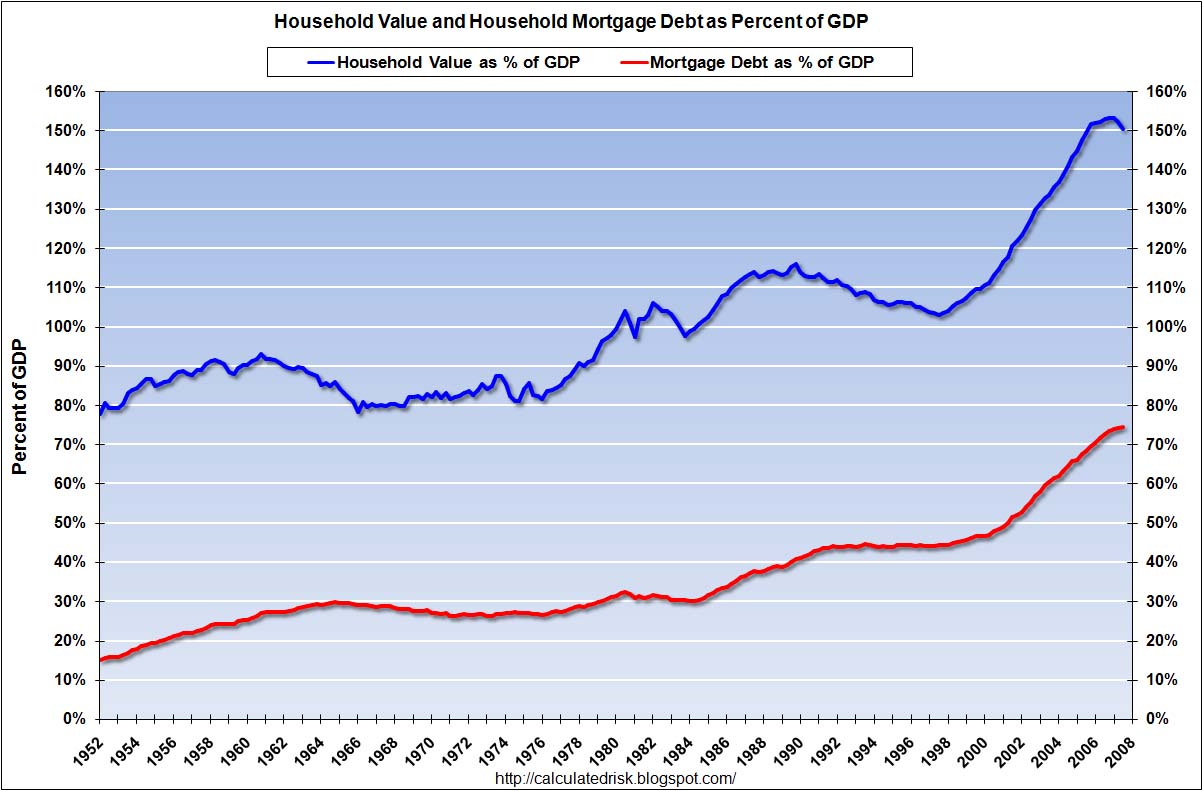
If Goldman Sachs and Moody's are correct and house prices fall 15% nationally (30% in some areas), the value of existing household real estate assets will fall by $3 Trillion over the next few years.
Wednesday, December 05, 2007
Home Builders and Homeownership Rates
by Calculated Risk on 12/05/2007 04:00:00 PM
From 1995 to 2005, the U.S. homeownership rate climbed from 64% to 69%, or about 0.5% per year. Note: A special thanks to Jan Hatzius. Much of the ideas for this post are from his piece: "Housing (Still) Holds the Key to Fed Policy", Nov 27, 2007 Click on graph for larger image.
The first graph shows the homeownership rate since 1965. Note the scale starts at 60% to better show the recent change.
The reasons for the change in homeownership rate will be discussed later in this post, but here are two key points: 1) The change in the homeownership rate added about half a million new homeowners per year, as compared to a steady homeownership rate, 2) the rate (red arrow is trend) appears to be heading down.
The U.S. population has been growing close to 3 million people per year on average, and there are about 2.4 people per household. Assuming no change in these numbers, there would be close to 1.25 million new households formed per year in the U.S. (just estimates).
Since about 2/3s of all households are owner occupied, an increase of 1.25 million households per year would imply an increase in homes owned of about 800K+ per year. If an additional 500K per year moved to homeownership - as indicated by the increase in the homeownership rate from 1995 to 2005 - then the U.S. would have needed 1.3 million additional owner occupied homes per year.
Important note: these number can't be compared directly to the Census Bureau housing starts and new home sales. There are many other factors that must be accounted for to compare the numbers.
During that same period, since about 1/3 of all households rent, the U.S. would have needed about 400K+ new rental units per year, minus the 500K per year of renters moving to homeownership. So the U.S. needed fewer rental units per year from 1995 to 2005. Sure enough, the number of rental units in the U.S. peaked in early 1995 and declined slowly until 2005. The builders didn't stop building apartment units in 1995, instead the decline in the total units came from condo conversions and units being demolished (a fairly large number of rental and owner owned units are demolished every year).
Even though the total number of rental units was declining, this didn't completely offset the number of renters moving to homeownership, so the rental vacancy rate started moving up - from about 8% in 1995 to over 10% in 2004.
What this change in homeownership rate meant for the homebuilders was that they had the wind to their backs. Instead of 800K of new owner demand per year (plus replacement of demolished units, and second home buying), the homebuilders saw an additional 500K of new owner demand during the period 1995 to 2005. This doesn't include the extra demand from speculative buying. Some of this demand was satisfied by condo conversions and owner built units, but the builders definitely benefited from the increase in homeownership rate.
Looking ahead, if the homeownership rate stays steady, the demand for net additional homeowner occupied units would fall back to 800K or so per year (assuming steady population growth and persons per household). However the homeownership rate is declining, and this is now a headwind for the builders.
It appears the rate is declining at about 0.33% per year (Goldman's Hatzius estimated 0.5% per year). This would mean the net demand for owner occupied units would be 833K minus about 333K or 500K per year - about 40% of the net demand for owner occupied units for the period 1995 to 2005.
This means the builders have two problems over the next few years: 1) too much inventory, and 2) demand will be significantly lower over the next few years than the 1995-2005 period, and even when the homeownership rate stabilizes and the inventory is reduced, demand (excluding speculation) will only be about 2/3 of the 1995-2005 period.
Why did the homeownership rate increase?
A recent research paper - Matthew Chambers, Carlos Garriga, and Don E. Schlagenhauf (Sep 2007), "Accounting for Changes in the Homeownership Rate", Federal Reserve Bank of Atlanta - suggests that there were two main factors for the recent increase in homeownership rate: 1) mortgage innovation, and 2) demographic factors (a larger percentage of older people own homes, and America is aging).
The authors found that mortgage innovation accounted for between 56 and 70 percent of the recent increase in homeownership rate, and that demographic factors accounted for 16 to 31 percent. Not all innovation is going away (securitization and some smaller downpayment programs will stay), and the population is still aging, so the homeownership rate will probably only decline to 66% or 67% - not all the way to 64%.
This isn't the first time mortgage innovation contributed to a significant increase in the homeownership rate. The follow graph is from the referenced paper:
After World War II, the homeownership rate increased from 48 percent to roughly 64 percent over twenty years. This period was not only an important change in the trend, but determined a new level for the years to come. The expansion in homeownership during the postwar period has been part of the so-called "American Dream." ...Not all mortgage innovation is bad!
Prior to the Great Depression the typical mortgage contract had a maturity of less than ten years, a loan-to-value ratio of about 50 percent, and mortgage payment comprised of only interest payments during the life of the contract with a "balloon payment" at expiration. The FHA sponsored a new mortgage contract characterized by a longer duration, lower downpayment requirements (i.e., higher loan-to-value ratios), and self- amortizing with a mortgage payment comprised of both interest and principal.
 And finally, the current boom in homeownership rate hasn't be a U.S. only phenomenon. This chart (from the paper) shows the 1995 and 2005 homeownership rate for various countries.
The 5% increase in the U.S. is actually less than many other countries.
Once again, looking forward this means the builders will face two problems over the next few years: too much supply and significantly lower demand (not even counting for speculation).


