 RSS Feed
 by Calculated Risk on 2/17/2011 12:56:00 PM
Showing posts with label delinquency. Show all posts
Showing posts with label delinquency. Show all posts
Thursday, February 17, 2011
MBA: Loans in Foreclosure Tie All-Time Record, fewer Short-term Delinquencies
The MBA reports that 12.85 percent of mortgage loans were either one payment delinquent or in the foreclosure process in Q4 2010 (seasonally adjusted). This is down from 13.52 percent in Q3 2010.
The following graph shows the percent of loans delinquent by days past due.
 Click on graph for larger image in graph gallery.
Loans 30 days delinquent decreased to 3.25% from 3.36% in Q3. This is below the average levels of the last 2 years, but still high.
Delinquent loans in the 60 day bucket decreased to 1.34% from 1.44% in Q3; this is the lowest since Q2 2008.
The biggest decline was in the 90+ day delinquent bucket. This declined from 4.34% in Q3 3.63% in Q4. This is mostly due to modifications or putting the loans in the foreclosure process.
The percent of loans in the foreclosure process increased to 4.63% (tying the record set in Q1 2010). This is due to the foreclosure pause.
Note: the MBA's National Delinquency Survey (NDS) covered "MBA’s National Delinquency Survey covers about 43.6 million first-lien mortgages on one- to four-unit residential properties" and the "The NDS is estimated to cover around 88 percent of the outstanding first-lien mortgages in the market." This gives almost 50 million total first lien mortgages or about 6.4 million delinquent or in foreclosure.
From the MBA: Short-term Delinquencies Fall to Pre-Recession Levels, Loans in Foreclosure Tie All-Time Record
The delinquency rate for mortgage loans on one-to-four-unit residential properties decreased to a seasonally adjusted rate of 8.22 percent of all loans outstanding as of the end of the fourth quarter of 2010, a decrease of 91 basis points from the third quarter of 2010, and a decrease of 125 basis points from one year ago, according to the Mortgage Bankers Association's (MBA) National Delinquency Survey.Note: 8.22% (SA) and 4.63% equals 12.85%.
...
The delinquency rate includes loans that are at least one payment past due but does not include loans in the process of foreclosure. The percentage of loans in the foreclosure process at the end of the fourth quarter was 4.63 percent, up 24 basis points from the third quarter of 2010 and up five basis points from one year ago.
Jay Brinkmann, MBA's chief economist said ... "While delinquency and foreclosure rates are still well above historical norms, we have clearly turned the corner.Yesterday it was announced that an enforcement action (and probable fines) against the mortgage servicers is imminent. As part of any agreement, I expect the servicers will be moving ahead with both more modifications - and also with more foreclosure sales - so the percent of loans in the foreclosure process might have peaked (or will peak in Q1 2011).
...
Mike Fratantoni, MBA's vice president for single family research said "While the foreclosure starts rate fell during the fourth quarter, the percentage of loans in foreclosure rose to equal the all-time high. The foreclosure inventory rate captures loans from the point of the foreclosure referral to exit from the foreclosure process, either through a cure (perhaps through a modification), a short sale or deed in lieu, or through a foreclosure sale. As we predicted last quarter, the percentage of loans in the foreclosure process increased in the fourth quarter, largely due to the foreclosure paperwork issues that were being addressed in September and October. These issues caused a temporary halt in foreclosure sales, particularly in states with judicial foreclosure regimes, such as New Jersey, Florida, and Illinois. With fewer loans exiting the foreclosure process through sales, the foreclosure inventory rate naturally increased, even as fewer foreclosure starts meant that fewer loans entered the foreclosure process in the fourth quarter."
Tuesday, February 01, 2011
Fannie Mae and Freddie Mac Delinquency Rates decline slightly
by Calculated Risk on 2/01/2011 08:45:00 PM
Earlier:
• A little color on the economic data and my current economic outlook.
• U.S. Light Vehicle Sales 12.62 million SAAR in January
Fannie Mae reported that the serious delinquency rate decreased to 4.50% in November from 4.52% in October. Freddie Mac reported that the serious delinquency rate decreased to 3.84% in December from 3.85% in November. (Note: Fannie reports a month behind Freddie).
These are loans that are "three monthly payments or more past due or in foreclosure".
 Click on graph for larger image in graph gallery.
Some of the rapid increase over the last couple of years was probably because of foreclosure moratoriums, and also because loans in trial mods were considered delinquent until the modifications were made permanent. As modifications have become permanent, they are no longer counted as delinquent.
The increases for Freddie Mac in October and November were probably related to the new foreclosure moratoriums. Now it appears the rate has started to decrease again.
Monday, December 27, 2010
Freddie Mac: 90+ Day Delinquency Rate increases in November
by Calculated Risk on 12/27/2010 06:11:00 PM
Freddie Mac reported that the serious delinquency rate increased to 3.85% in November from 3.82% in October. The following graph shows the Freddie Mac serious delinquency rate (loans that are "three monthly payments or more past due or in foreclosure"):

Some of the rapid increase last year was probably because of foreclosure moratoriums, and from modification programs because loans in trial mods were considered delinquent until the modifications were made permanent. As modifications have become permanent, they are no longer counted as delinquent.
The increases in October and November are probably related to the new foreclosure moratoriums. The rate will probably start to decrease again in 2011.
Note: Fannie Mae reported the serious delinquency rate declined slightly in October (they are a month behind Freddie Mac).
Thursday, November 18, 2010
MBA National Delinquency Survey: Delinquency rate declines in Q3
by Calculated Risk on 11/18/2010 11:29:00 AM
The MBA reports that 13.52 percent of mortgage loans were either one payment delinquent or in the foreclosure process in Q3 2010 (seasonally adjusted). This is down from 14.42 percent in Q2 2010.
Note: the MBA's National Delinquency Survey (NDS) covered "about 44 million first-lien mortgages on one- to four-unit residential properties" and the "NDS is estimated to cover approximately 88 percent of the outstanding first lien mortgages in the market." This gives about 50 million total first lien mortgages or about 6.75 million delinquent or in foreclosure.
From the MBA: Delinquencies and Loans in Foreclosure Decrease, but Foreclosure Starts Rise in Latest MBA National Delinquency Survey
The delinquency rate for mortgage loans on one-to-four-unit residential properties decreased to a seasonally adjusted rate of 9.13 percent of all loans outstanding as of the end of the third quarter of 2010, a decrease of 72 basis points from the second quarter of 2010, and a decrease of 51 basis points from one year ago, according to the Mortgage Bankers Association’s (MBA) National Delinquency Survey.Note: 9.13% (SA) and 4.39% equals 13.52%.
...
The percentage of loans in the foreclosure process at the end of the third quarter was 4.39 percent, down 18 basis points from the second quarter of 2010 and down eight basis points from one year ago.
Most of the decline in the overall delinquency rate was in the seriously delinquent categories (90+ days or in foreclosure process). Part of the reason is lenders were being more aggressive in foreclosing in Q3 (before the foreclosure pause), and there was a surge in REO inventory (real estate owned). Some of the decline was probably related to modifications too.
The following graph shows the percent of loans delinquent by days past due.
 Click on graph for larger image in new window.
Loans 30 days delinquent decreased to 3.36%. This is slightly below the average levels of the last 2 years, but still high.
Delinquent loans in the 60 day bucket decreased to 1.44% - the lowest since Q2 2008.
With the foreclosure pause, the 90+ day and in foreclosure rates will probably increase in Q4. The 30 day and 60 day buckets are dependent on jobs and house prices.
More from the press release:
“Mortgage delinquency rates declined over the quarter and over the past year, due primarily to a large decline in the 90+ day delinquency rate. The number of loans in foreclosure also dropped, bringing the serious delinquency rate to its lowest level since the second quarter of 2009. However, the foreclosure starts rate increased for all loan types and the foreclosure starts rate for prime fixed loans set a new record high in the survey, as more loans entered the foreclosure process,” said Michael Fratantoni, MBA’s Vice President of Research and Economics.The MBA also noted that a majority of delinquent loans (and loans in foreclosure) are prime loans. We are all subprime now!
“Most often, homeowners fall behind on their mortgages because their income has dropped due to unemployment or other causes. Although the employment report for October was relatively positive, the job market had improved only marginally through the third quarter, so while there was a small improvement in the delinquency rate, the level of that rate remains quite high. As we anticipate that the unemployment rate will be little changed over the next year, we also expect only modest improvements in the delinquency rate.”
...
“The foreclosure paperwork issues announced by several large servicers in late September and early October are unlikely to have had a large impact on the third quarter numbers, but may well increase the foreclosure inventory numbers in the fourth quarter of 2010 and in early 2011. ... The servicers that halted foreclosure sales temporarily may show higher foreclosure inventory numbers in the fourth quarter of 2010 and in early next year than would otherwise have been the case. ... However, these foreclosed homes are likely to come on the market in the medium term, so it is only a delay rather than a change in the underlying economics.”
Thursday, August 26, 2010
MBA Q2 2010: 14.42% of Mortgage Loans Delinquent or in Foreclosure
by Calculated Risk on 8/26/2010 01:30:00 PM
The MBA reports that 14.42 percent of mortgage loans were either one payment delinquent or in the foreclosure process in Q2 2010 (seasonally adjusted). This is down slightly from the record 14.69 percent in Q1 2010.
From the MBA: Delinquencies and Foreclosure Starts Decrease in Latest MBA National Delinquency Survey
The delinquency rate for mortgage loans on one-to-four-unit residential properties dropped to a seasonally adjusted rate of 9.85 percent of all loans outstanding as of the end of the second quarter of 2010, a decrease of 21 basis points from the first quarter of 2010, and an increase of 61 basis points from one year ago, according to the Mortgage Bankers Association’s (MBA) National Delinquency Survey.Note: 9.85% (SA) and 4.57% equals 14.42%.
...
The percentage of loans in the foreclosure process at the end of the second quarter was 4.57 percent, a decrease of six basis points from the first quarter of 2010, but an increase of 27 basis points from one year ago.
Much was made at the end of 2009 about the decline in the 30 day delinquency "bucket" (percent of loans between 30 and 60 days delinquent). Unfortunately the seasonally adjusted 30 day delinquency rate increased again in Q2 2010.
And much was made on the conference call this morning about the declines in the other "buckets", however the total percent of loans delinquent or in the foreclosure process declined only slightly in Q2 from Q1 - and is the second highest on record.
Note: there are some questions about the seasonal adjustment, especially for the 90 day bucket since we've never seen numbers this high before, but the adjustment for the 30 and 60 day periods are probably reasonable.
 Click on graph for larger image in new window.
Loans 30 days delinquent increased to 3.51%, and this is about the same levels as in Q4 2008 (slightly below the peak of 3.77% in Q1 2009).
Delinquent loans decreased in all other buckets - especially in the 90+ day bucket. MBA Chief Economist Jay Brinkmann suggested the decline in the 90+ day bucket was because of some successful modifications - since the lenders reported the loans as delinquent until the modification was made permanent.
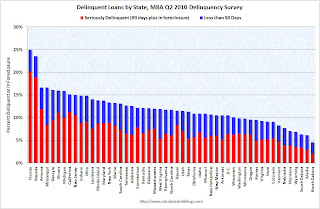 The second graph shows the delinquency rate by state (red is seriously delinquent: 90+ days or in foreclosure, blue is delinquent less than 90 days).
 Clearly Florida and Nevada have a large percentage of loans delinquent or in foreclosure. But the delinquency problem is widespread with 36 states and D.C. all having total delinquency rates above 10%.
When asked if he expected the slight improvements to continue, Brinkmann said "Improvements are more of a hope". He said the problem is jobs, and he is revising down his economic forecasts. He also the improvement in the 90+ day bucket might be because of modifications - and that might not continue.
With house prices falling - and growth slowing - the delinquency rate will probably increase later this year.
Tuesday, July 06, 2010
LPS: Mortgage Delinquencies and Foreclosures increase to 12.38% in May
by Calculated Risk on 7/06/2010 03:19:00 PM
From Lender Processing Services: LPS' May Mortgage Monitor Report: Increase in Rate of New Delinquencies; Decline in Number of Delinquent Loans Becoming Current
The May Mortgage Monitor report released today by Lender Processing Services, Inc. ... shows a 2.3 percent month-over-month increase in the nation's home loan delinquency rate to 9.2 percent in May 2010, and that early-stage delinquencies are increasing as normal seasonal improvements taper off. This report includes data as of May 31, 2010.LPS shows 9.2% delinquent and another 3.18% in foreclosure for a total of 12.38%. I'm not sure about the days to foreclosure numbers (other sources show fewer), but they have steadily increased. For delinquency rates I usually use the quarterly report from the MBA.
According to the Mortgage Monitor report, the percentage of mortgage loans in default beyond 90 days increased slightly, while both delinquency and foreclosure rates continue to remain relatively stable at historically high levels. There are currently more than 7.3 million loans currently in some stage of delinquency or REO.
The report also shows that the average number of days for a loan to move from 30-days delinquent to foreclosure sale continues to increase, and is now at an all-time high of 449 days, resulting in an increase in "shadow" foreclosure inventory.
Here is the LPS monthly report. The increase in early stage delinquencies might be seasonal, but it is definitely bad news. And what happens when house prices start falling again later this year as I expect?
For more, from Diana Golobay at HousingWire: National Mortgage Delinquency Rate Swells to 9.2% in May: LPS
And from Diana Olick at CNBC: New Loan Delinquencies on the Rise Again
Sunday, June 27, 2010
Housing Supply Metrics
by Calculated Risk on 6/27/2010 08:13:00 PM
Here is a table of various housing supply measures (just putting this in one place with links to the source data).
Note: here is the Weekly Summary and a Look Ahead. It will be a busy week!
| Total delinquent loans1 | 7.3 million |
| Seriously delinquent loans1,2 | 5.0 million |
| Total REO Inventory3 | 0.5 million |
| Fannie, Freddie, FHA REO4 | 210 thousand |
| Homeowners with Negative Equity5 | 11.2 million |
| Homeowner vacancy rate6 | 2.6% |
| Rental vacancy rate6 | 10.6% |
| Excess Vacant Units6,7 | 1.7 million |
| Existing Home Inventory8 | 3.89 million |
| Existing Home Months of Supply8 | 8.3 months |
| New Home Inventory9 | 213 thousand |
| New Home Months of Supply9 | 8.5 months |
1 Source: estimate based on the Mortgage Bankers Association’s (MBA) Q1 2010 National Delinquency Survey. "MBA’s National Delinquency Survey covers about 44.4 million first lien mortgages on one-to four-unit residential properties ... The NDS is estimated to cover around 85 percent of the outstanding first-lien mortgages in the country."
2 This is based on the MBA's estimate of loans 90+ days delinquent or in the foreclosure process.
3 Source: Radarlogic and Barclays as of Feb 2010.
4 Source: Fannie Mae, Freddie Mac and FHA. Fannie, Freddie, FHA REO Inventory Surges 22% in Q1 2010
5 Source: CoreLogic Q1 2010 Negative Equity Report
6 Source: Census Bureau Residential Vacancies and Homeownership in the First Quarter 2010
7 CR calculation.
8 Source: National Association of Realtors
9 Source: Census Bureau New Residential sales
Tuesday, June 01, 2010
Fannie Mae: Serious Delinquencies decline in March
by Calculated Risk on 6/01/2010 08:17:00 PM
Breaking a trend ... Click on graph for larger image in new window.
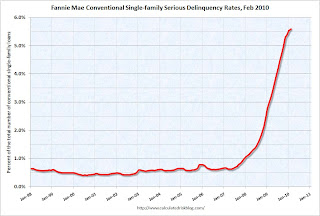
Fannie Mae reported today that the rate of serious delinquencies - at least 90 days behind - for conventional loans in its single-family guarantee business decreased to 5.47% in March, down from 5.59% in February - and up from 3.13% in March 2009.
"Includes seriously delinquent conventional single-family loans as a percent of the total number of conventional single-family loans."
This is the first decline since early 2006 and could be because Fannie (and Freddie and the FHA) are moving ahead with foreclosures.
As noted last month, the combined REO (Real Estate Owned) inventory for Fannie, Freddie and the FHA increased by 22% in Q1 2010 from Q4 2009. The REO inventory (foreclosed homes) increased 59% compared to Q1 2009 (year-over-year comparison). This graph shows the REO inventory for Fannie, Freddie and FHA through Q1 2010.
Even with all the delays in foreclosure, the REO inventory has increased sharply over the last three quarters, from 135,868 at the end of Q2 2009, to 153,007 in Q3 2009, 172,357 at the end of Q4 2009 and now 209,500 at the end of Q4 2010.
These are new records for all three agencies.
Wednesday, May 19, 2010
Mortgage Delinquencies by Period and by State
by Calculated Risk on 5/19/2010 04:01:00 PM
Much was made last quarter about the decline in the 30 day delinquency "bucket" (percent of loans between 30 and 60 days delinquent). Unfortunately the seasonally adjusted 30 day delinquency rate increased in Q1 2010.
Note: there are some questions about the seasonal adjustment, especially for the 90 day bucket since we've never seen numbers this high before, but the adjustment for the 30 and 60 day periods are probably reasonable. Click on graph for larger image in new window.
Loans 30 days delinquent increased to 3.45%, about the same level as in Q4 2008.
Delinquent loans in the 60 day bucket increased too, and are also close to the Q4 2008 level. This suggests that the pipeline is still filling up at a high rate, but slightly below the rates of early 2009.
The 90+ day and 'in foreclosure' rates are at record levels. Obviously the lenders have been slow to start foreclosure proceedings - and the 90+ day delinquent bucket is very full. Also lenders have been slow to actually foreclose - and the 'in foreclosure' bucket is at record levels.
These seriously delinquent loans are the 4.3 million loans MBA Chief Economist Jay Brinkmann referred to as the "shadow inventory" on the conference call this morning. Not all are really "shadow inventory" since some of these loans will be modified, some will be cured (probably very few), and some are probably already listed as short sales. But it does suggest a significant number of distressed sales coming.  The second graph shows the delinquency rate by state (red is seriously delinquent: 90+ days or in foreclosure, blue is delinquent less than 90 days).
This highlights a couple more points that Brinkmann made this morning: 1) the largest category of delinquent loans are fixed rate prime loans, and 2) this is not just a "sand state" problem. Brinkmann argued the foreclosure crisis is now being driven by economic problems as opposed to the bursting of the housing price bubble - and this is showing up in prime loans and all states. Although Florida and Nevada are very high, notice that the blue bar (new delinquencies) are higher in many other states.
Thirty four states and the District of Columbia have total delinquency rates over 10%. This is a widespread problem.
MBA Q1 National Delinquency Survey Conference Call
by Calculated Risk on 5/19/2010 11:06:00 AM
On the MBA conference call concerning the "Q1 2010 National Delinquency Survey", MBA Chief Economist Jay Brinkmann said this morning:
 Click on graph for larger image in new window.
This graph shows the delinquency and foreclosure rates for all prime loans.
This is a new record rate of prime loans in delinquency and foreclosure.
Prime loans account for over 75% of all loans.
"We're all subprime now!"
NOTE: Tanta first wrote this saying in 2007 in response to the 'contained to subprime' statements.
I'll have more later today ...
MBA Q1 2010: Record 14.69% of Mortgage Loans Delinquent or in Foreclosure
by Calculated Risk on 5/19/2010 10:00:00 AM
The MBA reports a record 14.69 percent of mortgage loans were either one payment delinquent or in the foreclosure process in Q1 2010 (seasonally adjusted).
From the MBA: Delinquencies, Foreclosure Starts Fall in Latest MBA National Delinquency Survey
The delinquency rate for mortgage loans on one-to-four-unitAlthough this is a new record, Jay Brinkmann, MBA’s chief economist added a caution on the seasonal adjustment (see press release).
residential properties increased to a seasonally adjusted rate of 10.06 percent of all loans outstanding as of the end of the first quarter of 2010, an increase of 59 basis points from the fourth quarter of 2009, and up 94 basis points from one year ago, according to the Mortgage Bankers Association’s (MBA) National Delinquency Survey. The non-seasonally adjusted delinquency rate decreased 106 basis points from 10.44 percent in the fourth quarter of 2009 to 9.38 percent this quarter.
The percentage of loans on which foreclosure actions were started during the first quarter was 1.23 percent, up three basis points from last quarter but down 14 basis points from one year ago.
The delinquency rate includes loans that are at least one payment past due but does not include loans in the process of foreclosure. The percentage of loans in the foreclosure process at the end of the first quarter was 4.63 percent, an increase of five basis points from the fourth quarter of 2009 and 78 basis points from one year ago. This represents another record high.
The combined percentage of loans in foreclosure or at least one payment past due was 14.01 percent on a non-seasonally adjusted basis, a decline from 15.02 percent last quarter.
The serious delinquency rate, the percentage of loans that are 90 days or more past due or in the process of foreclosure, was 9.54 percent, a decrease of 13 basis points from last quarter, but an increase of 230 basis points from the first quarter of last year.
I'll have notes from the conference call and graphs soon.
Monday, May 10, 2010
Fannie Mae: $11.5 billion loss, sees no profits for "indefinite future"
by Calculated Risk on 5/10/2010 08:58:00 AM
For a EU / ECB summary, please see previous post: Euro Summary
From Fannie Mae:
Fannie Mae (FNM/NYSE) reported a net loss of $11.5 billion in the first quarter of 2010, compared with a net loss of $15.2 billion in the fourth quarter of 2009. Including $1.5 billion of dividends on our senior preferred stock held by the U.S. Department of Treasury, the net loss attributable to common stockholders was $13.1 billion ...Foreclosure activity is increasing:
We acquired 61,929 single-family real estate-owned properties through foreclosure in the first quarter of 2010, compared with 47,189 in the fourth quarter of 2009. As of March 31, 2010, our inventory of single-family real estate owned properties was 109,989, compared with 86,155 as of December 31, 2009.Greg Morcroft at MarketWatch reports:
Fannie sees no profits for the "indefinite future" ... financial sustainability uncertain.Here is the monthly Fannie Mae seriously delinquent graph through February ...
 Click on graph for larger image in new window.
Fannie Mae reported that the rate of serious delinquencies - at least 90 days behind - for conventional loans in its single-family guarantee business increased to 5.59% in February, up from 5.52% in January - and up from 2.96% in February 2009.
"Includes seriously delinquent conventional single-family loans as a percent of the total number of conventional single-family loans."
It does appear the increases in the delinquency rate have slowed.
Wednesday, March 31, 2010
Fannie Mae: Delinquencies Increase in January
by Calculated Risk on 3/31/2010 02:54:00 PM
Here is the monthly Fannie Mae hockey stick graph for January ... Click on graph for larger image in new window.
Fannie Mae reported today that the rate of serious delinquencies - at least 90 days behind - for conventional loans in its single-family guarantee business increased to 5.52% in January, up from 5.38% in December - and up from 2.77% in January 2009.
"Includes seriously delinquent conventional single-family loans as a percent of the total number of conventional single-family loans."
Wednesday, March 03, 2010
States: Delinquent Mortgages vs. Unemployment Rate
by Calculated Risk on 3/03/2010 04:50:00 PM
The BLS released the annual average state unemployment rates today.
Here is a scatter graph comparing the delinquency rate for mortgage loans (including all loans in foreclosure) vs. unemployment rate for all states as of Q4 2009. Click on graph for larger image in new window.
There definitely is a relationship between delinquency rates and the unemployment rate, although some states stand out (like Florida), because of state specific foreclosure laws. Arizona and Nevada also have higher than expected foreclosure rates - possibly because of high investor activity during the housing bubble.
This does suggest that a large part of the delinquency problem is related to the unemployment problem.
Imagine if there were no unemployment benefits. As Mark Thoma noted yesterday, Unemployment Compensation has Broad Based Benefits, but one benefit he didn't mention is that it keeps households in place. Even though there is a relationship between the unemployment rate and the delinquency rate, I suspect the trend line would be steeper without unemployment benefits (so there would be even more delinquencies as the unemployment rate rises without benefits).
Here is a sortable table to find the data for each state (use scroll bar to see all data).
Friday, February 26, 2010
Freddie Mac: Delinquencies Increase Sharply in January
by Calculated Risk on 2/26/2010 02:24:00 PM
Here is the monthly Freddie Mac hockey stick graph ... Click on graph for larger image in new window.
Freddie Mac reported that the rate of serious delinquencies - at least 90 days behind - for conventional loans in its single-family guarantee business increased to 4.03% in January 2010, up from 3.87% in December - and up from 1.98% in January 2009.
"Single-family delinquencies are based on the number of mortgages 90 days or more delinquent or in foreclosure as of period end ..."
Just more evidence of the growing delinquency problem, although some of these loans may be in the trial modification programs and are still included as delinquent until they are converted to a "permanent mod". If the trial is cancelled, the loan stays delinquent (until foreclosure).
The data from Fannie Mae will be released later ...
Friday, February 19, 2010
Mortgage Delinquencies by Period
by Calculated Risk on 2/19/2010 12:11:00 PM
Much was made this morning about the decline in the 30 day delinquency "bucket" (percent of loans between 30 and 60 days delinquent). Hopefully this graph will put the problem in perspective ... Click on graph for larger image in new window.
Loans 30 days delinquent are still elevated, and still above the levels in 2007 - and at about the level of early 2008 - when prices were falling sharply.
The 60 day bucket also declined in Q4, but it is still above the levels of 2008.
As MBA Chief Economist Jay Brinkmann noted, the 90 day and 'in foreclosure' rates are at record levels. Obviously the lenders have been slow to start foreclosure proceedings - and the 90+ day delinquent bucket is now very full. And lenders have been slow to actually foreclose - and the 'in foreclosure' bucket is at record levels.
What impacts prices are distress sales; homes coming out of the 'in foreclosure' bucket without being cured. Since the lenders slowed foreclosures to a trickle, prices have stabilized or even increased slightly in some areas.
But these record levels of long term delinquencies are why Brinkmann cautioned about house prices. This morning he pointed out on the conference call that there are a record 4.5 million homes seriously delinquent or in foreclosure. The loans on some of these homes will be cured - perhaps by HAMP modifications of by other lender modification programs - but many of these homes will go to foreclosure or be sold as short sales putting pressure on house prices.
MBA Q4 National Delinquency Survey Conference Call
by Calculated Risk on 2/19/2010 11:17:00 AM
On the MBA conference call concerning the "Q4 2009 National Delinquency Survey", MBA Chief Economist Jay Brinkmann said this morning:
A few graphs ...
 Click on graph for larger image in new window.
The first graph shows the delinquency and foreclosure rates for all prime loans.
This is a record rate of prime loans in delinquency and foreclosure (tied with Q3 2009).
Prime loans account for over 75% of all loans.
"We're all subprime now!"
NOTE: Tanta first wrote this saying in 2007 in response to the 'contained to subprime' statements.
 The second graph shows just fixed rate prime loans (about 66% of all loans).
This is a new record for prime fixed rate loans.
Note that even in the best of times (with rapidly rising home prices in 2005), just over 2% of prime FRMs were delinquent or in foreclosure. However the cure rate was much higher back then since a delinquent homeowner could just sell their home.
 The third graph shows the delinquency and in foreclosure process rates for subprime loans.
 Although the total has declined, about 40% of subprime loans are still delinquent or in foreclosure.
Much was made about the decline in 30 day delinquencies, and this is potentially "good" news. But 1) the level is still very high (3.31%), and 2) a decline happened in Q4 2007 too - and then the rate started rising again, and 3) this is probably related to the slight increase in house prices in many areas.
MBA: 14.05 Percent of Mortgage Loans in Foreclosure or Delinquent in Q4
by Calculated Risk on 2/19/2010 10:00:00 AM
The MBA reports 14.05 percent of mortgage loans were either one payment delinquent or in the foreclosure process in Q4 2009. This is a slight decrease from 14.11% (edit) in Q3 2009, and an increase from 13.5% in Q2 2009 (note: older data was revised).
From the MBA: Delinquencies, Foreclosure Starts Fall in Latest MBA National Delinquency Survey
The delinquency rate for mortgage loans on one-to-four unit residential properties fell to a seasonally adjusted rate of 9.47 percent of all loans outstanding as of the end of the fourth quarter of 2009, down 17 basis points from the third quarter of 2009, and up 159 basis points from one year ago, according to the Mortgage Bankers Association’s (MBA) National Delinquency Survey. The non-seasonally adjusted delinquency rate increased 50 basis points from 9.94 percent in the third quarter of 2009 to 10.44 percent this quarter.I'll have notes from the conference call and graphs soon.
The delinquency rate includes loans that are at least one payment past due but does not include loans in the process of foreclosure. The percentage of loans in the foreclosure process at the end of the fourth quarter was 4.58 percent, an increase of 11 basis points from the third quarter of 2009 and 128 basis points from one year ago. The combined percentage of loans in foreclosure or at least one payment past due was 15.02 percent on a non-seasonally adjusted basis, the highest ever recorded in the MBA delinquency survey.
The percentage of loans on which foreclosure actions were started during the third quarter was 1.20 percent, down 22 basis points from last quarter and up 12 basis points from one year ago. The percentages of loans 90 days or more past due and loans in foreclosure set new record highs. The percentage of loans 30 days past due is still below the record set in the second quarter of 1985.
“We are likely seeing the beginning of the end of the unprecedented wave of mortgage delinquencies and foreclosures that started with the subprime defaults in early 2007, continued with the meltdown of the California and Florida housing markets due to overbuilding and the weak loan underwriting that supported that overbuilding, and culminated with a recession that saw 8.5 million people lose their jobs,” said Jay Brinkmann, MBA’s chief economist.
Tuesday, February 16, 2010
TransUnion: Mortgage Delinquencies at All Time High
by Calculated Risk on 2/16/2010 07:32:00 PM
From TransUnion: TransUnion Finds National Mortgage Delinquencies Jumped 10.24 Percent at End of 2009 (ht jb)
TransUnion's quarterly analysis of trends in the mortgage industry found that mortgage loan delinquency (the ratio of borrowers 60 or more days past due) increased for the 12th straight quarter, hitting an all-time national average high of 6.89 percent for the fourth quarter of 2009. This quarter marks the first time the mortgage delinquency rate increase did not decelerate after doing so for three consecutive periods.The MBA reports on Q4 delinquency and foreclosure rates on Friday.
This statistic, which is traditionally seen as a precursor to foreclosure, increased 10.24 percent from the previous quarter's 6.25 percent average. Year-over-year, mortgage borrower delinquency is up approximately 50 percent (from 4.58 percent).
...
"At the national level, these results are in part due to seasonality effects. Consumers tend to run low on cash at the end of the year, after spending for the holidays, but before receiving year-end bonuses and tax refunds," said FJ Guarrera, vice president of TransUnion's financial services business unit. ... "The continuing rise in foreclosures, in conjunction with low consumer confidence in the housing market, continues to hinder housing value appreciation and impede recovery in the mortgage industry. Furthermore, there is wave of adjustable rate mortgages (ARMs) that have yet to reset. Many of these are Option and Alt-A loans. When the interest rates on these loans reset many consumers potentially will not be able to meet their debt obligations."
....
TransUnion's forecasts for 2010 are slightly more pessimistic than before due to questions concerning house price appreciation, the continued high level of unemployment, and the potential eroding of consumer confidence as the effects of the government stimulus begin to fade.
"We believe that the 60-day mortgage delinquency rate will peak between 7.5 and 8 percent over the course of 2010, depending on the prevailing economic conditions associated with the housing market," said Guarrera.
emphasis added
Monday, February 08, 2010
Fitch: Prime Jumbo RMBS Approach 10% Delinquent
by Calculated Risk on 2/08/2010 11:27:00 AM
From Fitch: New Year, No Improvement as U.S. Prime Jumbo RMBS Delinquencies Approach 10%
U.S. prime jumbo loan performance continued to weaken in January as serious delinquencies rose for the 32nd consecutive month, according to Fitch Ratings in the latest edition of Performance Metrics.Another all time record high ... we're all subprime now!
"The new year has brought no relief from declining jumbo loan performance," said Managing Director Vincent Barberio. "The trend line for delinquencies indicates the 10% level could be reached as early as next month."
Although prime jumbo loan delinquencies began to rise in the second quarter of 2007, they accelerated in 2009 nearly tripling over the course of the year. ...
Overall, prime jumbo RMBS 60+ days delinquencies rose to 9.6% for January (up from 9.2% for December 2009). ...
emphasis added


