 RSS Feed
 by Calculated Risk on 2/28/2017 08:11:00 PM
Tuesday, February 28, 2017
Wednesday: Personal Income and Outlays, Auto Sales, ISM Mfg Survey, Construction Spending, Beige Book
Wednesday:
• At 7:00 AM ET, The Mortgage Bankers Association (MBA) will release the results for the mortgage purchase applications index.
• All day, Light vehicle sales for February. The consensus is for light vehicle sales to increase to 17.7 million SAAR in February, from 17.5 million in January (Seasonally Adjusted Annual Rate).
• At 8:30 AM, Personal Income and Outlays for January. The consensus is for a 0.3% increase in personal income, and for a 0.3% increase in personal spending. And for the Core PCE price index to increase 0.2%.
• At 10:00 AM, ISM Manufacturing Index for February. The consensus is for the ISM to be at 56.1, up from 54.7 in December.
• Also at 10:00 AM, Construction Spending for January. The consensus is for a 0.2% increase in construction spending.
• At 2:00 PM, the Federal Reserve Beige Book, an informal review by the Federal Reserve Banks of current economic conditions in their Districts.
Freddie Mac: Mortgage Serious Delinquency rate falls below 1.0% in January, Lowest since June 2008
by Calculated Risk on 2/28/2017 05:31:00 PM
Freddie Mac reported that the Single-Family serious delinquency rate in January was at 0.99%, down from 1.00% in December. Freddie's rate is down from 1.33% in January 2016.
Freddie's serious delinquency rate peaked in February 2010 at 4.20%.
This is the lowest serious delinquency rate since June 2008.
These are mortgage loans that are "three monthly payments or more past due or in foreclosure".
 Click on graph for larger image
Although the rate is declining, the "normal" serious delinquency rate is under 1%.
Maybe the rate will decline another 0.25 percentage points or so to a cycle bottom, but this is pretty close to normal.
Note: Fannie Mae will report soon.
FDIC: Fewer Problem banks, Residential REO Declined in Q4
by Calculated Risk on 2/28/2017 03:48:00 PM
The FDIC released the Quarterly Banking Profile for Q4 today:
Commercial banks and savings institutions insured by the Federal Deposit Insurance Corporation (FDIC) reported aggregate net income of $43.7 billion in the fourth quarter of 2016, up $3.1 billion (7.7 percent) from a year earlier. The increase in earnings was mainly attributable to an $8.4 billion (7.6 percent) increase in net interest income. Financial results for the fourth quarter of 2016 are included in the FDIC's latest Quarterly Banking Profile released today.
Of the 5,913 insured institutions reporting fourth quarter financial results, 59 percent reported year-over-year growth in quarterly earnings. The proportion of banks that were unprofitable in the fourth quarter fell to 8.1 percent from 9.6 percent a year earlier.
...
Deposit Insurance Fund’s Reserve Ratio Rises to 1.20 Percent: The DIF increased $2.5 billion during the fourth quarter to $83.2 billion at the end of December, largely driven by assessment income. The DIF reserve ratio rose from 1.18 percent to 1.20 percent during the quarter. Estimated insured deposits increased 1.4 percent in the fourth quarter. For all of 2016, estimated insured deposits increased 6 percent.
emphasis added
 Click on graph for larger image.
The FDIC reported the number of problem banks declined:
“Problem Bank List” Shows Further Improvement: The number of banks on the FDIC’s Problem Bank List fell from 132 to 123 during the fourth quarter. This is the smallest number of problem banks in more than seven years and is down significantly from the peak of 888 in the first quarter of 2011. Total assets of problem banks rose slightly from $24.9 billion to $27.6 billion during the fourth quarter.
 The dollar value of 1-4 family residential Real Estate Owned (REOs, foreclosure houses) declined from $3.98 billion in Q3 2016 to $3.90 billion in Q4. This is the lowest level of REOs since Q1 2007.
This graph shows the nominal dollar value of Residential REO for FDIC insured institutions. Note: The FDIC reports the dollar value and not the total number of REOs.
Since REOs are reported in dollars, and house prices have increased, it is unlikely FDIC institution REOs will get back to the $2.0 to $2.5 billion range back that happened in 2003 to 2005. FDIC REOs will probably bottom closer to $3 billion.
Real House Prices and Price-to-Rent Ratio in December
by Calculated Risk on 2/28/2017 01:14:00 PM
Here is the earlier post on Case-Shiller: Case-Shiller: National House Price Index increased 5.8% year-over-year in December
It has been more than ten years since the bubble peak. In the Case-Shiller release this morning, the seasonally adjusted National Index (SA), was reported as being 1.4% above the previous bubble peak. However, in real terms, the National index (SA) is still about 14.5% below the bubble peak.
The year-over-year increase in prices is mostly moving sideways now just over 5%. In December, the index was up 5.8% YoY.
In the earlier post, I graphed nominal house prices, but it is also important to look at prices in real terms (inflation adjusted). Case-Shiller, CoreLogic and others report nominal house prices. As an example, if a house price was $200,000 in January 2000, the price would be close to $278,000 today adjusted for inflation (38.9%). That is why the second graph below is important - this shows "real" prices (adjusted for inflation).
Nominal House Prices
 The first graph shows the monthly Case-Shiller National Index SA, the monthly Case-Shiller Composite 20 SA, and the CoreLogic House Price Indexes (through November) in nominal terms as reported.
In nominal terms, the Case-Shiller National index (SA) is at a new peak, and the Case-Shiller Composite 20 Index (SA) is back to August 2005 levels, and the CoreLogic index (NSA) is back to September 2005.
Real House Prices
 The second graph shows the same three indexes in real terms (adjusted for inflation using CPI less Shelter). Note: some people use other inflation measures to adjust for real prices.
In real terms, the National index is back to April 2004 levels, the Composite 20 index is back to December 2003, and the CoreLogic index back to March 2004.
In real terms, house prices are back to late 2003 / early 2004 levels.
Price-to-Rent
In October 2004, Fed economist John Krainer and researcher Chishen Wei wrote a Fed letter on price to rent ratios: House Prices and Fundamental Value. Kainer and Wei presented a price-to-rent ratio using the OFHEO house price index and the Owners' Equivalent Rent (OER) from the BLS.
 Here is a similar graph using the Case-Shiller National, Composite 20 and CoreLogic House Price Indexes.
This graph shows the price to rent ratio (January 1998 = 1.0).
On a price-to-rent basis, the Case-Shiller National index is back to October 2003 levels, the Composite 20 index is back to July 2003 levels, and the CoreLogic index is back to July 2003.
In real terms, and as a price-to-rent ratio, prices are back to late 2003 / early 2004 - and the price-to-rent ratio maybe moving a little more sideways now.
Richmond Fed: Regional Manufacturing Activity Expanded in February
by Calculated Risk on 2/28/2017 10:06:00 AM
From the Richmond Fed: Manufacturing Activity Expanded; Capacity Utilization Rose Sharply
Fifth District manufacturing activity expanded in February, as shipments increased and the volume of new orders rose broadly, according to the latest survey by the Federal Reserve Bank of Richmond. Employment gains were more common and longer workweeks prevailed. Wage increases were more widespread. Prices paid for inputs rose more rapidly than in January, and prices received also accelerated. ...This was the last of the regional Fed surveys for February.
...
Manufacturing activity strengthened in February, pushing the composite index to 17 from the previous reading of 12.
...
The manufacturing employment index increased compared to a month ago, rising two points this month to a reading of 10. The average workweek lengthened, pushing the index to 16 from 5 a month earlier. Average wage increases were also more common in February. That indicator climbed four points to 15. ...
emphasis added
Here is a graph comparing the regional Fed surveys and the ISM manufacturing index:
 Click on graph for larger image.
The New York and Philly Fed surveys are averaged together (yellow, through February), and five Fed surveys are averaged (blue, through February) including New York, Philly, Richmond, Dallas and Kansas City. The Institute for Supply Management (ISM) PMI (red) is through January (right axis).
It seems likely the ISM manufacturing index will show stronger expansion in February (to be released tomorrow), and the consensus is for a reading of 56.1.
Case-Shiller: National House Price Index increased 5.8% year-over-year in December
by Calculated Risk on 2/28/2017 09:18:00 AM
S&P/Case-Shiller released the monthly Home Price Indices for December ("December" is a 3 month average of October, November and December prices).
This release includes prices for 20 individual cities, two composite indices (for 10 cities and 20 cities) and the monthly National index.
Note: Case-Shiller reports Not Seasonally Adjusted (NSA), I use the SA data for the graphs.
From S&P: S&P Corelogic Case-Shiller National Index Sets 30-Month Annual Return High
The S&P CoreLogic Case-Shiller U.S. National Home Price NSA Index, covering all nine U.S. census divisions, reported a 5.8% annual gain in December, up from 5.6% last month and setting a 30-month high. The 10-City Composite posted a 4.9% annual increase, up from 4.4% the previous month. The 20-City Composite reported a year-over-year gain of 5.6%, up from 5.2% in November.
Seattle, Portland, and Denver reported the highest year-over-year gains among the 20 cities over the 11 months leading up to December. Seattle led the way with a 10.8% year-over-year price increase in December, followed by Portland with 10.0%, and Denver with an 8.9% increase. Twelve cities reported greater price increases in the year ending December 2016 versus the year ending November 2016.
...
Before seasonal adjustment, the National Index posted a month-over-month gain of 0.2% in December. Both the 10-City Composite and the 20-City Composite indices posted 0.3% increases. After seasonal adjustment, the National Index recorded a 0.7% month-over-month increase, while the 10-City and 20-City Composites each reported 0.9% month-over-month increases. Eighteen of 20 cities reported increases in December before seasonal adjustment; after seasonal adjustment, all 20 cities saw prices rise.
emphasis added
 Click on graph for larger image.
 The first graph shows the nominal seasonally adjusted Composite 10, Composite 20 and National indices (the Composite 20 was started in January 2000).
The Composite 10 index is off 8.4% from the peak, and up 0.9% in December (SA).
The Composite 20 index is off 6.1% from the peak, and up 0.9% (SA) in December.
The National index is 1.4% above the bubble peak (SA), and up 0.8% (SA) in December. The National index is up 37.1% from the post-bubble low set in December 2011 (SA).
 The second graph shows the Year over year change in all three indices.
The Composite 10 SA is up 4.9% compared to December 2015.
The Composite 20 SA is up 5.6% year-over-year.
The National index SA is up 5.8% year-over-year.
Note: According to the data, prices increased in all 20 cities month-over-month seasonally adjusted.
I'll have more later.
Q4 GDP Unrevised at 1.9% Annual Rate
by Calculated Risk on 2/28/2017 08:34:00 AM
From the BEA: Gross Domestic Product: Fourth Quarter 2016 (Second Estimate)
Real gross domestic product (GDP) increased at an annual rate of 1.9 percent in the fourth quarter of 2016, according to the "second" estimate released by the Bureau of Economic Analysis. In the third quarter, real GDP increased 3.5 percent.Here is a Comparison of Second and Advance Estimates. PCE growth was revised up from 2.3% to 3.0%. (solid PCE). Residential investment was revised down from 10.2% to +9.6%. This was below the consensus forecast.
The GDP estimate released today is based on more complete source data than were available for the "advance" estimate issued last month. In the advance estimate, the increase in real GDP was also 1.9 percent. With the second estimate for the fourth quarter, the general picture of economic growth remains the same; the increase in personal consumption expenditures was larger and increases in state and local government spending and in nonresidential fixed investment were smaller than previously estimated ...
emphasis added
Monday, February 27, 2017
Tuesday: GDP, Case-Shiller House Prices, Chicago PMI
by Calculated Risk on 2/27/2017 09:30:00 PM
From Matthew Graham at Mortgage News Daily: Mortgage Rates Slightly Higher
Mortgage rates moved slightly higher after a strong run to the lowest levels of the year as of last Friday. ... For now, rates are still much closer to 2017's lows. Most borrowers would be quoted the same rate as last Friday, but with slightly higher upfront costs today. The average lender continues to quote 4.125% on top tier scenarios, though there are a few lenders at 4.0% and 4.25%.Tuesday:
emphasis added
• At 8:30 AM ET, Gross Domestic Product, 4th quarter 2016 (second estimate). The consensus is that real GDP increased 2.1% annualized in Q4, up from the advance estimate of 1.9%.
• At 9:00 AM, S&P/Case-Shiller House Price Index for December. Although this is the December report, it is really a 3 month average of October, November and December prices. The consensus is for a 5.4% year-over-year increase in the Comp 20 index for December.
• At 9:45 AM, Chicago Purchasing Managers Index for February. The consensus is for a reading of 52.9, up from 50.3 in January.
• At 10:00 AM, Richmond Fed Survey of Manufacturing Activity for February. This is the last of the regional Fed surveys for February.
Merrill: "The undocumented economy"
by Calculated Risk on 2/27/2017 04:45:00 PM
A few excerpts from a Merrill Lynch research note: The undocumented economy
Let’s consider three scenarios:
1.Improved border security and more aggressive deportations that lower the number of undocumented workers by 200,000 per year. This could be achieved by increasing annual deportations from about 400,000 to 500,000 and stopping 100,000 more people per year at the border.
2. Cut the number of undocumented workers in half over a four year period through tougher enforcement.
3. Effectively eliminate all undocumented workers over a four year period.
...
In the first scenario the economic impacts are likely to be very small. ... The story is very different under the second and third scenarios. Undocumented immigrants tend to specialize in certain kinds of jobs. Hence cutting the labor force in these areas could hurt the productivity of complementary workers causing indirect loses beyond the direct labor force reduction. ... With full deportation an outright recession seems plausible, as output would be disrupted and as the Fed may be unwilling to act because a labor shortage would mean a surge in wage and price inflation.
...
Undocumented immigrants are a relatively small part of the overall labor force [and] our baseline is relatively benign, but we see significant downside risks to that baseline.
emphasis added
Dallas Fed: "Growth in Texas Manufacturing Activity Continues" in February
by Calculated Risk on 2/27/2017 11:11:00 AM
From the Dallas Fed: Growth in Texas Manufacturing Activity Continues
Texas factory activity increased for the eighth consecutive month in February, according to business executives responding to the Texas Manufacturing Outlook Survey. The production index, a key measure of state manufacturing conditions, rose five points to 16.7, suggesting output growth picked up pace this month. ...The Richmond Fed manufacturing survey for February will be released tomorrow. Based on the surveys released so far, it appears manufacturing was very strong in February.
...
The general business activity index returned to positive territory in October 2016 and has pushed further positive every month since, reaching 24.5 this month.
...
Labor market measures indicated employment gains and longer workweeks. The employment index posted a second positive reading in a row—something that hasn’t happened since the end of 2015—and edged up from 6.1 to 9.6. ...
emphasis added
NAR: Pending Home Sales Index decreased 2.8% in January, up 0.4% year-over-year
by Calculated Risk on 2/27/2017 10:04:00 AM
From the NAR: Pending Home Sales Weaken in January
The Pending Home Sales Index, a forward-looking indicator based on contract signings, decreased 2.8 percent to 106.4 in January from an upwardly revised 109.5 in December 2016. Although last month's index reading is 0.4 percent above last January, it is the lowest since then.This was well below expectations of a 1.1% increase for this index. Note: Contract signings usually lead sales by about 45 to 60 days, so this would usually be for closed sales in February and March.
...
The PHSI in the Northeast rose 2.3 percent to 98.7 in January, and is now 3.6 percent above a year ago. In the Midwest the index fell 5.0 percent to 99.5 in January, and is now 3.8 percent lower than January 2016.
Pending home sales in the South inched higher (0.4 percent) to an index of 122.5 in January and are now 2.0 percent above last January. The index in the West dropped 9.8 percent in January to 94.6, and is now 0.4 percent lower than a year ago.
emphasis added
Black Knight: House Price Index up 0.1% in December, Up 5.7% year-over-year
by Calculated Risk on 2/27/2017 08:01:00 AM
Note: I follow several house price indexes (Case-Shiller, CoreLogic, Black Knight, Zillow, FHFA, FNC and more). Note: Black Knight uses the current month closings only (not a three month average like Case-Shiller or a weighted average like CoreLogic), excludes short sales and REOs, and is not seasonally adjusted.
From Black Knight: Black Knight Home Price Index Report: December 2016 Transactions: U.S. Home Prices Up 0.1 Percent for the Month; Up 5.7 Percent Year-Over-Year
• U.S. home prices rose a total of 5.7 percent in 2016, having seen an average of 5.4 percent annual appreciation each month of the year, accelerating into the later monthsThe year-over-year increase in this index has been about the same (5% to 5.7% range) for the last year, although the index picked up a little at the end of 2016.
• December marks 56 consecutive months of annual national home price increases
• Home prices in four of the nation’s 20 largest states and seven of the 40 largest metros hit new peaks
Note that house prices are close to the bubble peak in nominal terms, but not in real terms (adjusted for inflation). Case-Shiller for December will be released tomorrow.
Sunday, February 26, 2017
Vehicle Sales Forecast: Sales Over 17 Million SAAR in February
by Calculated Risk on 2/26/2017 07:46:00 PM
The automakers will report February vehicle sales on Wednesday, March 1st.
Note: There were 24 selling days in February 2017, unchanged from 24 in February 2016.
From WardsAuto: Forecast: U.S. February Sales to Reach 16-Year High
A WardsAuto forecast calls for U.S. automakers to deliver 1.34 million light vehicles in February, a 16-year high for the month. A daily sales rate of 55,949 units over 24 days represents a 0.1% improvement from like-2016 (also 24 days).From Kelley Blue Book: February New-Car Sales To Fall 3 Percent Year-Over-Year; Sales Pace For Industry Is Healthy, Sustainable, According To Kelley Blue Book
The report puts the seasonally adjusted annual rate of sales for the month at 17.70 million units, compared with year-ago’s 17.60 million ...
emphasis added
- New-vehicle sales are expected to decrease 3 percent year-over-year to a total of 1.3 million units in February 2017, resulting in an estimated 17.1 million seasonally adjusted annual rate (SAAR), according to Kelley Blue Book...And from J.D. Power: Despite Record Incentives, Auto Sales Expected to Show Only Modest Gain
Total vehicle sales in February are expected to be similar to a year ago while incentives remain at record levels, according to a forecast developed jointly by J.D. Power and LMC Automotive [17.7 million SAAR].Looks like another strong month for vehicle sales, but incentives are at record levels and inventories are high.
Hotels: Hotel Occupancy Softens in February
by Calculated Risk on 2/26/2017 11:42:00 AM
After a solid start for 2017 - during the slow season - hotel occupancy has been weak over the last few weeks.
From HotelNewsNow.com: STR: US hotel results for week ending 18 February
The U.S. hotel industry reported mixed results in the three key performance metrics during the week of 12-18 February 2017, according to data from STR.The following graph shows the seasonal pattern for the hotel occupancy rate using the four week average.
In a year-over-year comparison with the week of 14-20 February 2016:
• Occupancy: -3.2% to 62.2%
• Average daily rate (ADR): +3.1% to US$124.41
• Revenue per available room (RevPAR): -0.2% to US$77.36
emphasis added
 The red line is for 2017, dashed is 2015, blue is the median, and black is for 2009 - the worst year since the Great Depression for hotels.
2015 was the best year on record for hotels.
For hotels, this is the slow season of the year, and occupancy will pick up into the Spring.
Data Source: STR, Courtesy of HotelNewsNow.com
Saturday, February 25, 2017
Schedule for Week of Feb 26, 2017
by Calculated Risk on 2/25/2017 09:31:00 AM
The key economic report this week is the second estimate of Q4 GDP.
Other key indicators include the February ISM manufacturing and non-manufacturing indexes, February auto sales, and the Case-Shiller house price index.
8:30 AM: Durable Goods Orders for January from the Census Bureau. The consensus is for a 1.8% increase in durable goods orders.
10:00 AM: Pending Home Sales Index for January. The consensus is for a 1.1% increase in the index.
10:30 AM: Dallas Fed Survey of Manufacturing Activity for February.
8:30 AM: Gross Domestic Product, 4th quarter 2016 (second estimate). The consensus is that real GDP increased 2.1% annualized in Q4, up from advance estimate of 1.9%..
 9:00 AM ET: S&P/Case-Shiller House Price Index for December. Although this is the December report, it is really a 3 month average of October, November and December prices.
This graph shows the nominal seasonally adjusted National Index, Composite 10 and Composite 20 indexes through the November 2016 report (the Composite 20 was started in January 2000).
The consensus is for a 5.4% year-over-year increase in the Comp 20 index for December.
9:45 AM: Chicago Purchasing Managers Index for February. The consensus is for a reading of 52.9, up from 54.6 in December.
10:00 AM: Richmond Fed Survey of Manufacturing Activity for February. This is the last of the regional Fed surveys for February.
7:00 AM ET: The Mortgage Bankers Association (MBA) will release the results for the mortgage purchase applications index.
 All day: Light vehicle sales for February. The consensus is for light vehicle sales to increase to 17.7 million SAAR in February, from 17.5 million in January (Seasonally Adjusted Annual Rate).
This graph shows light vehicle sales since the BEA started keeping data in 1967. The dashed line is the January sales rate.
8:30 AM: Personal Income and Outlays for January. The consensus is for a 0.3% increase in personal income, and for a 0.3% increase in personal spending. And for the Core PCE price index to increase 0.2%.
 10:00 AM: ISM Manufacturing Index for February. The consensus is for the ISM to be at 56.1, up from 54.7 in December.
Here is a long term graph of the ISM manufacturing index.
The ISM manufacturing index indicated expansion at 56.0% in January. The employment index was at 56.1%, and the new orders index was at 60.4%.
10:00 AM: Construction Spending for January. The consensus is for a 0.2% increase in construction spending.
2:00 PM: the Federal Reserve Beige Book, an informal review by the Federal Reserve Banks of current economic conditions in their Districts.
8:30 AM ET: The initial weekly unemployment claims report will be released. The consensus is for 240 thousand initial claims, up from 239 thousand the previous week.
10:00 AM: the ISM non-Manufacturing Index for February. The consensus is for index to increase to 57.2 from 57.1 in December.
2:00 PM: Speech by Fed Chair Janet Yellen, Economic Outlook, At the Executives Club of Chicago, Chicago, Ill.
Friday, February 24, 2017
February 2017: Unofficial Problem Bank list declines to 155 Institutions
by Calculated Risk on 2/24/2017 09:49:00 PM
This is an unofficial list of Problem Banks compiled only from public sources.
Here is the unofficial problem bank list for February 2017.
Changes and comments from surferdude808:
Update on the Unofficial Problem Bank List for February 2017. During the month, the list dropped from 163 to 155 institutions after nine removals and one addition. Aggregate assets fell by $1.25 billion to $41.8 billion. A year ago, the list held 229 institutions with assets of $66.0 billion.
Actions were terminated against Bank of Bartlett, Bartlett, TN ($359 million); Farmers & Merchants Bank, Eatonton, GA ($170 million); Solera National Bank, Lakewood, CO ($149 million Ticker: SLRK); Liberty Bell Bank, Marlton, NJ ($145 million Ticker: LBBB); Gulf Coast Community Bank, Pensacola, FL ($135 million); Colonial Co-operative Bank, Gardner, MA ($73 million); and American Patriot Bank, Greeneville, TN ($58 million).
Several banks merged to find their way off the problem bank list including Polonia Bank, Huntingdon Valley, PA ($276 million Ticker: PBCP) and MBank, Gresham, OR ($158 million Ticker: MBNC).
The addition this month was Ashton State Bank, Ashton, NE ($23 million).
We anticipate for the FDIC on Tuesday to release industry results for the fourth quarter and updated figures for the official problem bank list.
A few Comments on January New Home Sales
by Calculated Risk on 2/24/2017 02:36:00 PM
New home sales for January were reported at 555,000 on a seasonally adjusted annual rate basis (SAAR). This was below the consensus forecast, and the three previous months were all revised down. So overall this was a disappointing report.
Sales were up 5.5% year-over-year in January, However, January and February were the weakest months last year on a seasonally adjusted annual rate basis - so this was an easy comparison.
Note that these sales (for January) occurred after mortgage rates increased following the election. As I've noted before, interest rate changes impact new home sales before existing home sales because new home sales are counted when the contract is signed, and existing home sales at the close of escrow.
This is just the second month of data after the rate increase, and we might be seeing a small dip in sales due to higher interest rates. However, so far, we haven't seen any impact on existing home sales.
It will take several months of data to see the impact of higher mortgage rates - and this is the seasonally weak period - so we might have to wait for the March and April data.
Earlier: New Home Sales increase to 555,000 Annual Rate in January.
 Click on graph for larger image.
This graph shows new home sales for 2016 and 2017 by month (Seasonally Adjusted Annual Rate). Sales were up 5.5% year-over-year in January.
New home sales averaged 559 thousand per month (SAAR) in 2016, so January was about at the average rate for last year.
And here is another update to the "distressing gap" graph that I first started posting a number of years ago to show the emerging gap caused by distressed sales. Now I'm looking for the gap to close over the next several years.
 The "distressing gap" graph shows existing home sales (left axis) and new home sales (right axis) through January 2017. This graph starts in 1994, but the relationship had been fairly steady back to the '60s.
Following the housing bubble and bust, the "distressing gap" appeared mostly because of distressed sales. The gap has persisted even though distressed sales are down significantly, since new home builders focused on more expensive homes.
I expect existing home sales to move more sideways, and I expect this gap to slowly close, mostly from an increase in new home sales.
However, this assumes that the builders will offer some smaller, less expensive homes. If not, then the gap will persist.
Note: Existing home sales are counted when transactions are closed, and new home sales are counted when contracts are signed. So the timing of sales is different.
Earlier: February Consumer Sentiment at 96.3
by Calculated Risk on 2/24/2017 12:07:00 PM
The University of Michigan consumer sentiment index for February was at 96.3, down from 98.5 in January.
While consumer confidence edged upward in late February, it remained slightly below the decade peak recorded in January. Overall, the Sentiment Index has been higher during the past three months than anytime since March 2004. Normally, the implication would be that consumers expected Trump's election to have a positive economic impact. That is not the case since the gain represents the result of an unprecedented partisan divergence, with Democrats expecting recession and Republicans expecting robust growth. Indeed, the difference between these two parties is nearly identical to the difference between the all-time peak and trough values in the Expectations Index - 64.6 versus 64.4. While the expectations of Democrats and Republicans largely offset each other, the overall gain in the Expectations Index was due to self-identified Independents, who were much closer to the optimism of the Republicans than the pessimism of the Democrats. (Note: the February Expectations Index was 55.5 among Democrats, 120.1 among Republicans, and 89.2 among Independents.) Since neither recession nor robust growth is expected in 2017, both extremes must eventually converge
emphasis added

Click on graph for larger image.
Consumer sentiment is a concurrent indicator (not a leading indicator).
New Home Sales increase to 555,000 Annual Rate in January
by Calculated Risk on 2/24/2017 10:12:00 AM
The Census Bureau reports New Home Sales in January were at a seasonally adjusted annual rate (SAAR) of 555 thousand.
The previous three months were revised down..
"Sales of new single-family houses in January 2017 were at a seasonally adjusted annual rate of 555,000, according to estimates released jointly today by the U.S. Census Bureau and the Department of Housing and Urban Development. This is 3.7 percent above the revised December rate of 535,000 and is 5.5 percent above the January 2016 estimate of 526,000."
emphasis added
 Click on graph for larger image.
The first graph shows New Home Sales vs. recessions since 1963. The dashed line is the current sales rate.
Even with the increase in sales over the last several years, new home sales are still fairly low historically.
The second graph shows New Home Months of Supply.
 The months of supply was unchanged in January at 5.7 months.
 The all time record was 12.1 months of supply in January 2009.
This is now in the normal range (less than 6 months supply is normal).
"The seasonally-adjusted estimate of new houses for sale at the end of January was 265,000. This represents a supply of 5.7 months at the current sales rate."
 On inventory, according to the Census Bureau:
 "A house is considered for sale when a permit to build has been issued in permit-issuing places or work has begun on the footings or foundation in nonpermit areas and a sales contract has not been signed nor a deposit accepted."Starting in 1973 the Census Bureau broke this down into three categories: Not Started, Under Construction, and Completed.
The third graph shows the three categories of inventory starting in 1973.
The inventory of completed homes for sale is still low, and the combined total of completed and under construction is also low.
 The last graph shows sales NSA (monthly sales, not seasonally adjusted annual rate).
In January 2017 (red column), 41 thousand new homes were sold (NSA). Last year, 39 thousand homes were sold in January.
The all time high for January was 92 thousand in 2005, and the all time low for January was 21 thousand in 2011.
This was below expectations of 573,000 sales SAAR. I'll have more later today.
Thursday, February 23, 2017
Friday: New Home Sales
by Calculated Risk on 2/23/2017 07:53:00 PM
From Tim Duy at Bloomberg Whom to Listen to in the Fed Minutes
When it comes to the meetings of the Federal Open Market Committee, not all central bank policy makers are created equally. There are “participants” -- all the policy makers in the room -- and there are “members,” those who have a vote. It is important to keep this distinction in mind when reading the minutes of the FOMC meetings -- especially because many of the more hawkish members of the Fed are participants, not members.Friday:
...
So even though "many" participants appeared interested in moving rate hikes forward, "many" members “many” were comfortable with the expected pace of tightening, “some” might be somewhat more cautious but as of now their concerns appear to remain unfounded, while only “one” is looking to hike soon.
...
Overall, the minutes leave my assessment of the upcoming meeting little changed. Odds favor that the Fed will hold rates steady in March – the data largely confirms the existing forecasts and seems consistent with views of much of the committee that there is no need to rush rates. To be sure, upcoming inflation and employment reports could alter that outlook and pull the next rate hike forward. But given the cautious approach of committee members, stronger data might be pulling a June hike to May rather than all the way to March.
• At 10:00 AM ET, New Home Sales for January from the Census Bureau. The consensus is for a increase in sales to 573 thousand Seasonally Adjusted Annual Rate (SAAR) in January from 536 thousand in December.
• Also at 10:00 AM, University of Michigan's Consumer sentiment index (final for February). The consensus is for a reading of 96.0, up from the preliminary reading 95.7.
Update on lack of Chinese Residential Real Estate Buyers
by Calculated Risk on 2/23/2017 03:47:00 PM
A few weeks ago I wrote Some Random Concerns and Observations .... One of my concerns was that stricter capital controls in China would negatively impact certain U.S. real estate markets. After that post, I spoke to an excellent source in San Marino (high end area of Los Angeles), and he told me that some Chinese owners were looking to sell (impacting prices).
Here is an article today from David Pierson at the LA Times: Mega-mansions in this L.A. suburb used to sell to Chinese buyers in days. Now they're sitting empty for months
The turnaround in activity, industry officials say, is directly linked to policies in China. ... To defend against capital flight, Chinese regulators allow citizens to take out only $50,000 a year. But that’s been largely ignored and circumvented, often by asking dozens of friends and family to exercise their quota on someone else’s behalf.If this continues, then this will impact certain areas - and have spillover effects to other areas.
... on Dec. 31, China’s State Administration of Foreign Exchange, which swaps Chinese yuan for dollars, issued some of its strictest guidelines yet. Customers now have to pledge not to invest in foreign property and provide a detailed account of how foreign funds will be used. They also prohibited customers from taking foreign currency out for someone else.
The rules could have broad implications around the world for any city exposed to Chinese real estate investment such as Vancouver, Sydney and more recently, Seattle.
Kansas City Fed: Regional Manufacturing Activity "Expanded Further" in February
by Calculated Risk on 2/23/2017 11:00:00 AM
From the Kansas City Fed: Tenth District Manufacturing Activity Expanded Further
The Federal Reserve Bank of Kansas City released the February Manufacturing Survey today. According to Chad Wilkerson, vice president and economist at the Federal Reserve Bank of Kansas City, the survey revealed that Tenth District manufacturing activity expanded further with continued strong expectations.The Kansas City region was hit hard by the decline in oil prices, but activity is expanding solidly again. The regional Fed surveys suggest a strong reading for the ISM manufacturing index for February.
“This was the highest reading for our month-over-month composite index since June 2011,” said Wilkerson. “In addition, the future composite index was the highest since our survey switched to a monthly frequency in 2001.”
...
The month-over-month composite index was 14 in February, its highest reading since June 2011, up from 9 in both January and December. The composite index is an average of the production, new orders, employment, supplier delivery time, and raw materials inventory indexes. Activity in both durable and nondurable goods plants increased, particularly for metals, machinery, computer, and electronic products. Most month-over-month indexes improved moderately in February. The new orders, order backlog, and employment indexes all edged higher, and the new orders for exports index moved into positive territory for the first time in over a year. ... The future composite index moved higher from 27 to 29, its highest reading since the survey moved to a monthly frequency in 2001.
emphasis added
Weekly Initial Unemployment Claims increase to 244,000, 4-Week Average Lowest Since 1973
by Calculated Risk on 2/23/2017 08:38:00 AM
The DOL reported:
In the week ending February 18, the advance figure for seasonally adjusted initial claims was 244,000, an increase of 6,000 from the previous week's revised level. The previous week's level was revised down by 1,000 from 239,000 to 238,000. The 4-week moving average was 241,000, a decrease of 4,000 from the previous week's revised average. This is the lowest level for this average since July 21, 1973 when it was 239,500. The previous week's average was revised down by 250 from 245,250 to 245,000.The previous week was revised down.
emphasis added
The following graph shows the 4-week moving average of weekly claims since 1971.
 Click on graph for larger image.
The dashed line on the graph is the current 4-week average. The four-week average of weekly unemployment claims decreased to 241,000.
This was close to the consensus forecast.
The low level of claims suggests relatively few layoffs.
Black Knight: Mortgage Delinquencies Declined in January
by Calculated Risk on 2/23/2017 07:00:00 AM
From Black Knight: Black Knight Financial Services’ First Look at January Mortgage Data: Impact of Rising Rates Felt as Prepayments Decline by 30 Percent in January
• Prepayment speeds (historically a good indicator of refinance activity) declined by 30 percent in January to the lowest level since February 2016According to Black Knight's First Look report for January, the percent of loans delinquent decreased 3.9% in January compared to December, and declined 16.6% year-over-year.
• Delinquencies improved by 3.9 percent from December and were down 17 percent from January 2016
• Foreclosure starts rose 18 percent for the month; January’s 70,400 starts were the most since March 2016
• 2.6 million borrowers are behind on mortgage payments, the lowest number since August 2006, immediately following the pre-crisis national peak in home prices
The percent of loans in the foreclosure process declined 0.5% in January and were down 27.6% over the last year.
Black Knight reported the U.S. mortgage delinquency rate (loans 30 or more days past due, but not in foreclosure) was 4.25% in January, down from 4.42% in December.
The percent of loans in the foreclosure process declined in January to 0.94%.
The number of delinquent properties, but not in foreclosure, is down 413,000 properties year-over-year, and the number of properties in the foreclosure process is down 178,000 properties year-over-year.
| Black Knight: Percent Loans Delinquent and in Foreclosure Process | ||||
|---|---|---|---|---|
| Jan 2017 | Dec 2016 | Jan 2016 | Jan 2015 | |
| Delinquent | 4.25% | 4.42% | 5.09% | 5.48% |
| In Foreclosure | 0.94% | 0.95% | 1.30% | 1.76% |
| Number of properties: | ||||
| Number of properties that are delinquent, but not in foreclosure: | 2,162,000 | 2,248,000 | 2,575,000 | 2,764,000 |
| Number of properties in foreclosure pre-sale inventory: | 481,000 | 483,000 | 659,000 | 885,000 |
| Total Properties | 2,643,000 | 2,731,000 | 3,234,000 | 3,649,000 |
Wednesday, February 22, 2017
Thursday: Unemployment Claims
by Calculated Risk on 2/22/2017 07:23:00 PM
Thursday:
• At 8:30 AM ET, The initial weekly unemployment claims report will be released. The consensus is for 240 thousand initial claims, up from 239 thousand the previous week.
• Also at 8:30 AM, Chicago Fed National Activity Index for January. This is a composite index of other data.
• At 9:00 AM, FHFA House Price Index for December 2016. This was originally a GSE only repeat sales, however there is also an expanded index.
• At 11:00 AM, the Kansas City Fed manufacturing survey for February.
A Few Comments on January Existing Home Sales
by Calculated Risk on 2/22/2017 05:35:00 PM
Earlier: NAR: "Existing-Home Sales Jump in January"
A few key points:
1) As usual, housing economist Tom Lawler's forecast was closer to the NAR report than the consensus.
2) The contracts for most of the January existing home sales were entered after the recent increase in mortgage rates (rates started increasing after the election).
With the recent increase in rates, I'd expect some decline in sales volume as happened following the "taper tantrum" in 2013. So far that hasn't happened.
3) Inventory is still very low and falling year-over-year (down 7.1% year-over-year in January). More inventory would probably mean smaller price increases and slightly higher sales, and less inventory means lower sales and somewhat larger price increases.
Two of the key reasons inventory is low: 1) A large number of single family home and condos were converted to rental units. In 2015, housing economist Tom Lawler estimated there were 17.5 million renter occupied single family homes in the U.S., up from 10.7 million in 2000. Many of these houses were purchased by investors, and rents have increased substantially, and the investors are not selling (even though prices have increased too). Most of these rental conversions were at the lower end, and that is limiting the supply for first time buyers. 2) Baby boomers are aging in place (people tend to downsize when they are 75 or 80, in another 10 to 20 years for the boomers). Instead we are seeing a surge in home improvement spending, and this is also limiting supply.
Of course low inventory keeps potential move-up buyers from selling too. If someone looks around for another home, and inventory is lean, they may decide to just stay and upgrade.
I expect inventory will be increasing year-over-year by the end of 2017.
The following graph shows existing home sales Not Seasonally Adjusted (NSA).
 Click on graph for larger image.
Sales NSA in January (red column) were the highest for January since 2007 (NSA).
Note that sales NSA are in the slow seasonal period, and will increase sharply (NSA) in March.
FOMC Minutes: "Might be appropriate to raise the federal funds rate again fairly soon"
by Calculated Risk on 2/22/2017 02:05:00 PM
From the Fed: Minutes of the Federal Open Market Committee, January 31-February 1, 2017 . Excerpts:
In discussing the outlook for monetary policy over the period ahead, many participants expressed the view that it might be appropriate to raise the federal funds rate again fairly soon if incoming information on the labor market and inflation was in line with or stronger than their current expectations or if the risks of overshooting the Committee's maximum-employment and inflation objectives increased. A few participants noted that continuing to remove policy accommodation in a timely manner, potentially at an upcoming meeting, would allow the Committee greater flexibility in responding to subsequent changes in economic conditions. Several judged that the risk of a sizable undershooting of the longer-run normal unemployment rate was high, particularly if economic growth was faster than currently expected. If that situation developed, the Committee might need to raise the federal funds rate more quickly than most participants currently anticipated to limit the buildup of inflationary pressures. However, with inflation still short of the Committee's objective and inflation expectations remaining low, a few others continued to see downside risks to inflation or anticipated only a gradual return of inflation to the 2 percent objective as the labor market strengthened further. A couple of participants expressed concern that the Committee's communications about a gradual pace of policy firming might be misunderstood as a commitment to only one or two rate hikes per year and stressed the importance of communicating that policy will respond to the evolving economic outlook as appropriate to achieve the Committee's objectives. Participants also generally agreed that the Committee should begin discussions at upcoming meetings about the economic conditions that could warrant changes in the existing policy of reinvesting proceeds from maturing Treasury securities and principal payments from agency debt and mortgage-backed securities, as well as how those changes would be implemented and communicated.
emphasis added
AIA: Architecture Billings Index decreased in January
by Calculated Risk on 2/22/2017 11:01:00 AM
Note: This index is a leading indicator primarily for new Commercial Real Estate (CRE) investment.
From the AIA: Entering 2017, architecture billings slip modestly
The Architecture Billings Index (ABI) dipped slightly into negative territory in January, after a very strong showing in December. As a leading economic indicator of construction activity, the ABI reflects the approximate nine to twelve month lead time between architecture billings and construction spending. The American Institute of Architects (AIA) reported the January ABI score was 49.5, down from a score of 55.6 in the previous month. This score reflects a minor decrease in design services (any score above 50 indicates an increase in billings). The new projects inquiry index was 60.0, up from a reading of 57.6 the previous month.
“This small decrease in activity, taking into consideration strong readings in project inquiries and new design contracts, isn’t exactly a cause for concern,” said AIA Chief Economist, Kermit Baker, Hon. AIA, PhD. “The fundamentals of a sound nonresidential design and construction market persist.”
...
• Regional averages: South (54.2), Northeast (53.0), Midwest (52.4), West (48.8)
• Sector index breakdown: institutional (54.6), commercial / industrial (53.4), mixed practice (48.1), multi-family residential (48.1)
emphasis added
 Click on graph for larger image.
This graph shows the Architecture Billings Index since 1996. The index was at 49.5 in January, down from 55.6 in December. Anything above 50 indicates expansion in demand for architects' services.
Note: This includes commercial and industrial facilities like hotels and office buildings, multi-family residential, as well as schools, hospitals and other institutions.
According to the AIA, there is an "approximate nine to twelve month lag time between architecture billings and construction spending" on non-residential construction. This index was positive in 9 of the last 12 months, suggesting a further increase in CRE investment in 2017.
NAR: "Existing-Home Sales Jump in January"
by Calculated Risk on 2/22/2017 10:09:00 AM
From the NAR: Existing-Home Sales Jump in January
Existing-home sales stepped out to a fast start in 2017, surpassing a recent cyclical high and increasing in January to the fastest pace in almost a decade, according to the National Association of Realtors®. All major regions except for the Midwest saw sales gains last month.
Total existing-home sales, which are completed transactions that include single-family homes, townhomes, condominiums and co-ops, expanded 3.3 percent to a seasonally adjusted annual rate of 5.69 million in January from an upwardly revised 5.51 million in December 2016. January's sales pace is 3.8 percent higher than a year ago (5.48 million) and surpasses November 2016 (5.60 million) as the strongest since February 2007 (5.79 million).
In December, existing sales decreased 2.8 percent to a seasonally adjusted annual rate of 5.49 million in December from an upwardly revised 5.65 million in November. With last month's slide, sales are only 0.7 percent higher than a year ago....
Total housing inventory at the end of January rose 2.4 percent to 1.69 million existing homes available for sale, but is still 7.1 percent lower than a year ago (1.82 million) and has fallen year-over-year for 20 straight months. Unsold inventory is at a 3.6-month supply at the current sales pace (unchanged from December 2016).
 Click on graph for larger image.
This graph shows existing home sales, on a Seasonally Adjusted Annual Rate (SAAR) basis since 1993.
Sales in January (5.69 million SAAR) were 3.3% higher than last month, and were 3.8% above the January 2016 rate.
The second graph shows nationwide inventory for existing homes.
 According to the NAR, inventory increased to 1.69 million in January from 1.65 million in December. Headline inventory is not seasonally adjusted, and inventory usually decreases to the seasonal lows in December and January, and peaks in mid-to-late summer.
The third graph shows the year-over-year (YoY) change in reported existing home inventory and months-of-supply. Since inventory is not seasonally adjusted, it really helps to look at the YoY change. Note: Months-of-supply is based on the seasonally adjusted sales and not seasonally adjusted inventory.
 Inventory decreased 7.1% year-over-year in January compared to January 2016.
 Months of supply was at 3.6 months in January.
This was above consensus expectations. For existing home sales, a key number is inventory - and inventory is still low. I'll have more later ...
MBA: Mortgage Applications Decrease in Latest Weekly Survey
by Calculated Risk on 2/22/2017 07:00:00 AM
From the MBA: Mortgage Applications Decrease in Latest MBA Weekly Survey
Mortgage applications decreased 2.0 percent from one week earlier, according to data from the Mortgage Bankers Association’s (MBA) Weekly Mortgage Applications Survey for the week ending February 17, 2017.
... The Refinance Index decreased 1 percent from the previous week to the lowest level since January 2017. The seasonally adjusted Purchase Index decreased 3 percent from one week earlier to the lowest level since November 2016. The unadjusted Purchase Index increased 2 percent compared with the previous week and was 10 percent higher than the same week one year ago which included the President’s Day holiday.
...
The average contract interest rate for 30-year fixed-rate mortgages with conforming loan balances ($424,100 or less) increased to 4.36 percent from 4.32 percent, with points increasing to 0.35 from 0.34 (including the origination fee) for 80 percent loan-to-value ratio (LTV) loans.
emphasis added
 Click on graph for larger image.
The first graph shows the refinance index since 1990.
It would take a substantial decrease in mortgage rates to see a significant increase in refinance activity.
 The second graph shows the MBA mortgage purchase index.
 Even with the recent increase in mortgage rates, purchase activity is still holding up.
However refinance activity has declined significantly since rates increased.
Tuesday, February 21, 2017
Wednesday: Existing Home Sales, FOMC Minutes
by Calculated Risk on 2/21/2017 07:09:00 PM
From Matthew Graham at Mortgage News Daily: Mortgage Rates Inch Higher Ahead of Fed Minutes
Mortgage rates were just slightly higher today, leaving them roughly in the center of a range that's persisted since mid-November. During that time the average top-tier conventional 30yr fixed rate has been briefly as high as 4.5% and as low as 4.0%. Those are the exceptions. The range has predominantly been a narrower 4.125-4.375%. The average lender is quoting 4.25% today, though there are a few offering 4.125%.Wednesday:
emphasis added
• At 7:00 AM ET, The Mortgage Bankers Association (MBA) will release the results for the mortgage purchase applications index.
• At 10:00 AM, Existing Home Sales for January from the National Association of Realtors (NAR). The consensus is for 5.55 million SAAR, up from 5.49 million in December. Housing economist Tom Lawler expects the NAR to report sales of 5.60 million SAAR in January.
• During the day: The AIA's Architecture Billings Index for January (a leading indicator for commercial real estate).
• At 2:00 PM, FOMC Minutes for the Meeting of January 31-February 1, 2017
Chemical Activity Barometer increases in February
by Calculated Risk on 2/21/2017 02:10:00 PM
Note: This appears to be a leading indicator for industrial production.
From the American Chemistry Council: Chemical Activity Barometer Continues Steady Climb; Consumer and Business Confidence Strengthening
The Chemical Activity Barometer (CAB), a leading economic indicator created by the American Chemistry Council (ACC), posted a strong gain in February of 0.4 percent, following a similar 0.4 percent gain in January. This follows a steady 0.3 percent gain every month during the third quarter of 2016. All data is measured on a three-month moving average (3MMA). Accounting for adjustments, the CAB is now up was up 5.0 percent over this time last year, marking its strongest year-over-year performance since September 2010.
...
In February all of the four core categories for the CAB improved, with the diffusion index strengthening to 71 percent. Production-related indicators were positive, with the housing report indicating slipping starts, but improving permits. This was coupled with an improvement in U.S. exports. Equity prices also improved at a robust pace, reflecting an improvement in consumer and business confidence. Overall the barometer continues to hint at gains in U.S. business activity through the third quarter.
...
Applying the CAB back to 1912, it has been shown to provide a lead of two to fourteen months, with an average lead of eight months at cycle peaks as determined by the National Bureau of Economic Research. The median lead was also eight months. At business cycle troughs, the CAB leads by one to seven months, with an average lead of four months. The median lead was three months. The CAB is rebased to the average lead (in months) of an average 100 in the base year (the year 2012 was used) of a reference time series. The latter is the Federal Reserve’s Industrial Production Index.
emphasis added
 Click on graph for larger image.
This graph shows the year-over-year change in the 3-month moving average for the Chemical Activity Barometer compared to Industrial Production. It does appear that CAB (red) generally leads Industrial Production (blue).
CAB has increased solidly over the last several months, and this suggests an increase in Industrial Production in 2017.
Peak Renter
by Calculated Risk on 2/21/2017 12:26:00 PM
It was six years ago that we started discussing the turnaround for apartments. Then, in January 2011, I attended the NMHC Apartment Strategies Conference in Palm Springs, and the atmosphere was very positive.
The drivers were 1) very low new supply, and 2) strong demand (favorable demographics, and people moving from owning to renting).
Demographics are now somewhat less favorable, and the move "from owning to renting" is mostly over. Multi-family construction peaked in June 2015 (as I noted at the time), however more supply than demand has still been coming online.
Note: The NMHC market tightness apartment survey has been indicating looser conditions for five consecutive quarters.
Today, from Laura Kusisto at the WSJ: Banks Retreat From Apartment Market
Swelling supplies of apartment units are prompting big banks to pull back from new projects, forcing developers to scramble for capital, in a sign that the U.S. apartment industry headed for a downturn. ... fresh supply is beginning to overwhelm demand. More than 378,000 new apartments are expected to be completed in 2017, a 30-year high, according to real estate researcher Axiometrics Inc.I expect the vacancy rate to increase and for rent increases to slow.
Mortgage Debt as Percent of GDP
by Calculated Risk on 2/21/2017 09:43:00 AM
Yesterday I excerpted from a post I wrote in February 2005 (yes, 12 years ago).
In that 2005 post, I included a graph of household mortgage debt as a percent of GDP. Several readers asked if I could update the graph.
First, from 2005:
The following chart shows household mortgage debt as a % of GDP. Although mortgage debt has been increasing for years, the last four years have seen a tremendous increase in debt. Last year alone mortgage debt increased close to $800 Billion - almost 7% of GDP.
Source: Federal Reserve


 The second graph shows household mortgage debt as a percent of GDP through Q4 2016.
Mortgage debt has declined by $1.21 trillion from the peak. Studies suggest most of the decline in debt has been because of foreclosures (or short sales), but some of the decline is from homeowners paying down debt (sometimes so they can refinance at better rates).
The "bubble" is pretty obvious on this graph, and the sharp increase in mortgage debt was one of the warning signs.
Monday, February 20, 2017
Monday Night Futures
by Calculated Risk on 2/20/2017 08:10:00 PM
Weekend:
• Schedule for Week of Feb 19, 2017
• Post from 2005: Mortgage Debt and the "Recovery"
• Demographics and GDP
From CNBC: Pre-Market Data and Bloomberg futures: S&P futures are up 4, and DOW futures are up 29 (fair value).
Oil prices were down slightly over the last week with WTI futures at $53.69 per barrel and Brent at $56.14 per barrel. A year ago, WTI was at $29, and Brent was at $32 - so oil prices are up sharply year-over-year.
Here is a graph from Gasbuddy.com for nationwide gasoline prices. Nationally prices are at $2.28 per gallon - a year ago prices were at $1.72 per gallon - so gasoline prices are up about 55 cents a gallon year-over-year.
Post from 2005: Mortgage Debt and the "Recovery"
by Calculated Risk on 2/20/2017 12:49:00 PM
Here are some excerpts from a post I wrote in February 2005 (hard to believe this was 12 years ago).
Note: I think I've improved the graphs since then! From 2005:
The following chart shows household mortgage debt as a % of GDP. Although mortgage debt has been increasing for years, the last four years have seen a tremendous increase in debt. Last year alone mortgage debt increased close to $800 Billion - almost 7% of GDP.
Source: Federal Reserve
Some obervers have remarked that mortgage debt is still below 50% of household RE assets - and that is an accurate statement. In fact, if you plot mortgage debt vs. household RE assets everything looks reasonable.
Source: Federal Reserve
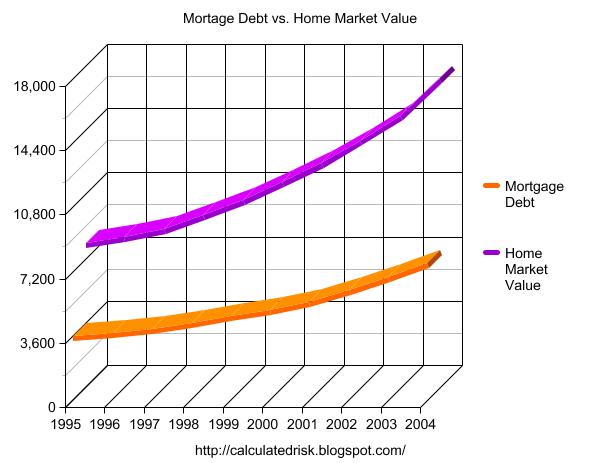
But lets plot household RE assets as a % of GDP.
Source: Federal Reserve
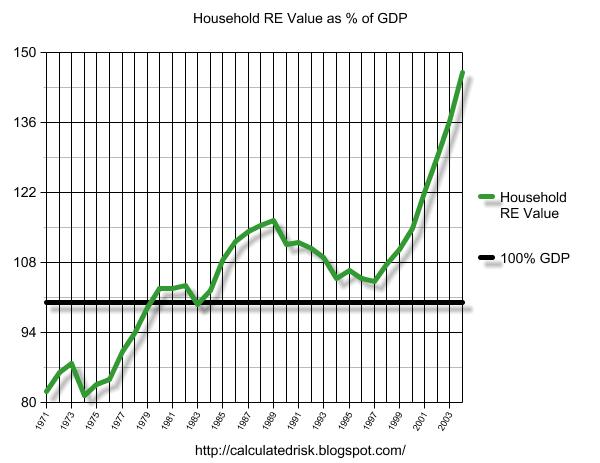
This final graph shows the potential problem. Household assets have really soared in the last few years. Many homeowners have refinanced their homes (or moved and taken cash out), in essence using their homes as an ATM.
It wouldn't take a RE bust to impact the general economy. Just a slowdown in both volume (to impact employment) and in prices (to slow down borrowing) might push the general economy into recession. An actual bust, especially with all of the extensive sub-prime lending, might cause a serious problem.
CR note: And a serious problem is what happened.
Fannie and Freddie: REO inventory declined in Q4, Down 33% Year-over-year
by Calculated Risk on 2/20/2017 10:36:00 AM
Fannie and Freddie reported results last week. Here is some information on Real Estate Owned (REOs).
Freddie Mac reported the number of REO declined to 11,418 at the end of Q4 2106 compared to 17,004 at the end of Q4 2015.
For Freddie, this is down 85% from the 74,897 peak number of REOs in Q3 2010. For Freddie, this is the lowest since at least 2007.
Fannie Mae reported the number of REO declined to 38,093 at the end of Q4 2016 compared to 57,253 at the end of Q4 2015.
For Fannie, this is down 77% from the 166,787 peak number of REOs in Q3 2010. For Fannie, this is the lowest since Q4 2007.
 Click on graph for larger image.
Here is a graph of Fannie and Freddie Real Estate Owned (REO).
REO inventory decreased in Q4 for both Fannie and Freddie, and combined inventory is down 33% year-over-year.
Delinquencies are falling, but there are still a number of properties in the foreclosure process with long time lines in judicial foreclosure states - but this is getting close to normal levels of REOs.
Sunday, February 19, 2017
Don't like the data? Change it!
by Calculated Risk on 2/19/2017 08:47:00 PM
From the WSJ: Trump Administration Considers Change in Calculating U.S. Trade Deficit
The Trump administration is considering changing the way it calculates U.S. trade deficits, a shift that would make the country’s trade gap appear larger than it had in past years ...I'm all for constantly evaluating methods, and improving data collection and reporting, but this - as reported - doesn't seem to make sense.
The leading idea under consideration would exclude from U.S. exports any goods first imported into the country, such as cars, and then transferred to a third country like Canada or Mexico unchanged, these people told The Wall Street Journal.
Economists say that approach would inflate trade deficit numbers because it would typically count goods as imports when they come into the country but not count the same goods when they go back out, known as re-exports.
If a car is imported to the U.S., and then is unchanged and exported to a third country, it seems there would be two choices: 1) Count it is an import AND an export, or 2) don't count it as either an import or export (it is just passing through). But counting the import and not the export makes as much sense as counting the export, but not the import. Crazy.
Demographics and GDP
by Calculated Risk on 2/19/2017 10:25:00 AM
Two years ago I wrote: Demographics and GDP: 2% is the new 4%. As I noted, "One simple way to look at the change in GDP is as the change in the labor force, times the change in productivity. If the labor force is growing quickly, GDP will be higher with the same gains in productivity. And the opposite is true."
Obviously demographics are important for GDP.
Last week, Goldman Sachs economist Daan Struyven wrote: Immigration Restrictions: A Downside Risk to the Economy's Speed Limit. Here are few excerpts from his note:
The contribution from net immigration to total population growth has risen from 30% in the 1990s to 40-50% recently as the natural increase in population has slowed. The effect of immigration on growth of the labor force is even more pronounced as immigrants tend to be younger and therefore more likely to participate in the labor force than the native-born population. As a result, net immigration currently accounts for virtually all of the 0.5% trend increase in the labor force.As Struyven notes, immigrations restrictions will lower potenetial GDP.
Reduced immigration would result in slower labor force growth and therefore slower growth in potential GDP—the economy’s “speed limit”. In addition, academic studies suggest there could be negative knock-on effects on productivity growth. As a result, we see immigration restrictions as an important source of downside risk to our 1.75% estimate of potential growth.
And yesterday, Professor Krugman wrote: Trump’s Rosy Scenario
The claimed returns to Trumpnomics are close to the highest growth rates we’ve seen under any modern administration. Real GDP grew 3.4 percent annually under Reagan; it grew 3.7 percent annually under Clinton ... But there are fundamental reasons to believe that such growth is unlikely to happen now.CR Note: It seems very unlikely that growth will pick up sharply, especially if there are severe immigration restrictions.
First, demography: Reagan took office with baby boomers — and women — still entering the work force; these days baby boomers are leaving. ... Just on demography alone, then, you’d expect growth to be around a percentage point lower than it was under Reagan.
Saturday, February 18, 2017
Schedule for Week of Feb 19, 2017
by Calculated Risk on 2/18/2017 08:11:00 AM
The key economic report this week are January New and Existing Home sales.
All US markets are closed in observance of the Presidents' Day holiday.
No major economic releases scheduled.
7:00 AM ET: The Mortgage Bankers Association (MBA) will release the results for the mortgage purchase applications index.
 10:00 AM: Existing Home Sales for January from the National Association of Realtors (NAR). The consensus is for 5.55 million SAAR, up from 5.49 million in December.
Housing economist Tom Lawler expects the NAR to report sales of 5.60 million SAAR in January.
During the day: The AIA's Architecture Billings Index for January (a leading indicator for commercial real estate).
2:00 PM: FOMC Minutes for the Meeting of January 31-February 1, 2017
8:30 AM ET: The initial weekly unemployment claims report will be released. The consensus is for 240 thousand initial claims, up from 239 thousand the previous week.
8:30 AM: Chicago Fed National Activity Index for January. This is a composite index of other data.
9:00 AM: FHFA House Price Index for December 2016. This was originally a GSE only repeat sales, however there is also an expanded index.
11:00 AM: the Kansas City Fed manufacturing survey for February.
 10:00 AM ET: New Home Sales for January from the Census Bureau.
 This graph shows New Home Sales since 1963. The dashed line is the December sales rate.
The consensus is for a increase in sales to 573 thousand Seasonally Adjusted Annual Rate (SAAR) in January from 536 thousand in December.
10:00 AM: University of Michigan's Consumer sentiment index (final for February). The consensus is for a reading of 96.0, up from the preliminary reading 95.7.
Friday, February 17, 2017
Lawler: Early Read on Existing Home Sales in January
by Calculated Risk on 2/17/2017 04:12:00 PM
From housing economist Tom Lawler: Early Read on Existing Home Sales in January
Based on publicly-available state and/or local realtor/MLS reports released through today, I project that US existing home sales as estimated by the National Association of Realtors ran at a seasonally adjusted annual rate of 5.60 million, up 2.0% from December’s preliminary pace and up 2.4% from last January’s seasonally-adjusted pace. Unadjusted sales should show a larger YOY gain, reflecting the higher business day count this January compared to last January. Remember that in the January report the NAR will update its seasonal factors (and as a result its seasonally adjusted sales figures) both for last year and for the previous several years.
Realtor data suggest that the YOY decline in existing homes for sale was larger in January than in December, and I project that the NAR’s inventory estimate will be 1,650, unchanged from the preliminary December estimate and down 9.3% from last January. Finally, realtor data suggest that the median existing SF home sales price in January was up about 6.1% from last January.
CR Note: The NAR is scheduled to release January existing home sales on Wednesday, February 22nd. The consensus is the NAR will report sales of 5.55 million SAAR.


