 RSS Feed
 by Calculated Risk on 8/31/2016 06:19:00 PM
Wednesday, August 31, 2016
Thursday: Unemployment Claims, ISM Mfg Index, Construction Spending, Auto Sales
Thursday:
• At 8:30 AM ET, The initial weekly unemployment claims report will be released. The consensus is for 265 thousand initial claims, up from 261 thousand the previous week.
• At 10:00 AM, the ISM Manufacturing Index for August. The consensus is for the ISM to be at 52.2, down from 52.6 in July. The employment index was at 49.4% in July, and the new orders index was at 56.9%.
• Also at 10:00 AM, Construction Spending for July. The consensus is for a 0.6% increase in construction spending.
• All day, Light vehicle sales for August. The consensus is for light vehicle sales to decrease to 17.1 million SAAR in August, from 17.8 million in July (Seasonally Adjusted Annual Rate).
Restaurant Performance Index increased slightly in July
by Calculated Risk on 8/31/2016 01:15:00 PM
Here is a minor indicator I follow from the National Restaurant Association: RPI ticks up slightly
Although same-store sales and customer traffic levels remain somewhat uneven, the National Restaurant Association’s Restaurant Performance Index (RPI) registered a modest increase in July. The RPI stood at 100.6 in July, up 0.3 percent from June.
“The primary driver of the modest RPI gain in July was positive capital expenditure levels,” said Hudson Riehle, senior vice president of research for the National Restaurant Association.
“While there is some volatility among index components, especially when looking at the current situation, operators’ plans for capital expenditures six months out remain solid. This fits in with how operators’ outlook for the future remains overall positive despite general economic choppiness,” Riehle said.
emphasis added
 Click on graph for larger image.
The index increased to 100.6 in July, up from 100.3 in June. (above 100 indicates expansion).
Restaurant spending is discretionary, so even though this is "D-list" data, I like to check it every month.
NAR: Pending Home Sales Index increased 1.3% in July, up 1.4% year-over-year
by Calculated Risk on 8/31/2016 10:05:00 AM
From the NAR: Pending Home Sales Tick Up in July
Pending home sales expanded in most of the country in July and reached their second highest reading in over a decade, according to the National Association of Realtors®. Only the Midwest saw a dip in contract activity last month.This was above expectations of a 0.6% increase for this index. Note: Contract signings usually lead sales by about 45 to 60 days, so this would usually be for closed sales in August and September.
The Pending Home Sales Index, a forward-looking indicator based on contract signings, rose 1.3 percent to 111.3 in July from a downwardly revised 109.9 in June and is now 1.4 percent higher than July 2015 (109.8). The index is now at its second highest reading this year after April (115.0).
...
he PHSI in the Northeast moved up 0.8 percent to 96.8 in July, and is now 1.1 percent above a year ago. In the Midwest the index decreased 2.9 percent to 105.8 in July, and is now 1.1 percent lower than July 2015.
Pending home sales in the South inched higher (0.8 percent) to an index of 123.9 in July and are now 0.4 percent higher than last July. The index in the West surged 7.3 percent in July to 108.7, and is now 6.2 percent above a year ago.
emphasis added
ADP: Private Employment increased 177,000 in August
by Calculated Risk on 8/31/2016 08:19:00 AM
Private sector employment increased by 177,000 jobs from July to August according to the August ... The report, which is derived from ADP’s actual payroll data, measures the change in total nonfarm private employment each month on a seasonally-adjusted basis.This was close to the consensus forecast for 175,000 private sector jobs added in the ADP report.
...
Goods-producing employment was down by 6,000 jobs in August, following July losses of 5,000. The construction industry lost 2,000 jobs, following July losses of 5,000 jobs. Meanwhile, manufacturing jobs were flat in August, after gaining 5,000 in the previous month.
Service-providing employment rose by 183,000 jobs in August, fewer than July’s 199,000 jobs.
...
Mark Zandi, chief economist of Moody’s Analytics, said, “The American job machine continues to hum along. Job creation remains strong, with most industries and companies of all sizes adding solidly to their payrolls. The U.S. economy will soon be at full employment.”
The BLS report for August will be released Friday, and the consensus is for 175,000 non-farm payroll jobs added in August.
MBA: "Mortgage Applications Increase in Latest Weekly Survey"
by Calculated Risk on 8/31/2016 07:00:00 AM
From the MBA: Mortgage Applications Increase in Latest MBA Weekly Survey
Mortgage applications increased 2.8 percent from one week earlier, according to data from the Mortgage Bankers Association’s (MBA) Weekly Mortgage Applications Survey for the week ending August 26, 2016.
... The Refinance Index increased 4 percent from the previous week. The seasonally adjusted Purchase Index increased 1 percent from one week earlier. The unadjusted Purchase Index decreased 1 percent compared with the previous week and was 5 percent higher than the same week one year ago.
...
The average contract interest rate for 30-year fixed-rate mortgages with conforming loan balances ($417,000 or less) remained unchanged at 3.67 percent, with points decreasing to 0.33 from 0.34 (including the origination fee) for 80 percent loan-to-value ratio (LTV) loans.
emphasis added
 Click on graph for larger image.
The first graph shows the refinance index since 1990.
Refinance activity has increased this year since rates have declined.
However it would take another significant move down in mortgage rates to see a large increase in refinance activity.
 The second graph shows the MBA mortgage purchase index.
 The purchase index is "5 percent higher than the same week one year ago".
Tuesday, August 30, 2016
Wednesday: ADP employment, Pending Home Sales, Chicago PMI
by Calculated Risk on 8/30/2016 09:04:00 PM
Wednesday:
• At 7:00 AM ET, The Mortgage Bankers Association (MBA) will release the results for the mortgage purchase applications index.
• At 8:15 AM, The ADP Employment Report for August. This report is for private payrolls only (no government). The consensus is for 175,000 payroll jobs added in August, down from 179,000 added in July.
• At 9:45 AM, Chicago Purchasing Managers Index for August. The consensus is for a reading of 55.2, down from 55.8 in July.
• At 10:00 AM, Pending Home Sales Index for July. The consensus is for a 0.6% increase in the index.
Fannie Mae: Mortgage Serious Delinquency rate declined in July, Lowest since May 2008
by Calculated Risk on 8/30/2016 05:09:00 PM
Fannie Mae reported today that the Single-Family Serious Delinquency rate declined in July to 1.30%, down from 1.32% in June. The serious delinquency rate is down from 1.63% in July 2015.
These are mortgage loans that are "three monthly payments or more past due or in foreclosure".
This is the lowest rate since May 2008.
The Fannie Mae serious delinquency rate peaked in February 2010 at 5.59%.
 Click on graph for larger image
Although the rate is generally declining, the "normal" serious delinquency rate is under 1%.
The Fannie Mae serious delinquency rate has fallen 0.33 percentage points over the last year, and at that rate of improvement, the serious delinquency rate will not be below 1% until next summer.
Note: Freddie Mac reported last week.
FDIC: Fewer Problem banks, Residential REO Declined in Q2
by Calculated Risk on 8/30/2016 02:11:00 PM
The FDIC released the Quarterly Banking Profile for Q2 today:
Commercial banks and savings institutions insured by the Federal Deposit Insurance Corporation (FDIC) reported aggregate net income of $43.6 billion in the second quarter of 2016, up $584 million (1.4 percent) from a year earlier. The increase in earnings was mainly attributable to a $5.2 billion (4.8 percent) increase in net interest income and a $981 million decline in expenses for litigation reserves at a few large banks. Banks increased their loan-loss provisions by $3.6 billion (44.2 percent) compared to a year ago, partly in response to rising levels of troubled loans to commercial and industrial borrowers, particularly in the energy sector.
...
“Income and revenue both increased from a year ago, loan growth remained strong, the number of unprofitable banks was at an 18-year low, and there were fewer banks on the problem list. Community banks reported strong net income, revenue, and loan growth,” Chairman Gruenberg said.
“However, challenges continue,” he said. “Revenue growth remains sluggish as a prolonged period of low interest rates has put downward pressure on net interest margins. This has led some institutions to reach for yield, increasing their exposure to interest-rate risk.
“More recently, persistent stress in the energy sector has resulted in asset quality deterioration at banks that lend to oil and gas producers. We likely have not yet seen the full impact of low energy prices on the banking industry, particularly for consumer and commercial and industrial loans in energy-producing regions of the country.
“We will continue to closely monitor the environment in which banks operate, and we will remain vigilant as we conduct our supervision of the industry.”
...
“Problem List” Continues to Shrink: The number of banks on the FDIC’s Problem List fell from 165 to 147 during the second quarter. This is the smallest number of problem banks in more than seven years and is down significantly from the peak of 888 in the first quarter of 2011. Total assets of problem banks fell from $30.9 billion to $29.0 billion during the second quarter. Two banks failed during the quarter.
Deposit Insurance Fund’s Reserve Ratio Surpasses 1.15 Percent Benchmark: The DIF increased $2.8 billion during the second quarter, from $75.1 billion at the end of March to $77.9 billion at the end of June, largely driven by $2.3 billion in assessment income. The DIF reserve ratio rose from 1.13 percent to 1.17 percent during the quarter. Under previously approved FDIC regulations, once the reserve ratio exceeds 1.15 percent, lower regular assessment rates will go into effect. As a result of lower rates, the FDIC estimates that regular assessments paid by banks to the FDIC will decline by about one-third.
emphasis added
 Click on graph for larger image.
The FDIC reported the number of problem banks declined (Note: graph shows problem banks for Q1 and Q2 2016, and year end prior to 2016):
The number of FDIC-insured commercial banks and savings institutions reporting quarterly financial results declined to 6,058 from 6,122 in the second quarter. During the quarter, mergers absorbed 57 insured institutions, two banks failed, and no new charters were added. The number of banks on the FDIC’s “Problem List” declined from 165 to 147, and total assets of problem banks fell from $30.9 billion to $29 billion. This is the smallest number of problem banks in eight years
 The dollar value of 1-4 family residential Real Estate Owned (REOs, foreclosure houses) declined from $4.38 billion in Q1 2016 to $4.12 billion in Q2. This is the lowest level of REOs since Q1 2007.
This graph shows the nominal dollar value of Residential REO for FDIC insured institutions. Note: The FDIC reports the dollar value and not the total number of REOs.
Real Prices and Price-to-Rent Ratio in June
by Calculated Risk on 8/30/2016 11:40:00 AM
Here is the earlier post on Case-Shiller: Case-Shiller: National House Price Index increased 5.1% year-over-year in June
The year-over-year increase in prices is mostly moving sideways now around 5%. In June, the index was up 5.1% YoY.
In the earlier post, I graphed nominal house prices, but it is also important to look at prices in real terms (inflation adjusted). Case-Shiller, CoreLogic and others report nominal house prices. As an example, if a house price was $200,000 in January 2000, the price would be close to $275,000 today adjusted for inflation (37%). That is why the second graph below is important - this shows "real" prices (adjusted for inflation).
It has been almost ten years since the bubble peak. In the Case-Shiller release this morning, the National Index was reported as being 2.6% below the bubble peak. However, in real terms, the National index is still about 17.0% below the bubble peak.
Nominal House Prices
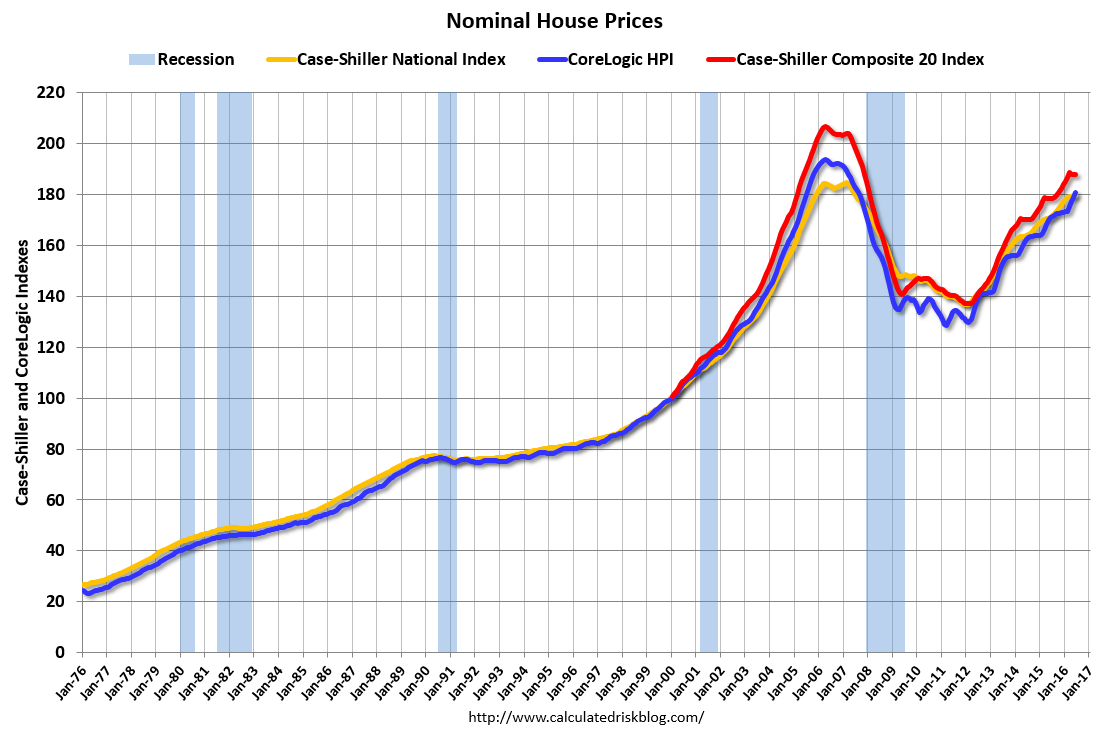 The first graph shows the monthly Case-Shiller National Index SA, the monthly Case-Shiller Composite 20 SA, and the CoreLogic House Price Indexes (through June) in nominal terms as reported.
In nominal terms, the Case-Shiller National index (SA) is back to November 2005 levels, and the Case-Shiller Composite 20 Index (SA) is back to June 2005 levels, and the CoreLogic index (NSA) is back to July 2005.
Real House Prices
 The second graph shows the same three indexes in real terms (adjusted for inflation using CPI less Shelter). Note: some people use other inflation measures to adjust for real prices.
CPI less Shelter has declined over the last two years pushing up real house prices.
In real terms, the National index is back to January 2004 levels, the Composite 20 index is back to October 2003, and the CoreLogic index back to November 2003.
In real terms, house prices are back to late 2003 levels.
Price-to-Rent
In October 2004, Fed economist John Krainer and researcher Chishen Wei wrote a Fed letter on price to rent ratios: House Prices and Fundamental Value. Kainer and Wei presented a price-to-rent ratio using the OFHEO house price index and the Owners' Equivalent Rent (OER) from the BLS.
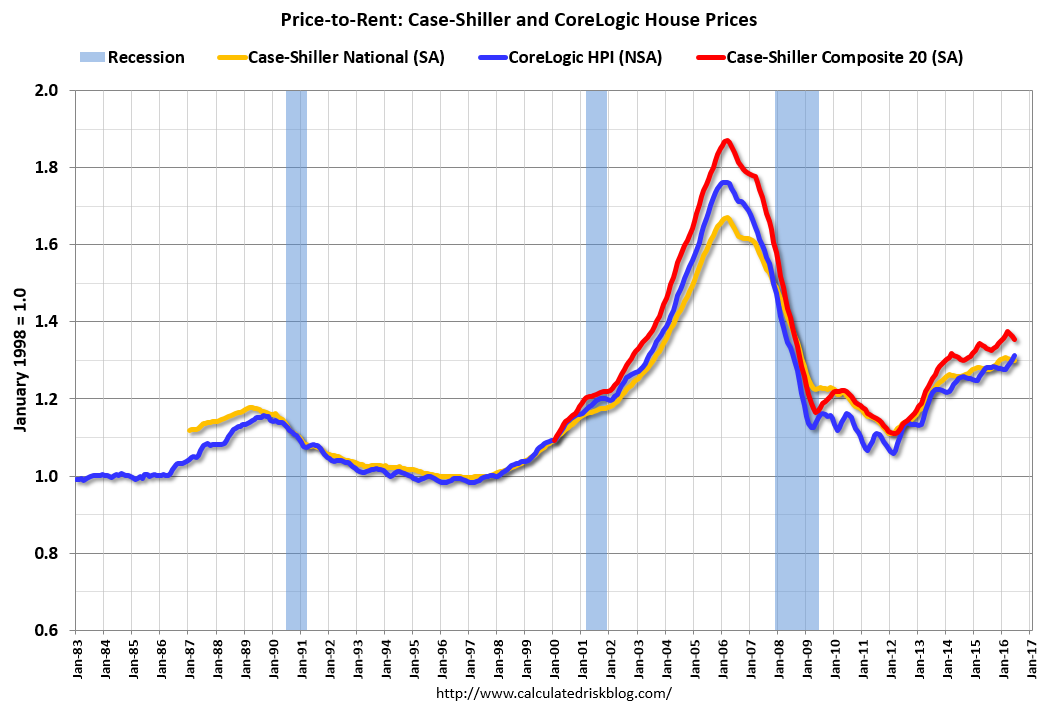 Here is a similar graph using the Case-Shiller National, Composite 20 and CoreLogic House Price Indexes.
This graph shows the price to rent ratio (January 1998 = 1.0).
On a price-to-rent basis, the Case-Shiller National index is back to July 2003 levels, the Composite 20 index is back to April 2003 levels, and the CoreLogic index is back to June 2003.
In real terms, and as a price-to-rent ratio, prices are back to late 2003 - and the price-to-rent ratio maybe moving a little more sideways now.
Case-Shiller: National House Price Index increased 5.1% year-over-year in June
by Calculated Risk on 8/30/2016 09:13:00 AM
S&P/Case-Shiller released the monthly Home Price Indices for June ("June" is a 3 month average of April, May and June prices).
This release includes prices for 20 individual cities, two composite indices (for 10 cities and 20 cities) and the monthly National index.
Note: Case-Shiller reports Not Seasonally Adjusted (NSA), I use the SA data for the graphs.
From S&P: Home Price Gains in June Concentrated in South and West According to the S&P CoreLogic Case-Shiller Indices
The S&P CoreLogic Case-Shiller U.S. National Home Price NSA Index, covering all nine U.S. census divisions, reported a 5.1% annual gain in June, unchanged from last month. The 10-City Composite posted a 4.3% annual increase, down from 4.4% the previous month.The 20-City Composite reported a year-over-year gain of 5.1%, down from 5.3% in May.
...
Before seasonal adjustment, the National Index posted a month-over-month gain of 1.0% while both the 10-City Composite and the 20-City Composite posted a 0.8% increase in June. After seasonal adjustment, the National Index recorded a 0.2% month-over-month increase, and both the 10-City Composite and 20-City Composite posted 0.1% month-over-month decreases. After seasonal adjustment, nine cities saw prices rise, two cities were unchanged, and nine cities experienced negative monthly prices changes.
emphasis added
 Click on graph for larger image.
 The first graph shows the nominal seasonally adjusted Composite 10, Composite 20 and National indices (the Composite 20 was started in January 2000).
The Composite 10 index is off 11.1% from the peak, and down 0.1% in June (SA).
The Composite 20 index is off 9.1% from the peak, and down 0.1% (SA) in June.
The National index is off 2.6% from the peak, and up 0.2% (SA) in June. The National index is up 31.6% from the post-bubble low set in December 2011 (SA).
 The second graph shows the Year over year change in all three indices.
The Composite 10 SA is up 4.3% compared to June 2015.
The Composite 20 SA is up 5.1% year-over-year.
The National index SA is up 5.1% year-over-year.
Note: According to the data, prices increased in 10 of 20 cities month-over-month seasonally adjusted.
I'll have more later.
Tuesday: Case-Shiller House Prices
by Calculated Risk on 8/30/2016 01:00:00 AM
Tuesday:
• At 9:00 AM ET, b>S&P/Case-Shiller House Price Index for June. Although this is the June report, it is really a 3 month average of April, May and June prices. The consensus is for a 5.2% year-over-year increase in the Comp 20 index for June. The Zillow forecast is for the National Index to increase 5.1% year-over-year in June.
From Matthew Graham at Mortgage News Daily: Mortgage Rates Battle Back From Recent Highs
Mortgage Rates were briefly at their highest levels in several weeks on Friday afternoon. This followed comments from the Fed's Jackson Hole symposium. Markets interpreted those comments as the Fed being more likely to hike rates in 2016--possibly even twice! While mortgage rates are based on MBS (mortgage-backed-securities), as opposed to the Fed Funds Rate (the thing the Fed is talking about hiking), if investors think the Fed is more likely to hike, MBS tend to lose some ground.
emphasis added
Monday, August 29, 2016
Lawler: Table of Distressed Sales and All Cash Sales for Selected Cities in July
by Calculated Risk on 8/29/2016 03:11:00 PM
Economist Tom Lawler sent me the table below of short sales, foreclosures and all cash sales for selected cities in July.
On distressed: Total "distressed" share is down year-over-year in all of these markets (except Springfield).
Short sales and foreclosures are down in all of these areas.
The All Cash Share (last two columns) is mostly declining year-over-year. As investors continue to pull back, the share of all cash buyers continues to decline.
| Short Sales Share | Foreclosure Sales Share | Total "Distressed" Share | All Cash Share | |||||
|---|---|---|---|---|---|---|---|---|
| July- 2016 | July- 2015 | July- 2016 | July- 2015 | July- 2016 | July- 2015 | July- 2016 | July- 2015 | |
| Las Vegas | 5.7% | 7.1% | 5.9% | 7.7% | 11.6% | 14.8% | 25.8% | 27.1% |
| Reno** | 3.0% | 3.0% | 1.0% | 2.0% | 4.0% | 5.0% | ||
| Phoenix | 1.6% | 2.8% | 2.2% | 3.4% | 3.8% | 6.3% | 19.7% | 21.9% |
| Sacramento | 2.6% | 4.7% | 2.1% | 4.6% | 4.7% | 9.3% | 14.4% | 18.1% |
| Minneapolis | 1.0% | 2.0% | 3.6% | 5.5% | 4.6% | 7.5% | 11.3% | 11.7% |
| Mid-Atlantic | 2.7% | 3.4% | 7.6% | 9.4% | 10.4% | 12.8% | 15.0% | 15.8% |
| So. California* | 4.9% | 7.1% | 19.6% | 21.6% | ||||
| Bay Area CA* | 3.2% | 4.7% | 18.6% | 20.1% | ||||
| Florida SF | 2.4% | 3.4% | 8.0% | 16.3% | 10.4% | 19.7% | 26.6% | 32.6% |
| Florida C/TH | 1.6% | 2.4% | 7.0% | 15.2% | 8.6% | 17.6% | 53.7% | 59.1% |
| Miami MSA SF | 3.8% | 5.1% | 9.5% | 16.5% | 13.4% | 21.6% | 27.9% | 31.8% |
| Miami MSA C/TH | 1.7% | 3.5% | 9.5% | 18.8% | 11.2% | 22.2% | 56.7% | 61.9% |
| Tampa MSA SF | 2.8% | 3.6% | 8.3% | 16.4% | 11.1% | 20.0% | 25.7% | 33.9% |
| Tampa MSA C/TH | 1.6% | 2.0% | 6.7% | 14.8% | 8.3% | 16.8% | 50.2% | 56.1% |
| Chicago (city) | 10.5% | 13.5% | ||||||
| Northeast Florida | 12.8% | 26.3% | ||||||
| Spokane | 5.7% | 9.1% | ||||||
| Tucson | 21.6% | 23.7% | ||||||
| Orlando | 28.4% | 34.5% | ||||||
| Toledo | 24.3% | 27.0% | ||||||
| S.C. Wisconsin | 14.4% | 15.2% | ||||||
| Knoxville | 20.6% | 21.8% | ||||||
| Peoria | 22.7% | 15.6% | ||||||
| Georgia*** | 18.5% | 20.3% | ||||||
| Omaha | 13.0% | 13.2% | ||||||
| Pensacola | 28.0% | 28.5% | ||||||
| Rhode Island | 7.8% | 8.8% | ||||||
| Richmond VA | 6.0% | 8.4% | 15.9% | 18.1% | ||||
| Memphis | 8.1% | 12.8% | ||||||
| Springfield IL** | 6.3% | 4.7% | ||||||
| *share of existing home sales, based on property records **Single Family Only ***GAMLS | ||||||||
Black Knight: House Price Index up 0.8% in June, Up 5.3% year-over-year
by Calculated Risk on 8/29/2016 12:53:00 PM
Note: I follow several house price indexes (Case-Shiller, CoreLogic, Black Knight, Zillow, FHFA, FNC and more). Note: Black Knight uses the current month closings only (not a three month average like Case-Shiller or a weighted average like CoreLogic), excludes short sales and REOs, and is not seasonally adjusted.
From Black Knight: Black Knight Home Price Index Report: June 2016 Transaction
• U.S. Home Prices Up 0.8 Percent for the Month; Up 5.3 Percent Year-Over-YearThe year-over-year increase in this index has been about the same for the last year.
• At $265K, the U.S. HPI is up 32.6 percent from the market's bottom and is within just 1.1 percent of a new national peak
• Home prices in six of the nation's 20 largest states and 14 of the 40 largest metros hit new peaks in June
Note that house prices are close to the bubble peak in nominal terms, but not adjusted for inflation.
Dallas Fed: Regional Manufacturing Activity Increases in August
by Calculated Risk on 8/29/2016 10:41:00 AM
From the Dallas Fed: Texas Manufacturing Activity Increases
Texas factory activity increased in August, according to business executives responding to the Texas Manufacturing Outlook Survey. The production index, a key measure of state manufacturing conditions, came in at 4.5 after a near-zero reading in July, suggesting output picked up this month.The impact of lower oil prices is still impacting manufacturing.
Other measures of current manufacturing activity also reflected expansion. Demand bounced back, with the new orders index rising from -8.0 to 5.3 in August and the growth rate of orders index pushing up to 2.1, its first positive reading in nearly two years. The capacity utilization index remained only barely positive at 0.9, while the shipments index rose nearly 10 points to 9.9, with nearly a third of manufacturers reporting higher volumes of shipments this month.
Perceptions of broader business conditions remained fairly pessimistic. The general business activity index was negative for a 20th month in a row and moved down from -1.3 to -6.2. The company outlook index was largely unchanged at -2.8.
Labor market measures indicated slight employment declines and shorter workweek length. The employment index came in at -5.0, down from -2.6 last month. ...
emphasis added
This was the last of the regional Fed surveys for August.
Here is a graph comparing the regional Fed surveys and the ISM manufacturing index:
 Click on graph for larger image.
The New York and Philly Fed surveys are averaged together (yellow, through August), and five Fed surveys are averaged (blue, through August) including New York, Philly, Richmond, Dallas and Kansas City. The Institute for Supply Management (ISM) PMI (red) is through July (right axis).
It seems likely the ISM manufacturing index will be lower in August than in July.
Personal Income increased 0.4% in July, Spending increased 0.3%
by Calculated Risk on 8/29/2016 08:41:00 AM
The BEA released the Personal Income and Outlays report for July:
Personal income increased $71.6 billion (0.4 percent) in July according to estimates released today by the Bureau of Economic Analysis ... personal consumption expenditures (PCE) increased $42.0 billion (0.3 percent).The July PCE price index increased 0.8 percent year-over-year and the July PCE price index, excluding food and energy, increased 1.6 percent year-over-year.
...
Real PCE increased 0.3 percent. The PCE price index was unchanged from June. Excluding food and energy, the PCE price index increased 0.1 percent in July.
The following graph shows real Personal Consumption Expenditures (PCE) through July 2016 (2009 dollars). Note that the y-axis doesn't start at zero to better show the change.
 Click on graph for larger image.
The dashed red lines are the quarterly levels for real PCE.
Both the increase in personal income and the increase in PCE was at consensus expectations.
A solid start for Q3.
Sunday, August 28, 2016
Monday: Personal Income and Outlays
by Calculated Risk on 8/28/2016 08:02:00 PM
Weekend:
• Schedule for Week of Aug 28, 2016
Monday:
• At 8:30 AM ET, Personal Income and Outlays for July. The consensus is for a 0.4% increase in personal income, and for a 0.3% increase in personal spending. And for the Core PCE price index to increase 0.1%.
• At 10:30 AM, Dallas Fed Survey of Manufacturing Activity for August.
From CNBC: Pre-Market Data and Bloomberg futures: S&P and DOW futures are mostly unchanged (fair value).
Oil prices were down over the last week with WTI futures at $47.14 per barrel and Brent at $49.46 per barrel. A year ago, WTI was at $45, and Brent was at $48 - so prices are mostly unchanged year-over-year.
Here is a graph from Gasbuddy.com for nationwide gasoline prices. Nationally prices are at $2.21 per gallon (down about $0.30 per gallon from a year ago).
Freddie Mac: Mortgage Serious Delinquency rate unchanged in July
by Calculated Risk on 8/28/2016 10:33:00 AM
Freddie Mac reported that the Single-Family serious delinquency rate was unchanged in July at 1.08%, the same as in June. Freddie's rate is down from 1.48% in July 2015.
This ties the lowest rate since July 2008.
Freddie's serious delinquency rate peaked in February 2010 at 4.20%.
These are mortgage loans that are "three monthly payments or more past due or in foreclosure".
 Click on graph for larger image
Although the rate is generally declining, the "normal" serious delinquency rate is under 1%.
The Freddie Mac serious delinquency rate has fallen 0.40 percentage points over the last year, and at that rate of improvement, the serious delinquency rate will be below 1% in two or three months.
Note: Fannie Mae will report in the next few days.
Saturday, August 27, 2016
Schedule for Week of Aug 28, 2016
by Calculated Risk on 8/27/2016 08:09:00 AM
The key report this week is the August employment report on Friday.
Other key indicators include Personal Income and Outlays for July, the Case-Shiller House Price Index for June, the August ISM manufacturing and non-manufacturing indexes, August auto sales, and the July trade deficit.
8:30 AM: Personal Income and Outlays for July. The consensus is for a 0.4% increase in personal income, and for a 0.3% increase in personal spending. And for the Core PCE price index to increase 0.1%.
10:30 AM ET: Dallas Fed Survey of Manufacturing Activity for August.
 9:00 AM: S&P/Case-Shiller House Price Index for June. Although this is the June report, it is really a 3 month average of April, May and June prices.
This graph shows the nominal seasonally adjusted National Index, Composite 10 and Composite 20 indexes through the May 2016 report (the Composite 20 was started in January 2000).
The consensus is for a 5.2% year-over-year increase in the Comp 20 index for June. The Zillow forecast is for the National Index to increase 5.1% year-over-year in June.
7:00 AM ET: The Mortgage Bankers Association (MBA) will release the results for the mortgage purchase applications index.
8:15 AM: The ADP Employment Report for August. This report is for private payrolls only (no government). The consensus is for 175,000 payroll jobs added in August, down from 179,000 added in July.
9:45 AM: Chicago Purchasing Managers Index for August. The consensus is for a reading of 55.2, down from 55.8 in July.
10:00 AM: Pending Home Sales Index for July. The consensus is for a 0.6% increase in the index.
8:30 AM ET: The initial weekly unemployment claims report will be released. The consensus is for 265 thousand initial claims, up from 261 thousand the previous week.
 10:00 AM: ISM Manufacturing Index for August. The consensus is for the ISM to be at 52.2, down from 52.6 in July.
Here is a long term graph of the ISM manufacturing index.
The ISM manufacturing index indicated expansion at 52.6% in July. The employment index was at 49.4%, and the new orders index was at 56.9%.
10:00 AM: Construction Spending for July. The consensus is for a 0.6% increase in construction spending.
 All day: Light vehicle sales for August. The consensus is for light vehicle sales to decrease to 17.1 million SAAR in August, from 17.8 million in July (Seasonally Adjusted Annual Rate).
This graph shows light vehicle sales since the BEA started keeping data in 1967. The dashed line is the July sales rate.
8:30 AM: Employment Report for August. The consensus is for an increase of 175,000 non-farm payroll jobs added in August, down from the 255,000 non-farm payroll jobs added in July.
The consensus is for the unemployment rate to decrease to 4.8%.
 This graph shows the year-over-year change in total non-farm employment since 1968.
In July, the year-over-year change was 2.45 million jobs.
A key will be the change in wages.
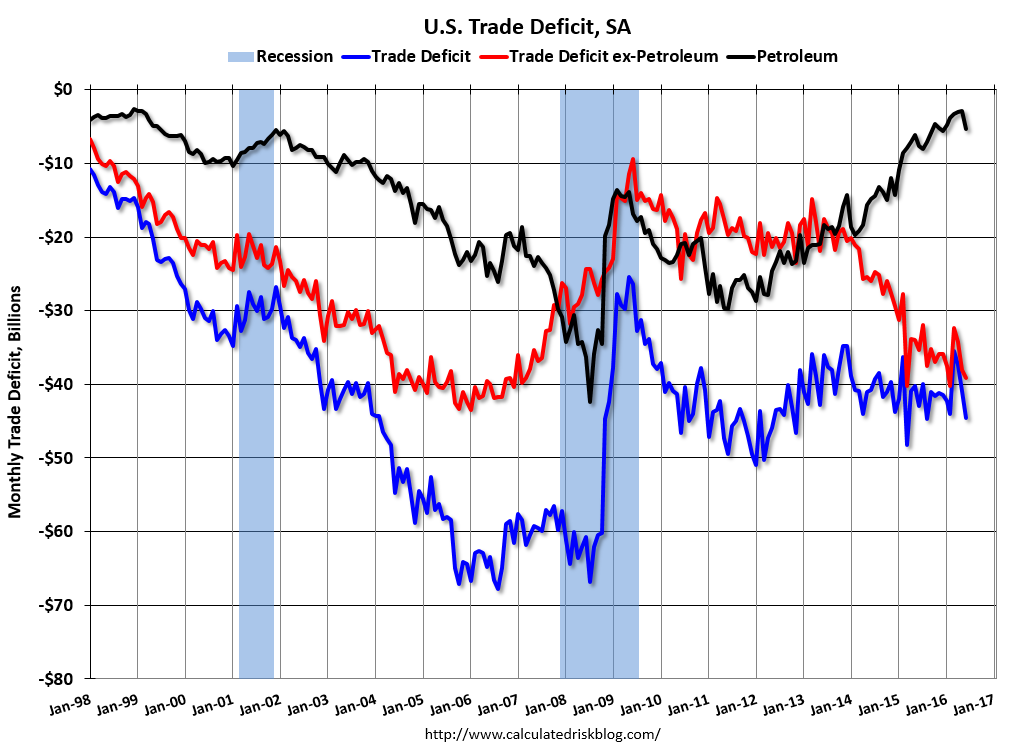 8:30 AM: Trade Balance report for July from the Census Bureau.
 This graph shows the U.S. trade deficit, with and without petroleum, through June. The blue line is the total deficit, and the black line is the petroleum deficit, and the red line is the trade deficit ex-petroleum products.
The consensus is for the U.S. trade deficit to be at $41.3 billion in July from $44.5 billion in June.
10:00 AM: Manufacturers' Shipments, Inventories and Orders (Factory Orders) for July. The consensus is a 2.0% increase in orders.
Friday, August 26, 2016
August 2016: Unofficial Problem Bank list declines to 184 Institutions
by Calculated Risk on 8/26/2016 07:49:00 PM
This is an unofficial list of Problem Banks compiled only from public sources.
Here is the unofficial problem bank list for August 2016.
Changes and comments from surferdude808:
Update on the Unofficial Problem Bank List for August 2016. During the month, the list declined by a net 12 institutions from 196 to 184. The net change of 12 institutions results from 14 removals and two additions. Assets dropped by $2.3 billion to an aggregate $56.5 billion, with $350 million of the decline coming from updated figures for the second quarter. A year ago, the list held 282 institutions with assets of $82.7 billion. This week, we were anticipating for the FDIC to release second quarter industry results and an update on the Official Problem Bank List, but that will have to wait until next month's update.
Actions have been terminated against SpiritBank, Tulsa, OK ($767 million); Tennessee State Bank, Pigeon Forge, TN ($641 million); First American State Bank, Greenwood Village, CO ($279 million); First National Bank, Camdenton, MO ($206 million); Cornerstone Bank, Overland Park, KS ($159 million); Friends Bank, New Smyrna Beach, FL ($104 million Ticker: FRIE); New Jersey Community Bank, Freehold, NJ ($103 million); GSL Savings Bank, Guttenberg, NJ ($91 million); RepublicBankAZ, N.A., Phoenix, AZ ($90 million); and FirstSecure Bank and Trust Co., Palos Hills, IL ($61 million).
Several banks merged to find their way off the problem bank list including Hopkins Federal Savings Bank, Baltimore, MD ($229 million); Harvard Savings Bank, Harvard, IL ($142 million); and The Bank of Oswego, Lake Oswego, OR ($61 million).
In the very hard to believe category, another bank headquartered in Georgia -- The Woodbury Banking Company, Woodbury, GA ($22 million) – found its way off the list through failure. Since the on-set of the Great Recession, 91 institutions headquartered in Georgia have failed. Of the 352 institutions open at year-end 2007 in Georgia, 91 or nearly 26 percent have failed, which is more than four times the national failure rate of 6 percent. It begs the question, how is it possible for there to be any banks left in the state that could fail.
Nationwide, since the on-set of the Great Recession, 533 institutions with assets of nearly $4 trillion have failed or received open-bank assistance. To put this in context, there were 8,544 institutions with assets of $13.1 trillion open in the U.S. at year-end 2007. Thus, 6.2 percent of institutions that held 30.3 percent of assets have failed or received open-bank assistance. In comparison, from 1980 through 1994, a period most consider as the most severe banking crisis since the Great Depression, 9.1% of institutions holding nearly 9.0% of assets failed or received open-bank assistance. So while the failure rate is lower in this episode, the share of assets is significantly greater. In the 1990s, the FDIC produced comprehensive research (“History of the Eighties”) to understand the causes of that crisis and identify ways to limit a future crisis. In response, FDIC Chairman Ricki Helfer spearheaded the formation of a new division to identify emerging systemic risks in the industry. In a 1996 speech, FDIC Chairman Helfer said “Neither we nor the industry we supervise can afford being so wrong again. The speed of technology and the rapid innovations in the marketplace mean that trouble could come quickly and in large numbers. We need to avoid being that wrong again by monitoring trends more broadly and taking specific action on the information we receive.” But somehow the FDIC’s division designed specifically to identify a widespread banking crisis got it way wrong. The lack of a major research effort by the FDIC to understand what went wrong in this current episode should be concerning to all industry observers.
Vehicle Sales Forecast: Sales to Weaken in August, Still Around 17 Million SAAR
by Calculated Risk on 8/26/2016 03:40:00 PM
The automakers will report August vehicle sales on Thursday, Sept 1st.
Note: There were 26 selling days in August, the same as in August 2015.
From WardsAuto: Forecast: U.S. Light Vehicles Sales Weaken in August
A WardsAuto forecast calls for August U.S. light-vehicle sales to reach a 17.4 million-unit seasonally adjusted annual rate, less than like-2015’s 17.7 million and July’s 17.8 million, but ahead of the 17.2 million recorded over the first seven months of this year.From J.D. Power: August Decline in New-Vehicle Sales Fourth in Last Six Months
emphasis added
The SAAR for total sales is projected at 16.8 million units in August 2016, down from 17.7 million units a year ago.Vehicle sales are moving more sideways now.
Comments on Home Sales in July
by Calculated Risk on 8/26/2016 11:59:00 AM
CR Note: When the New and Existing home sales reports were released this week, I was out of town and didn't post any graphs. Here are a few graphs and comments on the reports.
The new home sales report for July was very strong at 654,000 on a seasonally adjusted annual rate basis (SAAR) - the highest since October 2007 - however combined sales for April, May and June were revised down by 12 thousand SAAR.
Sales were up 31.3% year-over-year (YoY) compared to July 2015. And sales are up 12.4% year-to-date compared to the same period in 2015.
 Click on graph for larger image.
The first graph shows New Home Sales vs. recessions since 1963. The dashed line is the current sales rate.
As always, I wouldn't read too much into data for any one month - this series is volatile and the revisions are frequently significant.
However it does appear new home sales are approaching normal levels (I've been expecting sales to increase to at least 800 thousand - but I expected the recovery to be slow).
 The second graph shows new home sales for 2015 and 2016 by month (Seasonally Adjusted Annual Rate). Sales to date are up 12.4% year-over-year, mostly because of the solid growth starting in Q2.
There will probably be solid year-over-year growth in Q3 this year too.
Overall I expected lower growth this year, in the 4% to 8% range. Slower growth seemed likely this year because Houston (and other oil producing areas) will have a problem this year.
So far new home sales have been stronger than my forecast.
 The third graph shows existing home sales, on a Seasonally Adjusted Annual Rate (SAAR) basis since 1993.
Sales in July (5.39 million SAAR) were 3.2% lower than last month, and were 1.6% below the July 2015 rate.
For existing homes, inventory is still key. I expected some increase in inventory last year, but that didn't happened. Inventory is still very low and falling year-over-year (down 5.8% year-over-year in June). More inventory would probably mean smaller price increases and slightly higher sales, and less inventory means lower sales and somewhat larger price increases.
Two of the key reasons inventory is low: 1) A large number of single family home and condos were converted to rental units. Last year, housing economist Tom Lawler estimated there were 17.5 million renter occupied single family homes in the U.S., up from 10.7 million in 2000. Many of these houses were purchased by investors, and rents have increased substantially, and the investors are not selling (even though prices have increased too). Most of these rental conversions were at the lower end, and that is limiting the supply for first time buyers. 2) Baby boomers are aging in place (people tend to downsize when they are 75 or 80, in another 10 to 20 years for the boomers). Instead we are seeing a surge in home improvement spending, and this is also limiting supply.
And here is another update to the "distressing gap" graph that I first started posting a number of years ago to show the emerging gap caused by distressed sales. Now I'm looking for the gap to close over the next several years.
 The "distressing gap" graph shows existing home sales (left axis) and new home sales (right axis) through July 2016. This graph starts in 1994, but the relationship had been fairly steady back to the '60s.
Following the housing bubble and bust, the "distressing gap" appeared mostly because of distressed sales.
I expect existing home sales to move more sideways, and I expect this gap to slowly close, mostly from an increase in new home sales.
However, this assumes that the builders will offer some smaller, less expensive homes. If not, then the gap will persist.
 Another way to look at this is a ratio of existing to new home sales.
This ratio was fairly stable from 1994 through 2006, and then the flood of distressed sales kept the number of existing home sales elevated and depressed new home sales. (Note: This ratio was fairly stable back to the early '70s, but I only have annual data for the earlier years).
In general the ratio has been trending down, and this ratio will probably continue to trend down over the next several years.
Note: Existing home sales are counted when transactions are closed, and new home sales are counted when contracts are signed. So the timing of sales is different.
Yellen: "Case for an increase in the federal funds rate has strengthened"
by Calculated Risk on 8/26/2016 10:09:00 AM
From Fed Chair Janet Yellen: The Federal Reserve's Monetary Policy Toolkit: Past, Present, and Future. Excerpt:
Looking ahead, the FOMC expects moderate growth in real gross domestic product (GDP), additional strengthening in the labor market, and inflation rising to 2 percent over the next few years. Based on this economic outlook, the FOMC continues to anticipate that gradual increases in the federal funds rate will be appropriate over time to achieve and sustain employment and inflation near our statutory objectives. Indeed, in light of the continued solid performance of the labor market and our outlook for economic activity and inflation, I believe the case for an increase in the federal funds rate has strengthened in recent months. Of course, our decisions always depend on the degree to which incoming data continues to confirm the Committee's outlook.
...
And, as ever, the economic outlook is uncertain, and so monetary policy is not on a preset course. Our ability to predict how the federal funds rate will evolve over time is quite limited because monetary policy will need to respond to whatever disturbances may buffet the economy. In addition, the level of short-term interest rates consistent with the dual mandate varies over time in response to shifts in underlying economic conditions that are often evident only in hindsight. For these reasons, the range of reasonably likely outcomes for the federal funds rate is quite wide ...
emphasis added
Q2 GDP Revised Down to 1.1% Annual Rate
by Calculated Risk on 8/26/2016 08:33:00 AM
From the BEA: Gross Domestic Product: Second Quarter 2016 (Second Estimate)
Real gross domestic product increased at an annual rate of 1.1 percent in the second quarter of 2016, according to the "second" estimate released by the Bureau of Economic Analysis. In the first quarter, real GDP increased 0.8 percent.Here is a Comparison of Second and Advance Estimates. PCE growth was revised up from 4.2% to 4.4%. (Solid PCE). Residential investment was revised down from -6.1% to -7.7%. This was close to the consensus forecast.
The GDP estimate released today is based on more complete source data than were available for the "advance" estimate issued last month. In the advance estimate, the increase in real GDP was 1.2 percent. With this second estimate for the second quarter, the general picture of economic growth remains the same; revisions to the components of GDP are small ...
emphasis added
Thursday, August 25, 2016
Friday: Yellen, GDP
by Calculated Risk on 8/25/2016 08:32:00 PM
Yellen time updated (ht SBG)
CR Note: It was an awesome trip, but it is great to be home. I'll be posting some catch-up graphs and comments on new and existing home sales tomorrow. Best to All.
Friday:
• At 8:30 AM ET, Gross Domestic Product, 2nd quarter 2016 (Second estimate). The consensus is that real GDP increased 1.1% annualized in Q2, down from 1.2% in the advance estimate.
• At 10:00 AM, Fed Chair Janet Yellen will speak at the annual economic symposium in Jackson Hole, Wyoming. The symposium topic is “Designing Resilient Monetary Policy Frameworks for the Future”.
• At 10:00 AM, University of Michigan's Consumer sentiment index (final for August). The consensus is for a reading of 90.5, up from the preliminary reading 90.4.
Back in Town, Earlier: Weekly Initial Unemployment Claims decreased to 262,000
by Calculated Risk on 8/25/2016 05:39:00 PM
CR Note: I'm back from NYC. Had a great time!
The DOL reported:
In the week ending August 20, the advance figure for seasonally adjusted initial claims was 261,000, a decrease of 1,000 from the previous week's unrevised level of 262,000. The 4-week moving average was 264,000, a decrease of 1,250 from the previous week's unrevised average of 265,250.The previous week was unrevised.
There were no special factors impacting this week's initial claims. This marks 77 consecutive weeks of initial claims below 300,000, the longest streak since 1970.
The following graph shows the 4-week moving average of weekly claims since 1971.
 Click on graph for larger image.
The dashed line on the graph is the current 4-week average. The four-week average of weekly unemployment claims decreased to 264,000.
This was lower than the consensus forecast of 265,000. The low level of claims suggests relatively few layoffs.
Wednesday, August 24, 2016
Thursday: Travel Day
by Calculated Risk on 8/24/2016 06:40:00 PM
As a reminder: NAR Existing Home Sales Report vs. Tom Lawler's LEHC Projection from Last Week
Existing Home Sales (SAAR): NAR, 5.39 million; LEHC, 5.41 million; “Consensus”, 5.52 million
Inventory of EHS for Sale: NAR, 2.13 million; LEHC, 2.14 million.
YOY % Change, Median Existing SF Home Sales Price: NAR, 5.4%; LEHC, 5.3%.
Note: Thursday is a travel day - no posting until later in the day.
Thursday:
At 8:30 AM ET, The initial weekly unemployment claims report will be released. The consensus is for 265 thousand initial claims, up from 262 thousand the previous week.
Also at 8:30 AM, Durable Goods Orders for June from the Census Bureau. The consensus is for a 3.7% increase in durable goods orders.
At 11:00 AM, Kansas City Fed Survey of Manufacturing Activity for August.
Existing Home Sales decline in July to 5.39 million SAAR
by Calculated Risk on 8/24/2016 10:06:00 AM
CR Note: I'm in NYC and I will post graphs when I return home.
From the NAR: Existing-Home Sales Lose Steam in July
Total existing-home sales, which are completed transactions that include single-family homes, townhomes, condominiums and co-ops, fell 3.2 percent to a seasonally adjusted annual rate of 5.39 million in July from 5.57 million in June. For only the second time in the last 21 months 2, sales are now below (1.6 percent) a year ago (5.48 million).Sales in July (5.39 million SAAR) were 3.2% lower than last month, and were 1.6% below the July 2015 rate.
Total housing inventory at the end of July inched 0.9 percent higher to 2.13 million existing homes available for sale, but is still 5.8 percent lower than a year ago (2.26 million) and has now declined year-over-year for 14 straight months. Unsold inventory is at a 4.7-month supply at the current sales pace, which is up from 4.5 months in June.
According to the NAR, inventory increased to 2.13 million in July from 2.11 million in June. Headline inventory is not seasonally adjusted, and inventory usually decreases to the seasonal lows in December and January, and peaks in mid-to-late summer.
Inventory decreased 5.8% year-over-year in July compared to July 2015.
Months of supply was at 4.7 months in July.
This was below consensus expectations (but not a surprise for CR readers). For existing home sales, a key number is inventory - and inventory is still low. I'll have more after I return home.
MBA: "Mortgage Applications Decrease in Latest Weekly Survey"
by Calculated Risk on 8/24/2016 07:00:00 AM
CR Note: I'm in NYC, graphs will be posted next week.
From the MBA: Mortgage Applications Decrease in Latest MBA Weekly Survey
Mortgage applications decreased 2.1 percent from one week earlier, according to data from the Mortgage Bankers Association’s (MBA) Weekly Mortgage Applications Survey for the week ending August 19, 2016.
... The Refinance Index decreased 3 percent from the previous week. The seasonally adjusted Purchase Index decreased 0.3 percent from one week earlier. The unadjusted Purchase Index decreased 2 percent compared with the previous week and was 8 percent higher than the same week one year ago.
...
The average contract interest rate for 30-year fixed-rate mortgages with conforming loan balances ($417,000 or less) increased to 3.67 percent from 3.64 percent, with points increasing to 0.34 from 0.31 (including the origination fee) for 80 percent loan-to-value ratio (LTV) loans.
emphasis added
Tuesday, August 23, 2016
Wednesday: Existing Home Sales
by Calculated Risk on 8/23/2016 05:54:00 PM
Note: I'm in New York and posting will not be frequent (too much to do and see).
Thanks to Joe Weisenthal for having me on Bloomberg's WDYM. And Barry Ritholtz on his MIB radio and podcast.
Wednesday:
At 7:00 AM ET, The Mortgage Bankers Association (MBA) will release the results for the mortgage purchase applications index.
At 9:00 AM, FHFA House Price Index for June 2016. This was originally a GSE only repeat sales, however there is also an expanded index. The consensus is for a 0.3% month-to-month increase for this index.
At 10:00 AM, Existing Home Sales for July from the National Association of Realtors (NAR). The consensus is for 5.52 million SAAR, down from 5.57 million in June.
Housing economist Tom Lawler expects the NAR to report sales of 5.41 million SAAR in July, down 2.9% from June’s preliminary pace.
Hint: Lawler isn't always closer, but I'd take the under on the consensus Wednesday.
Chemical Activity Barometer "Suggests Accelerated Business Activity"
by Calculated Risk on 8/23/2016 02:59:00 PM
Here is an indicator that I'm following that appears to be a leading indicator for industrial production.
From the American Chemistry Council: Chemical Activity Barometer Suggests Accelerated Business Activity; Notches Sixth Consecutive Gain
The Chemical Activity Barometer (CAB), a leading economic indicator created by the American Chemistry Council (ACC), expanded 0.4 percent in August following an upward revision for July. This marks the barometer’s sixth consecutive monthly gain. Accounting for adjustments, the CAB is up 3.2 percent over this time last year, the strongest year over year growth since January 2015. All data is measured on a three-month moving average (3MMA). On an unadjusted basis the CAB climbed 0.3 percent in August, following a 0.6 percent jump in July.Currently CAB has increased over the last three months, and this suggests an increase in Industrial Production over the next year.
"The CAB is signaling higher, and possibly accelerating, U.S. business activity into 2017. The services sectors have begun to improve and likely accelerated during recent months, and manufacturing appears to be gathering momentum," said ACC’s Chief Economist Kevin Swift.
emphasis added
New Home Sales increased to 654,000 Annual Rate in July, Highest since October 2007
by Calculated Risk on 8/23/2016 10:10:00 AM
CR Note: I'm in NYC for a few days and having a great time. Sorry - no graphs until I return home.
The Census Bureau reports New Home Sales in July were at a seasonally adjusted annual rate (SAAR) of 654 thousand.
The previous three months were revised down by a total of 12 thousand (SAAR).
"Sales of new single-family houses in July 2016 were at a seasonally adjusted annual rate of 654,000, according to estimates released jointly today by the U.S. Census Bureau and the Department of Housing and Urban Development. This is 12.4 percent (±12.7%)* above the revised June rate of 582,000 and is 31.3 percent (±19.9%) above the July 2015 estimate of 498,000."The months of supply decreased in July to 4.3 months.
emphasis added
The all time record was 12.1 months of supply in January 2009.
This is now in the normal range (less than 6 months supply is normal).
"The seasonally adjusted estimate of new houses for sale at the end of July was 233,000. This represents a supply of 4.3 months at the current sales rate"This was well above expectations of 580,000 sales SAAR in July. This was a strong report. I'll have more later this week when I return home.
Monday, August 22, 2016
Tuesday: New Home Sales, Richmond Fed Manufacturing Survey
by Calculated Risk on 8/22/2016 04:52:00 PM
Note: I'm in New York and posting will not be frequent (too much to do and see).
Tuesday:
• At 10:00 AM ET, New Home Sales for July from the Census Bureau. The consensus is for a decrease in sale to 580 thousand SAAR in July from 592 thousand in June.
• Also at 10:00 AM, Richmond Fed Survey of Manufacturing Activity for August.
Black Knight's First Look at July Mortgage Data
by Calculated Risk on 8/22/2016 08:17:00 AM
CR Note: The month-to-month increase in delinquencies is mostly seasonal (happens every July). I'm in NYC, and posting will be intermittent. Best to all.
From Black Knight: Black Knight Financial Services’ First Look at July Mortgage Data: Delinquencies Continue Seasonal Climb; Prepayments Defy Historically Low Interest Rates, Growing Refinanceable Population
JACKSONVILLE, Fla. – Aug. 22, 2016 -- The Data & Analytics division of Black Knight Financial Services, Inc. (NYSE: BKFS) reports the following “first look” at July 2016 month-end mortgage performance statistics derived from its loan-level database representing the majority of the national mortgage market.
Total U.S. loan delinquency rate (loans 30 or more days past due, but not in foreclosure): 4.51% Month-over-month change: 4.78% Year-over-year change: -3.38%
Total U.S. foreclosure pre-sale inventory rate: 1.09% Month-over-month change: -1.68% Year-over-year change: -28.36%
Total U.S. foreclosure starts: 61,300 Month-over-month change: -11.54% Year-over-year change: -14.27%
Monthly Prepayment Rate (SMM): 1.26% Month-over-month change: -11.98% Year-over-year change: -1.00%
Foreclosure Sales as % of 90+: 1.99% Month-over-month change: -13.65% Year-over-year change: 1.05%
Number of properties that are 30 or more days past due, but not in foreclosure: 2,286,000 Month-over-month change: 108,000 Year-over-year change: -70,000
Number of properties that are 90 or more days past due, but not in foreclosure: 695,000 Month-over-month change: 3,000 Year-over-year change: -147,000
Number of properties in foreclosure pre-sale inventory: 550,000 Month-over-month change: -8,000 Year-over-year change: -214,000
Number of properties that are 30 or more days past due or in foreclosure: 2,836,000 Month-over-month change: 100,000 Year-over-year change: -284,000Ca
Sunday, August 21, 2016
Sunday Night Futures
by Calculated Risk on 8/21/2016 07:15:00 PM
Weekend:
• Schedule for Week of Aug 21, 2016
Monday:
• At 8:30 AM ET, Chicago Fed National Activity Index for July. This is a composite index of other data.
From CNBC: Pre-Market Data and Bloomberg futures: S&P and DOW futures are up slightly (fair value).
Oil prices were up over the last week with WTI futures at $48.11 per barrel and Brent at $50.88 per barrel. A year ago, WTI was at $40, and Brent was at $44 - so prices are up 15% or so year-over-year. Yes, UP year-over-year.
Here is a graph from Gasbuddy.com for nationwide gasoline prices. Nationally prices are at $2.16 per gallon (down about $0.50 per gallon from a year ago).
Horizontal Rig Counts increase slightly
by Calculated Risk on 8/21/2016 10:07:00 AM
Note: I'm in the Boston area (Wonderful wedding last night). Off to New York soon ...
A few comments from Steven Kopits of Princeton Energy Advisors LLC:
"US horizontal oil rigs gained 4 to 318.CR Note: This is horizontal rig count only (not vertical).
...
The takeaway: At $45 WTI, the Bakken, Eagle Ford and Niobrara are more or less able to hold rig counts steady, but not more. However, the Permian looks entirely viable at this number, with 20 rigs added even with WTI in the $40-45 range. "
Saturday, August 20, 2016
Schedule for Week of Aug 21, 2016
by Calculated Risk on 8/20/2016 08:15:00 AM
The key economic reports this week are July New and Existing Home Sales.
Also the second estimate of Q2 GDP will be released.
Fed Chair Janet Yellen is scheduled to speak at the Jackson Hole annual economic symposium.
For manufacturing, the August Richmond and Kansas City manufacturing surveys will be released this week.
8:30 AM ET: Chicago Fed National Activity Index for July. This is a composite index of other data.
 10:00 AM ET: New Home Sales for July from the Census Bureau.
 This graph shows New Home Sales since 1963. The dashed line is the June sales rate.
The consensus is for an decrease in sales to 580 thousand Seasonally Adjusted Annual Rate (SAAR) in July from 592 thousand in June.
10:00 AM: Richmond Fed Survey of Manufacturing Activity for August.
7:00 AM ET: The Mortgage Bankers Association (MBA) will release the results for the mortgage purchase applications index.
9:00 AM: FHFA House Price Index for June 2016. This was originally a GSE only repeat sales, however there is also an expanded index. The consensus is for a 0.3% month-to-month increase for this index.
 10:00 AM: Existing Home Sales for July from the National Association of Realtors (NAR). The consensus is for 5.52 million SAAR, down from 5.57 million in June.
Housing economist Tom Lawler expects the NAR to report sales of 5.41 million SAAR in July, down 2.9% from June’s preliminary pace.
8:30 AM ET: The initial weekly unemployment claims report will be released. The consensus is for 265 thousand initial claims, up from 262 thousand the previous week.
8:30 AM: Durable Goods Orders for June from the Census Bureau. The consensus is for a 3.7% increase in durable goods orders.
11:00 AM: Kansas City Fed Survey of Manufacturing Activity for August.
8:30 AM ET: Gross Domestic Product, 2nd quarter 2016 (Second estimate). The consensus is that real GDP increased 1.1% annualized in Q2, down from 1.2% in the advance estimate.
10:00 AM: University of Michigan's Consumer sentiment index (final for August). The consensus is for a reading of 90.5, up from the preliminary reading 90.4.
11:00 AM: Fed Chair Janet Yellen will speak at the annual economic symposium in Jackson Hole, Wyoming. The symposium topic is “Designing Resilient Monetary Policy Frameworks for the Future”.
Friday, August 19, 2016
2007: Tanta Changed the Blogging World
by Calculated Risk on 8/19/2016 04:11:00 PM
Note: I'm flying to Boston today to attend a wedding this weekend. There will be a few posts on Tanta today.
Every finance and economics blogger owes Tanta a debt of gratitude. Before Tanta wrote the following essay, newspapers would "borrow" ideas and subjects from bloggers, and never mention the source. In March 2007 - with a powerful essay - she changed the way the main street media treated bloggers.
In the week following publication of this piece, Tanta or myself were mentioned in just about every major newspaper in the US!
Sadly the media has trouble distinguishing between informed commentary and nonsense (like Zero Right) ... but at least bloggers now get mentioned.
From March 2007: Media Inquiries Policy
Calculated Risk is a hobby blog, created and maintained by a retired executive, with occasional assistance from a former bank officer and mortgage lending specialist who is currently on extended medical leave. Both of these people get endless questions, answers, hat tips, links, analysis, and overall inspiration from a very diverse group of commenters, regulars and occasional de-lurkers, all of whom are beloved except some of them.
CR regularly gets emails and comments from paid reporters who wish to know if CR or Tanta would like to be interviewed, or would simply like to answer one or several questions that the reporter has about economic or housing or mortgage issues. Because, so far, the answer has always been something on the order of “no,” we would like to explain to you why this is the case.
...
Dear reporters, we quote your stuff periodically, giving credit both to the reporter and the publication, under fair use terms. We have no objection to your returning the favor. If you have an editor who will not allow that, and you think that the problem can be solved by getting one of us to drop our online personas, give you our real names, and say the same thing to you over the phone, so that you can get your editor to accept it as something other than just blogging, which everybody knows is untrustworthy ranting by anonymous nuts, you are making a faulty assumption about the relationship among us, our birthdays, and yesterday. Neither CR nor Tanta wishes to play into a set of assumptions that render what we say on the blog as unworthy of coverage by the Big Media, but what we might say on the phone to Intrepid Reporter as good dirt and straight skinny.
From 2007 and 2008: The Compleat UberNerd
by Calculated Risk on 8/19/2016 11:15:00 AM
Note: I'm flying to Boston today to attend a wedding this weekend. There will be a few posts on Tanta today.
In December 2006, my friend Doris "Tanta" Dungey started writing for Calculated Risk.
From December 2006, until she passed away from ovarian cancer on Nov 30, 2008, Tanta was my co-blogger. Tanta worked as a mortgage banker for 20 years, and we started chatting in early 2005 about the housing bubble and the changes in lending practices. In 2006, Tanta was diagnosed with late stage cancer, and she took an extended medical leave while undergoing treatment. While on medical leave she wrote for this blog, and her writings received widespread attention and acclaim.
If you want to understand the mortgage industry, read Tanta's posts (here is The Compleat UberNerd and a Compendium of Tanta's Posts).
As an example, here is a brief excerpt from Foreclosure Sales and REO For UberNerds
The following is not an exhaustive discussion of all of the issues involved in foreclosures and REO. It’s a start at unpacking some of the concepts and definitions. We have been seeing, and are going to continue to see, a lot of information presented on foreclosure sales, REO sales, and their impacts on existing home transaction volumes and prices in various market areas. As always with “UberNerd” posts, this is long and excruciating. Proceed with typical motivation as you may consider your own best interest in an open market in blog postings.And an excerpts from Mortgage Servicing for UberNerds
StillLearning asked in the comments about mortgage servicing, and since y’all are nerds, not dummies, here’s my highly-selective occasionally-oversimplified summary for you that skips the boring parts like how your check gets out of the “lockbox” and that stuff. We can discuss extra-credit issues like “excess servicing” and “subservicing” and “SFAS 144 meets MSR” and “negative convexity” and other kinds of inside baseball in the comments. There is a lot that can be said about loan servicing, but let’s start with the basics:Also see In Memoriam: Doris "Tanta" Dungey for photos, links to obituaries in the NY Times, Washington Post and much more.
Servicers have two major types of servicing portfolio: loans they service for themselves and loans they service for other investors. In accounting terms, the “compensation” is the same, meaning that even if you are the noteholder, you pay yourself to service the loans in the same way that an outside investor would pay you, and it shows on the books that way. The differences in compensation stem from the basic fact that one is generally more motivated to do a good job servicing (particularly collecting and efficiently liquidating REO) for one’s own investment than for someone else’s.
December 2006: Tanta joined CR!
by Calculated Risk on 8/19/2016 08:05:00 AM
Note: I'm flying to Boston today to attend a wedding this weekend. There will be a few posts on Tanta today.
In December 2006, my friend Doris "Tanta" Dungey started writing for Calculated Risk.
When some people say that here are few women bloggers in finance and economics, I remind them that Tanta was the best of all of us!
From December 2006, until she passed away from ovarian cancer on Nov 30, 2008, Tanta was my co-blogger. Tanta worked as a mortgage banker for 20 years, and we started chatting in early 2005 about the housing bubble and the changes in lending practices. In 2006, Tanta was diagnosed with late stage cancer, and she took an extended medical leave while undergoing treatment. While on medical leave she wrote for this blog, and her writings received widespread attention and acclaim.
Here are excerpts from her first two posts:
From December 2006: Let Slip the Dogs of Hell
I still haven’t gotten over the fact that there’s a “capital management” group out there having named itself “Cerberus”. Those of you who were not asleep in Miss Buttkicker’s Intro to Western Civ will recognize Cerberus; the rest of you may have picked up the mythological fix from its reprise as “Fluffy” in the first Harry Potter novel. Wherever you get your culture, Cerberus is the three-headed dog who guards the gates of Hell. It takes three heads to do that, of course, because it’s never clear, in theology or finance, whether the idea is to keep the righteous from falling into the pit or the demons from escaping out of it (the third head is busy meeting with the regulators). Cerberus is relevant not just because it supplies me with today’s metaphor, but because it was the Biggest Dog of three (including Citigroup and Aozora, a Japanese bank) who in April bought a 51% stake in GMAC’s mega-mortgage operation, GM having, of course, once been renowned as one of the Big Three Automakers until it became one of the Big Three Financing Outfits With A Sideline In Cars. I tried to find a link for you to Aozora Bank’s announcement of the purchase, but the only press release I could find for that day involved the loss of customer data. They must have been so busy letting GMAC into the underworld that the dog head keeping the deposit tickets from getting out got distracted.And from December 2006: On Hybrids, Teasers, and Other Mortgage Guidance Problems
...
Now, I’m just a Little Mortgage Weenie, not a Big Finance Dog, but bear with me while I ask some stupid questions. Like: how do the Big Dogs maintain “diverse and flexible production channels” (i.e., little mortgage banker Puppies to sell you correspondent business and little broker Puppies to sell you wholesale business) when “market share currently held by top-tier players” expands to two-thirds (meaning less diverse off-load strategies for the Little Puppies in the “production channels,” putting them at further pipeline/counterparty risk unless they become Bigger Puppies, which makes them competitors instead of “channels,”), while at the same time watching some of the Little Puppies (in whom the Big Dogs have a major equity stake) crawl under the porch to die? I know Citi doesn’t seem to have noticed that the “increased regulatory scrutiny” is not just of “products” but of “wholesale operational/management controls,” but I did.
First of all, a “hybrid ARM” is called a “hybrid” because it is, basically, a cross between a fixed rate and adjustable rate mortgage. Before the early 90s, an “ARM” basically meant a one-year ARM. The initial interest rate was set for one year, and the rate adjusted every year. The only real variations on this theme involved shortening the adjustment frequency: you could get an ARM that adjusted every six months instead of one year.CR Note: If you want to understand the mortgage industry, read Tanta's posts (here is The Compleat UberNerd and a Compendium of Tanta's Posts).
Around the early 90s, the “hybrid ARM” was introduced. It had an initial period in which the rate was “fixed” that didn’t match the subsequent adjustment frequency: this is the classic 3/1, 5/1, 7/1, and even 10/1 ARM. The whole idea of the hybrid ARM was to provide a kind of medium-range risk/reward tradeoff for borrowers and lenders.
Also see In Memoriam: Doris "Tanta" Dungey for photos, links to obituaries in the NY Times, Washington Post and much more.
Thursday, August 18, 2016
Friday: Travel Day
by Calculated Risk on 8/18/2016 09:36:00 PM
I'm off to Boston for the weekend and then to New York for a few days. Posting will be intermittent. Best wishes to all!
Here is an update on mortgage rates from Matthew Graham at Mortgage News Daily: Mortgage Rates Slightly Lower
Mortgage Rates continued avoiding drama today, moving moderately lower as bond markets held on to gains that followed yesterday's Fed Minutes. As we discussed yesterday, the Fed didn't say anything earth-shattering, but some investors were prepared for more clues about rate hikes in the near term. When those clues didn't show up, rates were able to come back down just slightly.Here is a table from Mortgage News Daily:
Rates first improved in the secondary markets and Treasuries. When markets move in the afternoon--especially if that movement is just barely enough for a lender to consider changing rates--lenders will often wait until the following morning to make the adjustment. This was the case today as most lenders were in better territory right from the start. The improvement isn't enough to change actual interest rates, which remain in a range of 3.375-3.5% on conventional 30yr fixed quotes. But today's closing costs would be slightly lower compared to yesterday's.
emphasis added


