by Calculated Risk on 9/03/2011 08:11:00 AM
Saturday, September 03, 2011
Summary for Week Ending September 2nd
This was a busy week for economic data, but the key story of the week was the August employment report - and the report was dismal. There were no jobs added in August (zero total non-farm and 17,000 private sector jobs added). Also the BLS revised down payrolls for June and July.
The unemployment rate was unchanged at 9.1%, but U-6, an alternate measure of labor underutilization that includes part time workers and marginally attached workers, increased to 16.2%; this is at the high for the year. The average workweek declined slightly to 34.2 hours, and average hourly earnings decreased.
There were special factors in August - the debt ceiling shock to the economy and the Verizon strike - but overall this was another very weak report. The good news is August is over.
The other economic data was weak, but for the most part better than expected. The ISM manufacturing index and the regional data (Chicago PMI and Texas Manufacturing survey) were weak, but showed expansion.
Consumer spending in July was solid, but will probably be weaker in August due to the confidence shattering debt ceiling debate. Auto sales in August were down slightly from July - not too bad considering the debt ceiling shock and that Hurricane Irene hit during the last weekend of the month.
The house price indexes, Case-Shiller and CoreLogic, showed seasonal increases in prices in June and July respectively.
There was a theme: Data sampled in early August, like the employment report, tended to be especially weak, but data sampled later in the month, while still very weak, was not as quite as grim. This suggests that the debt ceiling debate, and possibly the European debt crisis, impacted consumer and business confidence early in August.
Unfortunately the European crisis is once again in the news with more negotiations about the next Greece bailout. Also bond yields for Italy and Spain are starting to increase again (although Ireland is doing better). This will be something to watch over the next few weeks.
Here is a summary in graphs:
• August Employment Report: 0 Jobs (unchanged), 9.1% Unemployment Rate
 Click on graph for larger image in graph gallery.
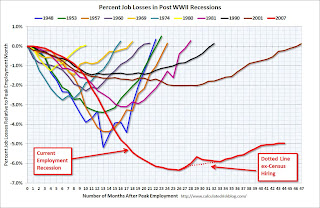
This graph shows the job losses from the start of the employment recession, in percentage terms aligned at the start of the recession.
In this post, the graph shows the job losses aligned at maximum job losses.
The red line is moving sideways - and I'll need to expand the graph soon.
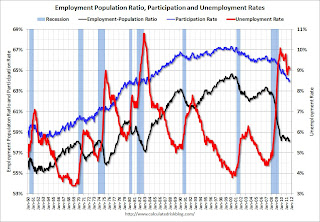
 This graph shows the employment population ratio, the participation rate, and the unemployment rate. The unemployment rate was unchanged at 9.1% (red line).
The Labor Force Participation Rate increased to 64.0% in August (blue line). This is the percentage of the working age population in the labor force.
The Employment-Population ratio increased to 58.2% in August (black line).
 The number of workers only able to find part time jobs (or have had their hours cut for economic reasons) increased to 8.826 million in August from 8.396 million in July.
These workers are included in the alternate measure of labor underutilization (U-6) that increased to 16.2% in August from 16.1% in July. This is at the high for the year.
The next graph shows the duration of unemployment as a percent of the civilian labor force.
 The graph shows the number of unemployed in four categories: less than 5 week, 6 to 14 weeks, 15 to 26 weeks, and 27 weeks or more.
Two categories declined in August: The 27 weeks and more (the long term unemployed) declined slightly to 6.0 million workers, or just under 4.0% of the labor force, and the '5 to 14 weeks' category edged down slightly.
The other two categories increased, especially the '15 to 26 weeks' group that increased to 2.24 million or almost 1.5% of the labor force - the highest level since January.
Here are the employment posts from yesterday:
1) August Employment Report: 0 Jobs (unchanged), 9.1% Unemployment Rate
2) Employment Summary, Part Time Workers, and Unemployed over 26 Weeks
3) Duration of Unemployment, Unemployment by Education and Diffusion Indexes
4) Employment graph gallery
• Personal Income increased 0.3% in July, Spending increased 0.8%
The BEA released the Personal Income and Outlays report for July:
 This graph shows real Personal Consumption Expenditures (PCE) through July (2005 dollars).
PCE increased 0.8 in July, and real PCE increased 0.5% as the price index for PCE increased 0.4 percent in July.
Real PCE was revised up a little for Q2 too. This was a solid increase in spending and above the consensus of 0.5% - however I expect August to be weaker due to the confidence shattering debt ceiling debate.
• Case Shiller: Home Prices increased in June
From S&P: Nationally, Home Prices Went Up in the Second Quarter of 2011 According to the S&P/Case-Shiller Home Price Indices
 This graph shows the nominal seasonally adjusted Composite 10 and Composite 20 indices (the Composite 20 was started in January 2000).
The Composite 10 index is off 31.9% from the peak, and up slightly in June (SA). The Composite 10 is 1.5% above the June 2009 post-bubble bottom (Seasonally adjusted).
The Composite 20 index is off 31.9% from the peak, and down slightly in June (SA). The Composite 20 is slightly above the March 2011 post-bubble bottom seasonally adjusted.
 Here are the price declines from the peak for each city included in S&P/Case-Shiller indices.
Prices increased (SA) in 8 of the 20 Case-Shiller cities in June seasonally adjusted. Prices in Las Vegas are off 59.2% from the peak, and prices in Dallas only off 9.7% from the peak.
This increase was mostly seasonal and prices will probably decline later this year.
• ISM Manufacturing index declines slightly to 50.6
From the Institute for Supply Management: August 2011 Manufacturing ISM Report On Business®
 PMI was at 50.6% in August, down from 50.9% in July. The employment index was at 51.8%, down from 53.5%, and new orders increased to 49.6%, up from 49.2%.
Here is a long term graph of the ISM manufacturing index.
This was above expectations of 48.5% and suggests manufacturing expanded - slowly - in August.
• U.S. Light Vehicle Sales at 12.12 million SAAR in August
 Based on an estimate from Autodata Corp, light vehicle sales were at a 12.12 million SAAR in August. That is up 5.3% from August 2010, and down less than 1% from the sales rate last month (12.2 million SAAR in July 2011).
This was right at the consensus forecast of 12.1 million SAAR.
Note: dashed line is current estimated sales rate.
Growth in auto sales should make a positive contribution to Q3 GDP as sales bounce back from the May and June lows. However, so far, sales in Q3 have average 12.16 million, only slightly above the Q2 rate - May and June were very weak, but April was above 13 million SAAR.
• Construction Spending declined in July
The Census Bureau reported that overall construction spending declined in July.
 This graph shows private residential and nonresidential construction spending, and public spending, since 1993. Note: nominal dollars, not inflation adjusted.
Private residential spending is 63% below the peak in early 2006, and non-residential spending is 36% below the peak in January 2008.
Private construction spending is mostly moving sideways, and it is public construction spending that is now declining. Note: Residential construction spending for May and June were revised up significantly.
• LPS: Average Loan in Foreclosure Is Delinquent for Record 599 Days
From LPS: LPS' Mortgage Monitor Report Shows Average Loan in Foreclosure Is Delinquent for Record 599 Days; First-Time Foreclosure Starts Near Three-Year Lows
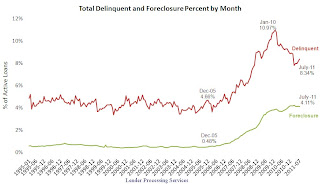
 According to LPS, 8.34% of mortgages were delinquent in July, up from 8.15% in June, and down from 9.31% in July 2010.
LPS reports that 4.11% of mortgages were in the foreclosure process, down slightly from 4.12% in June, and up from 3.74% in July 2010. This gives a total of 12.45% delinquent or in foreclosure.
This graph shows the total delinquent and in-foreclosure rates since 1995.
The total delinquent rate has increased recently (part of the increase is seasonal), but the rate has fallen to 8.34% from the peak in January 2010 of 10.97%. A normal rate is probably in the 4% to 5% range, so there is a long long ways to go.
However the in-foreclosure rate at 4.11% is barely below the peak rate of 4.21% in March 2011. There are still a large number of loans in this category (about 2.16 million) - and the average loan in foreclosure has been delinquent for a record 599 days!
• Weekly Initial Unemployment Claims decline to 409,000
 The following graph shows the 4-week moving average of weekly claims since January 2000 (longer term graph in graph gallery).
The dashed line on the graph is the current 4-week average. The four-week average of weekly unemployment claims increased this week to 410,250.
Weekly claims declined slightly, but the 4-week average is still elevated. Next week claims will probably increase due to Hurricane Irene.
• Other Economic Stories ...
• FOMC Minutes: Discussed Options for additional monetary accommodation
• CoreLogic: Home Price Index increased 0.8% in July
• From the NAR: Pending Home Sales Slip in July but Up Strongly From One Year Ago
• From the Dallas Fed: Texas Manufacturing Activity Flat
• From the Chicago PMI Chicago Business Barometer™ Slipped
• Recession Measures: an update to four key indicators used by the NBER for business cycle dating: GDP, Employment, Industrial production and real personal income less transfer payments.
• From the National Restaurant Association: Restaurant Industry Outlook Softened in July as Restaurant Performance Index Slipped to Its Lowest Level in 11 Months
• Fannie Mae and Freddie Mac Serious Delinquency Rates mostly unchanged in July
• From the FHFA: FHFA Sues 17 Firms to Recover Losses to Fannie Mae and Freddie Mac
• ADP: Private Employment increased 91,000 in August
Have a great weekend.


