by Calculated Risk on 8/31/2011 10:10:00 AM
Wednesday, August 31, 2011
CoreLogic: Home Price Index increased 0.8% in July
• First on the Chicago PMI Chicago Business Barometer™ Slipped: The overall index decreased to 56.5 from 58.8 in July. This was above consensus expectations of 53.5. Note: any number above 50 shows expansion. The employment index increased to 52.1 from 51.5. The new orders index decreased to 56.9 from 59.4.
• Notes: This CoreLogic Home Price Index is for July. The Case-Shiller index released yesterday was for June. Case-Shiller is the most followed house price index, but CoreLogic is used by the Federal Reserve and is followed by many analysts. The CoreLogic HPI is a three month weighted average of May, June and July (July weighted the most) and is not seasonally adjusted (NSA).
From CoreLogic: CoreLogic® July Home Price Index Shows Fourth Consecutive Month-Over-Month Increase
CoreLogic ... today released its July Home Price Index (HPI) which shows that home prices in the U.S. increased for the fourth consecutive month, inching up 0.8 percent on a month-over-month basis. On a year-over-year basis, however, national home prices, including distressed sales, declined by 5.2 percent in July 2011 compared to July 2010. In June 2011, prices declined by 6.0 percent* compared to June 2010. Excluding distressed sales, year-over-year prices declined by 0.6 percent in July 2011 compared to July 2010 and by 1.9* percent in June 2011 compared to June 2010. Distressed sales include short sales and real estate owned (REO) transactions. [*CR note: June index was revised up]
“While July’s numbers remained relatively positive, particularly for non-distressed sales which have been stable, seasonal influences are expected to fade in late summer. At that point the month-over-month growth will most likely turn negative. The slowdown in economic growth and increased uncertainty caused by the recent stock market volatility will continue to exert downward pressure on prices,” said Mark Fleming, chief economist for CoreLogic.
 Click on graph for larger image in graph gallery.
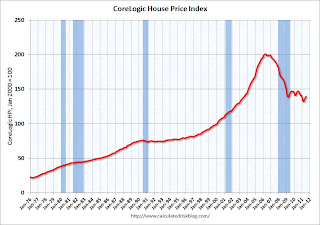
 This graph shows the national CoreLogic HPI data since 1976. January 2000 = 100.
The index was up 0.8% in July, and is down 5.2% over the last year, and off 30.6% from the peak - and up 5.5% from the March low.
As Mark Fleming noted, some of this increase is seasonal (the CoreLogic index is NSA) and the index is still off 5.2% from last July. Month-to-month prices will probably turn negative later this year (the normal seasonal pattern).
Yesterday:
• Case Shiller: Home Prices increased in June
• Real House Prices and Price-to-Rent
• LPS: Average Loan in Foreclosure Is Delinquent for Record 599 Days


