 RSS Feed
 by Calculated Risk on 9/30/2006 04:03:00 PM
Saturday, September 30, 2006
Housing Bust Impact: Office Leasing
From the Orange County Register: Office landlords vulnerable to housing woes
Orange County's office market is one of the most highly exposed markets in the nation to the housing industry, an industry report says.The #1 office market with exposure to the housing bust is the Inland Empire!
The county and Las Vegas tie for third among major markets that lease a high percentage of space to housing-related companies, says a study by Grubb & Ellisand PNC Real Estate Finance.
Housing companies accounted for 21 percent of all leasing activity in the county since 2000.
Yet in recent months, the trend shifted, brokers say.
Mortgage companies have vacated more than a million square feet of office space this year amid a drop in demand for home loans, brokers say. A slowing housing market and slightly higher interest rates are to blame, they say.
...
Housing-related companies include homebuilders, sellers of materials such as lumber, mortgage and other real estate finance firms, and professional firms such as architects.
Nationwide, the effect of the housing slowdown on the office market is likely to be modest, Grubb's report says.
Friday, September 29, 2006
New Home Sales and Cancellations
by Calculated Risk on 9/29/2006 06:00:00 PM
From Caroline Baum at Bloomberg: Think Housing's Stabilized? See Cancellations
... cancellations are rising, and they aren't being captured in the aggregate statistics because of the way the survey is designed. Hence, sales are being overstated and inventories understated.This is the clearest discussion I've seen about how the Census Bureau accounts for cancellations.
``Once a sales contract is signed, there's no way of recording the cancellation or putting the home back in inventory,'' says Dave Seiders, chief economist at the National Association of Homebuilders in Washington. ``Builders keep track of gross and net sales; we don't have a net sales number from Commerce.''
The Census Bureau, which is one of the Commerce Department's statistical agencies, counts an initial new home sale: Sales go up and the ``for sale'' inventory is reduced. If the sale is canceled, it isn't reflected in revisions to previous months. What happens? When the home is ``resold,'' statisticians ignore that transaction.
``We don't double count,'' says Steven Berman, the survey statistician for the residential branch of the Census Bureau's manufacturing and construction division.
When the cancellation rate is changing -- in either direction -- it can distort both sales and inventories.
We know from big builders that cancellation rates are rising. Seiders says the rate ``has roughly doubled over the last year'' and is ``more serious at the big companies.''
...
The effect of higher cancellations is ``to overstate the overall level of sales and understate the level of inventories,'' Carson says. The opposite is true at the bottom of the economic cycle, when sales pick up and the resold homes aren't registered as a sale or removed from the ``for sale'' pile.
What makes the current situation so worrisome is the ``unprecedented inventory overhang, encompassing new and existing markets and many of the largest metropolitan areas,'' Carson says. ``Its sheer size raises the odds that prices will fall more and longer nationwide than they did in the 1990s.''
1) When a house is sold, the Census Bureau includes the sale and reduces inventory by one.
2) If the house is cancelled, the Census Bureau does nothing. Sales are not reduced; inventory is not increased.
3) When the same house is resold, the Census Bureau does nothing. It is not included in Sales.
So if 100K houses have been cancelled and not resold, inventory is actually 100K higher than reported by the Census Bureau. Because of the recent high cancellations rates, this means that new home sales are probably much lower than reported by the Census Bureau - and inventories are significantly higher.
IRS introduces New Tool for Mortgage Income Verification
by Calculated Risk on 9/29/2006 02:38:00 PM
The Hartford Courant reports: Lenders Will Be Spotting Income Fibs Much Faster
Starting Monday, it's going to get much riskier to fib about your income when you apply for a home mortgage. That's because the Internal Revenue Service is overhauling a key income verification tool used by lenders - making it faster and easier to pull up electronically the confidential income tax information of borrowers.
...
Many lenders in recent years have offered "stated income" and other limited documentation mortgages aimed especially at self-employed applicants. Dubbed "liar loans" by industry critics, stated-income mortgage programs allow applicants to bypass standard underwriting requirements for W-2s or copies of personal and corporate income tax records.
Instead, applicants simply assure the loan officer or broker that, yes indeed, we earn enough to qualify for the mortgage, and the transaction proceeds to closing. Often lenders will ask borrowers to fill out what is known as an IRS Form 4506-T along with their other mortgage documents.
That form authorizes the lender or the investor providing the money for the mortgage to obtain transcripts from the IRS summarizing income and tax data for as many as four years. The form must be signed by the borrower and can be used only during the 60-day period after the date of signing.
Until now, the process of faxing in 4506-T requests to the IRS and obtaining transcripts has been paper-driven and non-electronic - making income verifications slow and difficult to fit into lenders' highly automated loan underwriting systems. Most lenders have used 4506-T forms as a way to perform quality-control checks on pools of closed mortgages.
But now, with the IRS promising to provide electronic transcript tax data within one to two business days in an electronic format, more lenders are likely to run income checks before closing - even on loans to applicants who are not self-employed or using stated-income programs.
Nontraditional Mortgage Guidance Released
by Calculated Risk on 9/29/2006 11:55:00 AM
From the Federal Reserve: Federal Financial Regulatory Agencies Issue Final Guidance on Nontraditional Mortgage Product Risks
The federal financial regulatory agencies today issued final guidance to address the risks posed by residential mortgage products that allow borrowers to defer repayment of principal and sometimes interest (Interagency Guidance on Nontraditional Mortgage Product Risks).Addendum
These products, referred to variously as "nontraditional," "alternative," or "exotic" mortgage loans (referred to below as nontraditional mortgage loans), include "interest-only" mortgages and "payment option" adjustable-rate mortgages. These products allow borrowers to exchange lower payments during an initial period for higher payments later.
While similar products have been available for many years, the number of institutions offering them has expanded rapidly. At the same time, these products are offered to a wider spectrum of borrowers who may not otherwise qualify for a similar-size mortgage under traditional terms and underwriting standards. The agencies are concerned that some borrowers may not fully understand the risks of these products. While many of these features exist in other adjustable-rate mortgage products, the agencies' concern is elevated with nontraditional products because of the lack of principal amortization and the potential for negative amortization. In addition, institutions are increasingly combining these loans with other features that may compound risk ("risk layering"). These features include making simultaneous second-lien mortgages and relying on reduced or no documentation in evaluating an applicant's creditworthiness.
The final guidance discusses the importance of carefully managing the potential heightened risk levels created by these loans. Toward that end, management should:Ensure that loan terms and underwriting standards are consistent with prudent lending practices, including consideration of a borrower's repayment capacity;The agencies published for comment proposed interagency guidance on Nontraditional Mortgage Products on December 29, 2005. Comments were received from financial institutions, trade associations, consumer and community organizations, state and financial regulatory organizations, and other members of the public. The agencies made a number of changes to the proposal to respond to the commenters' concerns and to provide additional clarity.
Recognize that many nontraditional mortgage loans, particularly when they have risk-layering features, are untested in a stressed environment. These products warrant strong risk management standards, capital levels commensurate with the risk, and an allowance for loan and lease losses that reflects the collectibility of the portfolio; and
Ensure that consumers have sufficient information to clearly understand loan terms and associated risks prior to making a product or payment choice.
NTM attachment 1 (104 KB PDF) (note: this is the guidance)
NTM attachment 2 (261 KB PDF)
Housing: Reports of Fraud Grow
by Calculated Risk on 9/29/2006 11:36:00 AM
David Streitfeld writes in the LA Times: More Home Buyers Stretch Truth, Budgets to Get Loans

Mortgage fraud continues to escalate in Southern California, FBI figures show, raising concerns of increased defaults and foreclosures as the housing market cools down."It's only when the tide goes out that you learn who's been swimming naked." Warren Buffett.
Lenders filed 4,228 reports of suspicious activity in the region during the first 11 months of the government's fiscal year, which ends Saturday, the FBI said. That puts 2006 on track to nearly double last year's total.
The jump in reports of suspicious activity even as home sales have declined may stem in part from a lag in reporting. But the FBI and industry experts say the trend also reflects growing deceit by average borrowers who overstated their income, exaggerated their assets or hid their debts simply to qualify for a mortgage in the region's sky-high housing market.
...
During the boom, people who lied about their income to get a loan — and then struggled to make the payments — had the option of making ends meet by tapping their newfound equity through refinancing or by selling the property for a profit.
But now, with prices flattening out or declining, those without sufficient equity could be forced to sell for a loss or even default on payments. That could accelerate any downturn in the market by swamping it with foreclosed and bargain-priced properties.
Thursday, September 28, 2006
UCLA on Housing
by Calculated Risk on 9/28/2006 01:58:00 PM
The LA Times reports: UCLA Group Predicts Flat Home Prices
... the UCLA Anderson Forecast reiterates earlier projections that the deteriorating housing sector will slow state and national economic output and job growth through 2008. Although it doesn't rule out a recession, it doesn't expect one.In summary, UCLA is forecasting five years of flat nominal home prices (15% to 20% real price decline) and GDP growth of 1.8% through the first half of '07.
...
"Expect home prices five years from now to be about the same as they are today, though lower in real [inflation-adjusted] terms by 15%-20%," the forecast said.
Although the statewide average price might not decline, a few areas where about 40% of the housing stock is new construction — such as in Yolo and Placer counties — are expected to see drops as builders cut prices to move inventory ...
... the lack of a significant price correction is bad for the economy overall because it will lead to further job and productivity losses in the housing sector, said Edward Leamer, director of the UCLA Anderson Forecast.
"So while your happy homeowner is pleased by the fact that home prices are not going down," Leamer said, "the unhappy home builder is not going to have anything to do."
Leamer cautioned that the outlook was based on data trumped by recent reports showing that housing sales and starts were sliding more rapidly than the group had projected.
If the trend accelerates, he said, "then our forecast is too optimistic."
...
It expects inflation-adjusted economic growth to slow to an average annualized rate of 1.8% through the first half of 2007 and unemployment, now at 4.7%, to rise to 5.1% by the end of next year.
...
"While not a recession, it is hardly a pretty picture," the UCLA report said. "The combination of sluggish growth and rising prices will have the look and feel of a low-level stagflation."
Wednesday, September 27, 2006
Dow Jones: Exotic Mortgage Guidance To Be 'Benign'
by Calculated Risk on 9/27/2006 06:56:00 PM
Dow Jones reports: US Government Exotic Mortgage Guidance To Be 'Benign' -Analysts
Federal bank and thrift regulators are close to releasing final guidelines on exotic mortgage products, but the agencies aren't expected to call for wholesale changes in the way these products are marketed or made, three analysts wrote Wednesday.
...
Those guidelines are expected to become final in the next few days.
"We view the...guidance as relatively benign and unlikely to materially impact the business models of option ARM lenders, namely Countrywide (CFC), Washington Mutual (WAMU), Downey Financial (DSL), and Indymac (NDE)," three analysts from Friedman Billings Ramsey wrote in an industry update. [emphasis added]
New Home Sales and Recessions
by Calculated Risk on 9/27/2006 04:35:00 PM
One of the most reliable economic leading indicators is New Home Sales. Click on graph for larger image.
New Home sales were falling prior to every recession of the last 35 years, with the exception of the business investment led recession of 2001. This should raise concerns about a possible consumer led recession in the months ahead.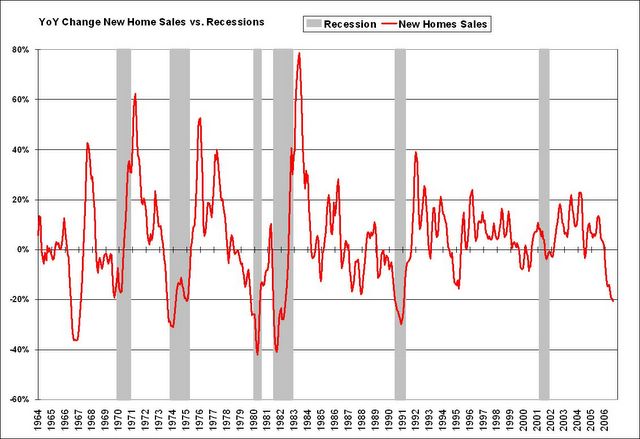
The second graph shows the YoY change in New Home Sales vs. Recessions. For a description of this graph, see: Investment and Recessions
With the New Home sales data released today, including downward revisions for the last few months, this indicator is at minus 20.6%, a level that has historically signaled a recession. The one exception was in the mid '60s when the buildup for the Vietnam war kept the economy out of recession.
One of the two best economic leading indicators is now flashing recession. The other reliable indicator is an inverted yield curve, and the yield is currently inverted.
More on August New Home Sales This graph shows August New Home sales for the last 20 years. The recent sharp drop in sales is similar to the decrease at the start of the 1990s housing bust.
August sales have fallen back to the 2002 levels.
And this graph shows YTD New Home sales through August. It now appears that 2006 will finish as the 4th best year behind 2003.
Given that sales have fallen back to 2002/2003 levels, it would seem reasonable to expect that BLS reported residential construction employment will fall back to the levels of those same years. The following chart shows BLS data for the last 6 years.
| Residential Construction Employment, Monthly Average, Thousands | |||
| Year | Residential building | Residential specialty trade contractors | Total |
| 2001 | 781 | 1849 | 2630 |
| 2002 | 803 | 1887 | 2690 |
| 2003 | 837 | 1965 | 2802 |
| 2004 | 896 | 2123 | 3019 |
| 2005 | 949 | 2278 | 3227 |
| 2006 | 979 | 2346 | 3325 |
There will probably be 600K jobs lost in reported residential construction employment over the next couple of years - if housing stabilizes at this level. If housing continues to fall, something I think is likely, then even more jobs will be lost.
New Home Sales Revisions
by Calculated Risk on 9/27/2006 02:52:00 PM
During periods of housing market weakness, the preliminary estimate of New Home Sales from the Census Bureau has consistently been too high.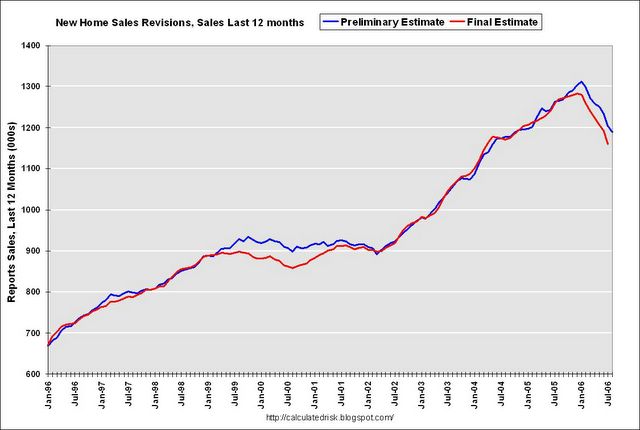 Click on graph for larger image.
This graph shows the previous 12 months of sales using the preliminary estimate and the final estimate - or most recent estimate for last few months, since final estimate isn't available yet.
NOTE: Graph start at 600 thousand units to better show the difference between the preliminary and final estimates.
During the period of flat sales in 2000 and 2001, the Census Bureau's preliminary estimate was too high. And during the current housing bust, the Bureau's preliminary estimates are once again being revised down.
Today's report was no different. The previous months were all revised down, and the odds are New Home Sales for August will be around or under 1 million units when the final estimate is released.
August New Home Sales: 1.050 Million Annual Rate
by Calculated Risk on 9/27/2006 09:57:00 AM
According to the Census Bureau report, New Home Sales in August were at a seasonally adjusted annual rate of 1.050 million. Sales for July were revised down to 1.009 million, from 1.072 million. Numbers for May and June were also revised down.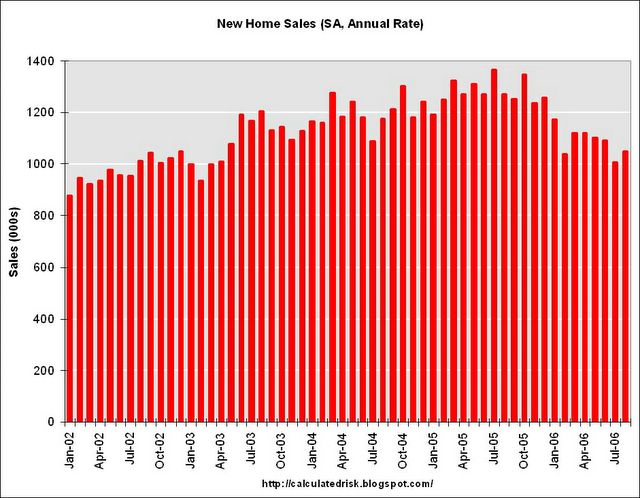
Click on Graph for larger image.
Sales of new one-family houses in August 2006 were at a seasonally adjusted annual rate of 1,050,000, ... This is 4.1 percent above the revised July rate of 1,009,000, but is 17.4 percent below the August 2005 estimate of 1,271,000.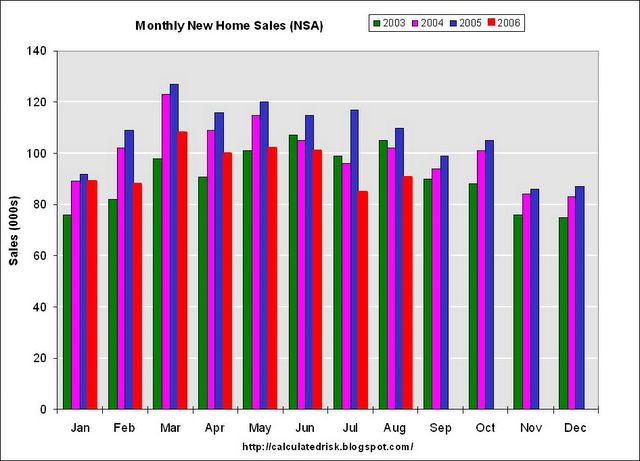
The Not Seasonally Adjusted monthly rate was 91,000 New Homes sold. There were 110,000 New Homes sold in August 2005.
On a year over year NSA basis, August 2006 sales were 17.3% lower than August 2005. Also, August '06 sales were below August 2004 (102,000) and August 2003 (105,000) sales. This is the lowest August since 2002 when 90,000 new homes were sold.
The median and average sales prices were down slightly. Caution should be used when analyzing monthly price changes since prices are heavily revised.
The median sales price of new houses sold in August 2006 was $237,000; the average sales price was $304,400.
The seasonally adjusted estimate of new houses for sale at the end of August was 568,000. This represents a supply of 6.6 months at the current sales rate.
The 568,000 units of inventory would have been another record for new houses for sale, except July 2006 was revised up to 570,000.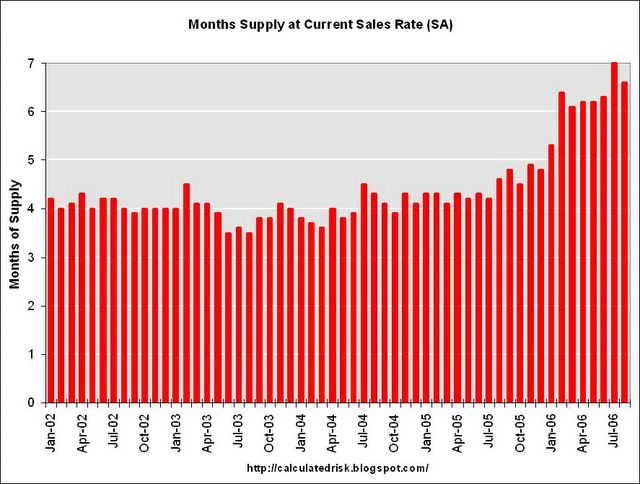
On a months of supply basis, inventory is above the level of recent years.
This report is very weak, especially considering the strong downward revisions for the previous months.
More later today on New Home Sales and Recessions.
MBA: 30-Year Fixed Rate Declines
by Calculated Risk on 9/27/2006 12:19:00 AM
The Mortgage Bankers Association (MBA) reports: 30-Year Fixed Rate Declines Click on graph for larger image.
The Market Composite Index, a measure of mortgage loan application volume, was 566.5, a decrease of 4.9 percent on a seasonally adjusted basis from 595.8 one week earlier. On an unadjusted basis, the Index decreased 5.4 percent compared with the previous week and was down 21.1 percent compared with the same week one year earlier.Mortgage rates decreased:
The seasonally-adjusted Purchase Index decreased by 5.5 percent to 375.9 from 397.9 the previous week and the Refinance Index decreased by 4.1 percent to 1677.5 from 1748.7 one week earlier. The Purchase Index is at its lowest level since November 2003.
The average contract interest rate for 30-year fixed-rate mortgages decreased to 6.18 percent from 6.36 percent ...
The average contract interest rate for one-year ARMs decreased to 5.90 percent from 5.95 percent ...
 The Purchase Index is at its lowest level since November 2003.
 This graph shows the Purchase Index and the 4 and 12 week moving averages.
Note: Scale does not start at zero to better show changes.
Average year-to-date purchase activity is 13.8% below 2005, and has been running more than 20% below 2005 for the last couple of months.
Tuesday, September 26, 2006
Bernanke's Conundrum
by Calculated Risk on 9/26/2006 07:48:00 PM
Last December I suggested:
I think long rates will start to rise when the Fed starts cutting the Fed Funds rate.First, let's review the relationship between various interest rates and mortgage rates.
This will be Bernanke's "conundrum"! As the economy slows, this will reduce the trade deficit and also lower the amount of foreign dollars willing to invest in the US - the start of a possible vicious cycle.
 Click on graph for larger image.
One of the most popular mortgages is the One-year Treasury-indexed ARM. When the Fed starts cutting rates, the rate on the one year ARM will probably also decrease. This might help the housing market a little, but ...
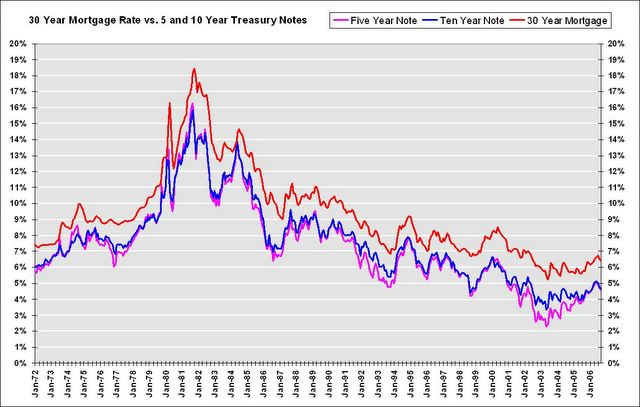
The most popular loans are still the 30 year fixed rate. Typically long rates start falling when the Fed starts cutting rates, but recently there has been a weakening of the link between long and short rates. What if the next time the Fed starts cutting rates, the long rate rises?
NOTE: Although long rates have fallen recently, rates are still well above the lows of the last couple of years.
Via Mark Thoma: Dallas Fed economist Tao Wu wrote about the weakening link, between the Fed Funds rate and long rates, in an economic letter this month: Globalization’s Effect on Interest Rates and the Yield Curve

Monetary policy’s effects on the economy stem largely from how long-term interest rates respond to central banks’ actions. In most industrialized nations, central bankers have direct control over short-term interest rates and use them as their main policy instrument. When central banks raise short-term rates, it usually leads to increases in market-determined long-term rates, including those for mortgages and commercial loans. Higher long-term rates curb aggregate consumption and investment, ultimately helping contain inflation. Cutting short-term rates, on the other hand, usually leads to lower long-term rates, providing a stimulus for economic activity. Any lasting changes in the links between short- and long-term rates will thus have important implications for the timing and impact of monetary policy actions.After a discussion on globalization, Wu concludes:
Central banks’ ability to affect long-term rates may be severely eroded, as we have seen in the recent "conundrum" period.And this takes us to Brad Setser's post today (caution: lots of numbers): The deterioration in the US income balance has just begun .... In the post, Dr. Setser outlines how the trade deficit could fall in '07, but the current account deficit could continue to rise. Many of the details are interesting, but an important conclusion is that long rates could rise even if short rates start to fall.
Consequently, the effects of monetary policy tightening or loosening may be substantially weakened. Because long rates are less sensitive to short rates, the response of aggregate demand to monetary policy moves may prove sluggish. One example is the lack of response in the mortgage and housing markets in 2004 and early 2005, when homebuyers’ borrowing costs changed little as the Federal Reserve tightened. Low rates kept the housing boom in high gear, stimulating sales and providing builders with incentives to expand operations despite the Fed’s attempt to slow the economy.
Globalization’s impact on the relationship between short- and long-term interest rates poses potentially formidable challenges for central banks around the world.
And finally, when might the Fed start to cut rates? According to the Cleveland Fed, market expectations have risen sharply for a rate cut in December (now at 28%):
 Most market participants still expect no action in both October and December, but expectations are definitely rising for a cut in December.
Interestingly this runs counter to recent Fed comments including Paul Volcker's comments yesterday. I recommend (again) Tim Duy's Fed Watch: Widening Disconnect.
So Bernanke might not be deciding between inflation vs. growth. Instead he might face a conundrum with a weakening economy: every time Bernanke cuts rates, long rates might rise (for a year or two). And it's long rates that matter - as Dr. Wu noted:
"Monetary policy’s effects on the economy stem largely from how long-term interest rates respond to central banks’ actions."As always there is the opposite view; several observers are forecasting much lower long rates: PIMCO's Bill Gross and Goldman, Merrill See Bond Rally; 2-Year Yield at 3.6%
LA Times: Data on Homes Cause Jitters
by Calculated Risk on 9/26/2006 12:01:00 PM
The LA Times covers several housing topics in this article: Data on Homes Cause Jitters. Some excerpts:
... the real estate boom of the last decade has been unprecedented in size and scope, which raises the risk that the downside also could exceed forecasters' best guesses, said Eric Belsky, executive director of Harvard University's Joint Center for Housing Studies.Employment tends to lag, and so far housing related employment has only fallen slightly according to the BLS.
After any boom, "there's a tendency to predict a more gradual unwinding than actually occurs," he said.
Housing's troubles pose two main threats: one to millions of jobs directly dependent on the business, the other to homeowners' willingness and ability to spend if they feel poorer because of the trend in property prices.
About 10 million jobs are tied directly to residential real estate, from construction workers to escrow agents to the clerks at the local hardware store, Goldman Sachs estimates. That's about 7% of total U.S. employment. Some analysts believe the total is closer to 10%.
... employment cuts overall have been modest, at least as measured by government payroll data, which don't pick up freelance workers. Payroll jobs in residential construction totaled 3.31 million in August, off just fractionally from the 3.33 million at the start of the year, Labor Department data show.And on MEW:
Andy Perkins, San Diego branch manager for Orco Construction Supply, said he believed that job losses were just beginning as housing projects finish up and builders find little or no new demand.
...
Goldman Sachs estimates that the housing sector nationwide could shed 1.5 million to 2 million jobs over the next several years as the industry retrenches.
There also is the so-called wealth effect that housing prices have on consumers' spending.Using my method for calculating MEW, there was $504 Billion in 2004 (compared to Greenspan's estimate of $600 Billion). Although my method is conservative, it is the decrease in MEW that will impact consumer spending - and MEW appears to be decreasing in 2006.
Rocketing home prices over the last decade provided many Americans with an income windfall, either from the outright sales of houses at a profit or from mortgage refinancings or credit lines that allowed homeowners to cash in some of their accumulated equity.
A study coauthored by then-Federal Reserve Chairman Alan Greenspan last year estimated that mortgage-equity withdrawals tied to surging real estate values added $600 billion to consumers' disposable income in 2004 alone, making up about 7% of the total that year.
The LA Times article does a good job of discussing the first two impacts from the housing bust: lost housing related jobs, and the loss of MEW and the potential impact on consumer spending. This article does not discuss the impact from excessive leverage (and foreclosures) using nontraditional loans.
Volcker Sees Inflation Risks
by Calculated Risk on 9/26/2006 01:40:00 AM
From Bloomberg: Volcker Sees Risks of U.S. Inflation Creep, Pressure on Fed
Paul Volcker ... said he's worried both about inflation and pressure on the U.S. central bank to not do anything about it.
"I am a little bit more worried about inflation," said Volcker, 79, speaking at a discussion sponsored by the Women's Economic Round Table in New York yesterday. Gerald Corrigan, who served as New York Fed president from 1985 to 1993, said he shared Volcker's concerns.
While the inflation rate isn't "high" or "running away," Volcker said, "it is kind of creeping up, and I am impressed by the degree of pressure, if that is the right word -- psychological pressure, political pressure -- there is not to do anything about it."
 For those that want to see the entire panel dicussion (long):
Click image for video.
And this fits in with Dr. Tim Duy's Fed Watch tonight: Widening Disconnect
The countdown to the next FOMC meeting is underway, and the gap between market expectations and the Fedspeak appears to be widening. Quite honestly, I find such periods very, very uncomfortable, mostly because I feel Fed watching amounts to explaining a position taken by the Federal Reserve that the markets believe is increasingly untenable.
Monday, September 25, 2006
CAR: Existing Home Sales decrease 30.1%
by Calculated Risk on 9/25/2006 07:03:00 PM
The California Association of Realtors reports: C.A.R. reports sales decrease 30.1 percent in August, median price of a home in California at $576,360, up 1.6 percent from year ago
Home sales decreased 30.1 percent in August in California compared with the same period a year ago, while the median price of an existing home increased 1.6 percent ...According to NAR, nationwide existing home sales are off 12.6%, compared to 30.1% for California, since August 2005.
"We experienced the greatest year-to-year sales decline last month since August 1982, when sales fell 30.4 percent," said C.A.R. President Vince Malta....
Closed escrow sales of existing, single-family detached homes in California totaled 442,150 in August at a seasonally adjusted annualized rate... Statewide home resale activity decreased 30.1 percent from the 632,240 sales pace recorded in August 2005.
...
The median price of an existing, single-family detached home in California during August 2006 was $576,360, a 1.6 percent increase over the revised $567,320 median for August 2005 ... The August 2006 median price increased 1.7 percent compared with July’s revised $566,940 median price.
"Although the median price in the state and in several regions hit an all-time record in August, we expect softer prices toward the end of the year," said C.A.R. Vice President and Chief Economist Leslie Appleton-Young. ...
C.A.R.’s Unsold Inventory Index for existing, single-family detached homes in August 2006 was 6.8 months, compared with 2.6 months (revised) for the same period a year ago.
In a separate report covering more localized statistics generated by C.A.R. and DataQuick Information Systems, 61.7 percent, or 246 out of 399 cities and communities showed an increase in their respective median home prices from a year ago. DataQuick statistics are based on county records data rather than MLS information.
California's sales decrease accounts for over 20% of the U.S. sales decrease since last August. Yet California still has slightly less inventory on a month of sales basis: 6.8 months vs. 7.5 months for U.S. That is probably why median prices in California have held up slightly better than for the U.S.
I live in California, and everyone I talk with in the real estate business believes prices are falling ... and falling significantly in some areas like Sacramento and San Diego. It's not a good sign that California is holding up the U.S. statistics. I believe that will change soon.
NAR: Sales Down, Prices Down, Inventory Up
by Calculated Risk on 9/25/2006 10:16:00 AM
The National Association of Realtors (NAR) reports: Existing-Home Sales Holding At A Sustainable Pace
Click on graph for larger image.
Total existing-home sales – including single-family, townhomes, condominiums and co-ops – slipped 0.5 percent to a seasonally adjusted annual rate1 of 6.30 million units in August from a level of 6.33 million Ju1y, and were 12.6 percent lower than the 7.21 million-unit pace in August 2005, which was the second highest on record.

David Lereah, NAR’s chief economist, said home sales appear to be leveling out. “After a stronger-than-expected drop in July, the fairly even sales numbers in August tell us the market is at a more sustainable pace,” he said. “It keeps us on track to see the third highest sales year on record, but we do expect an adjustment in home prices to last several months as we work through a build up in the inventory of homes on the market.”
The national median existing-home price for all housing types was $225,000 in August, down 1.7 percent from August 2005 when the median was $229,000. The median is a typical market price where half of the homes sold for more and half sold for less. “This is the price correction we’ve been expecting – with sales stabilizing, we should go back to positive price growth early next year,” Lereah said.

Total housing inventory levels rose 1.5 percent at the end of August to 3.92 million existing homes available for sale, which represents a 7.5-month supply at the current sales pace – the highest supply since April 1993.Existing Home Sales are a trailing indicator. The sales are reported at close of escrow, so August sales reflects agreements reached in June and July.
As I've noted before, usually 6 to 8 months of inventory starts causing pricing problem - and over 8 months a significant problem. With current inventory levels at 7.5 months of supply, inventories are now well into the danger zone and prices are falling in most regions.
BusinessWeek on Mortgage Loan Buybacks
by Calculated Risk on 9/25/2006 01:01:00 AM
From BusinessWeek: Bad Blood Over Bad Loans
Mortgage-backed securities issuance soared from $184.5 billion in 2000 to nearly $1 trillion in 2005, generating more than $1 billion in fees last year.The article lists some of the lenders buying back loans: H&R BLock, NetBank and Fremont.
But now that the real estate tide is ebbing, trash is starting to wash up on shore. Mortgage delinquencies are zooming ...
In some cases, the original lenders are taking the biggest hits. In typical deals, banks agree to buy mortgages back from Wall Street in the case of a payment default within the first 90 days. Now some are writing big checks. ...
A few lenders have refused to buy back loans, prompting arbitrations and lawsuits. Bear, Stearns & Co.'s (BSC ) mortgage affiliate, EMC Mortgage Corp. of Irving, Tex., is suing New York lender MortgageIT over $70.5 million in disputed buybacks. ... And Lehman Brothers Inc. (LEH ) is trying to recoup $20 million on toxic loans bought years ago from Beverly Hills Estates Funding Inc., whose principal, Charles Elliott Fitzgerald, is believed to have fled the country to a South Pacific island.And this is probably just the beginning.
Sunday, September 24, 2006
More Builder Incentives
by Calculated Risk on 9/24/2006 11:40:00 PM
Horton hears a ... bust? Click on Ad for larger image.
From the Daytona Beach News advertising section:
How about 30% off the list price? And a free washer, dryer and refrigerator?
Realtors Warmly Welcomed. I bet they are!
A few more: Eagle Homes' ad reads "no money down" and "no mortgage payments for 6 months".
ICI Homes advertises "Up to $50,000 Off" and, as a "special thank you ICI Homes will pay your closing costs".
Mortgage Extraction and the Trade Deficit
by Calculated Risk on 9/24/2006 01:01:00 AM
In the previous post, I graphed GDP growth, with and without mortgage equity withdrawal (MEW), for the last 30 years. Now for a little good news.
Note: the previous post also reviewed the record low equity percentage in household real estate - even though the U.S. housing market has seen significant appreciation.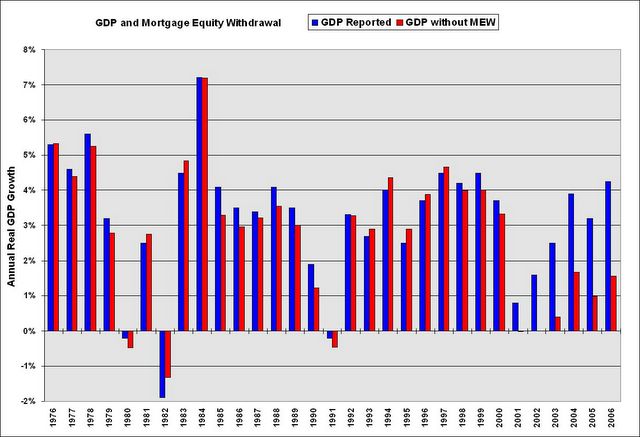 Click on graph for larger image.
This is graph 2 from the previus post and shows real annual GDP growth, with and without MEW, for the last 30 years.
One of the key assumptions is that MEW related consumption is of domestic products and services. Any MEW related consumption of imports does not impact GDP.
Let's review the components of Gross Domestic Product (GDP):
GDP = Consumption (PCE) + Investment + Trade Balance + Government Spending.
So if consumption rises $30 Billion due to MEW, but all of that consumption is of imported products and services (reducing the trade balance by $30 Billion), GDP is not impacted. And there appears to be a correlation between MEW and the trade deficit. Alan Greenspan commented on this relationship in Feb of 2005:
"Interestingly, the change in U.S. home mortgage debt over the past half-century correlates significantly with our current account deficit. To be sure, correlation is not causation, and there have been many influences on both mortgage debt and the current account."The following graph uses MEW (instead of the increases in the mortgage debt) and the trade balance (instead of the current account balance). MEW is probably better than the overall increase in mortgage debt - because much of the increase in mortgage debt is due to residential investment and is not available for consumption.
 Note: The trade balance is inverted since MEW would increase the trade deficit.
MEW and the trade deficit, as a percent of GDP, have tracked each other with a high correlation over the last 30 years. As Greenspan noted correlation is not causation.
However a possible explanation for this correlation is that a disproportionate percentage of MEW, as compared to normal consumption patterns, flows to imports as opposed to consumption of domestic products and services.
This means that the impact of MEW on GDP would be less than in graph 1. That is the good news.
However this would imply potential bad news for U.S. trading partners if MEW continues to decline as expected. And there is a possible impact on interest rates (bad for housing) that I will discuss soon
Friday, September 22, 2006
GDP Growth: With and Without Mortgage Extraction
by Calculated Risk on 9/22/2006 05:35:00 PM
UPDATE: Please see the next post on why MEW that flows to imports wouldn't impact GDP as in graph 2.
The recent Flow of Funds report showed that household mortgages increased $220.3 Billion in Q2 2006, and $436.4 Billion for the first half of 2006. Using a simple formulation(1) for Mortgage Equity Withdrawal (MEW), MEW was $81.6 Billion in Q2 2006. This is substantially below the record $180.1 Billion of MEW in Q3 2005. Click on graph for larger image.
The first graph shows quarterly MEW as a percent of GDP for the last 30 years. There is substantial quarterly variability in MEW, but it appears MEW has fallen, as a percent of GDP, from the levels of the last few years.Using Greenspan's estimate of approximately 50% of MEW flowing through to personal consumption expenditures, it is possible to estimate the impact of MEW on GDP.
This graph, of annual real GDP growth for the last 30 years, clearly shows the unprecedented impact of MEW over the last few years.
(2006: first two quarters)
Using this method, the surge in MEW in the mid to late '80s boosted GDP by an average of about 0.5% per year. Over the last five years, MEW has boosted GDP by an average of 2.2% per year!
UPDATE NOTE: The above calculations and graph assumes that consumption is domestic. In reality a large portion of MEW related consumption probably flows to imports. I'll write more about this.
NOTE: Although this analysis matches MEW to GDP in the quarter the equity was extracted, there is probably a lag from extraction to consumption expenditures. As an example, someone might borrow money in Q4 and buy a new car in Q1 of the following year. So the strong equity extraction at the end of 2005 probably boosted GDP in Q1 2006.
Maybe 50% flowing through to consumption is too high, but the relative impact would be the same. And notice what happened in the early to mid 90s; MEW was negative and was a drag on consumption and GDP. MEW will probably be a drag on GDP for several years in the near future - maybe starting in 2007.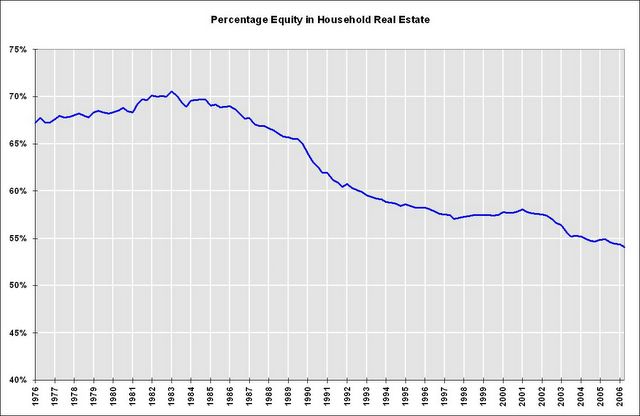 The final graph shows the percentage of equity in household real estate. Currently households have a record low 54.1% equity in their homes.
That may sound like a high percentage of equity, but according to Robert Broeksmit, Chairman of the Residential Board of Governors, Mortgage Bankers Association (from the Senate hearing on Wednesday):
"More than a third of homeowners, approximately 34 percent, own their homes free and clear."This group is probably risk adverse and it's unlikely they will borrow significantly on their homes to fuel consumption. So the debt burden falls on the other 66%.
On the third graph, notice that the percent equity dropped significantly from 1990 to 1996 - during the early '90s housing bust - even though MEW turned negative.
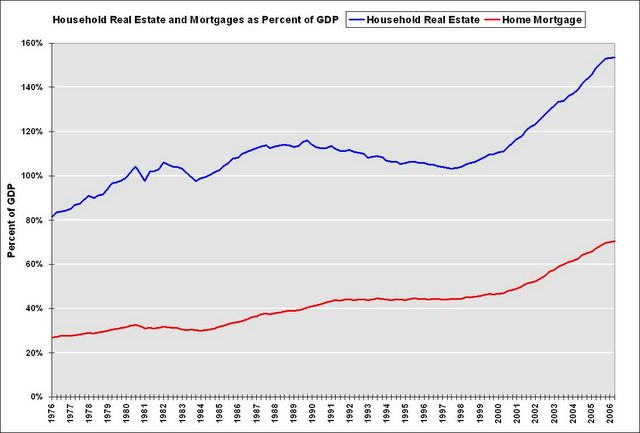 The fourth graph shows what happened during the '90s bust: the value of household real estate to GDP declined for several years, while the growth of mortgage debt kept pace with GDP growth. This lead to a significant decline in homeowners percentage of equity.
From early 1990 to 1996, the percent equity declined from 65% to 58%. Currently the percent equity is at a record low 54.1%. If something similar happens as in the early '90s, the percent equity could easily drop into the high 40% range in the next few years - and remember - that includes the 34% of homeowners with no debt.
This analysis leads me to believe that declining MEW over the next few years will be a significant drag on GDP growth.
Note 1: to calculate MEW, I subtracted 70% of residential investment (RI) from the increase in household mortgages. This is an approximation for identifying and excluding all mortgage debt for New Home purchases and home improvements. The reason I used 70% was a portion of RI is not borrowed, and a portion of RI is for apartments. This is not exact, but it is close.
Rate Cut Probabilities Rise
by Calculated Risk on 9/22/2006 02:32:00 PM
Every day the Cleveland Fed calculates the future Fed Funds Rate probabilities based on current market expectations. Click on graph for larger image.
The Fed Funds Futures are indicating a pause at both the October and December FOMC meetings.
However, market expectations for a rate cut are now higher than expectations for an increase in December.
Perhaps the economy is slowing quicker than many obervers expected. Professor Roubini sure thinks so: U.S. Hard Landing And Recession Steaming Ahead: Now More Likely than a 70% Probability! See Roubini point 5:
5. The Fed will not just pause but stop hiking and then cut rates in the winter (by December or at the latest February). Markets were way behind the curve in their assessment of Fed policy as they were still debating the next hike rather than discussing when the Fed would ease.
Senate Hearing Video
by Calculated Risk on 9/22/2006 11:52:00 AM
Paper-Money has posted the video for the Senate Panel hearing: Assessing Non-Traditional Mortgage Products.
Thursday, September 21, 2006
Hot New Toy?
by Calculated Risk on 9/21/2006 11:24:00 PM
For something a little different, I've heard TMX Elmo is off the charts HOT and is already sold out. Here is the EBay page.
Senate Hearing Audio: Nontraditional Mortgages
by Calculated Risk on 9/21/2006 04:07:00 PM
The complete audio (panels 1 and 2) is here.
Note: the second panel starts at 1 hour 30 minutes into the 3 hour audio.
Morgan Stanley's Berner: The Great Housing Debate
by Calculated Risk on 9/21/2006 02:50:00 PM
Economist Richard Berner believes the housing bust will have less of an impact on the economy than many observers expect. From Berner:
US housing activity is in recession and home prices are decelerating sharply, and those trends likely will intensify. The combination could pare as much as 1½ percentage points from US growth in the second half of 2006, and many are thus concluding that the economy is headed for trouble. We continue to think that there are significant offsets to these drags on economic activity, such as stronger global growth and declining energy quotes. As a result, the prognosis for growth could be stronger than either pessimists or market participants expect (see "Is This What A Soft Landing Feels Like?" Global Economic Forum, September 5, 2006). [emphasis added]Berner comments on the weakness in the housing market, but he believes real prices will not fall significantly:
We’re bearish on housing activity and think the deceleration in prices has further to go. ...That may sound bearish, but Berner is painting a soft landing picture. Berner then addresses mortgage equity extraction and he believes the concerns are overblown:
The pessimists argue that the bursting of a putative housing bubble means that prices could decline significantly. There is some risk that prices could decelerate faster or even decline in real terms — after all, investment and speculative activity has picked up in the past five years. But the character of housing demand makes the much-feared decline in prices on a nationwide basis unlikely ...
Nonetheless, prices may fall in markets that are affected by a weak economy (e.g., Detroit), by high speculative activity (e.g., some condominium markets) or where there is a preponderance of second homes (e.g., in Florida or the Sunbelt). ...
However, the recession in housing activity is a nationwide development and will significantly depress growth. We estimate that the decline in 1-family housing starts directly will cut 0.9 percentage point from US real growth in the second half of 2006 (single-family construction amounts to about 3.3% of GDP; we expect that apartment construction will improve somewhat after eight years of no growth, which has limited supply and helped rents to firm). The plunge in single-family housing construction will cost both output and jobs. We expect that the loss of jobs in residential construction, real estate brokerage, and mortgage finance could amount to 10,000 monthly. ...
Of course, that’s not all. The decline in housing demand probably will crimp spending on furniture, appliances and other household goods ... A 10% decline in such outlays over a year could knock another 0.3% off overall GDP.
...it would be reasonable to think that the surge in housing wealth and home equity extraction has fueled significant spending gains in these discretionary items, that households can postpone such purchases, and that even a deceleration in housing wealth could promote declines in these big-ticket outlays.This is a soft landing scenario.
Reasonable, yes, but not entirely accurate. First, housing activity and big-ticket housing-related durables don’t necessarily march in lockstep anymore. ...
Moreover, and most important, in my view the deceleration in housing wealth will have at most one-fifth the impact on consumer spending that some fear. Some, including former Fed Chairman Greenspan, believe that 50 cents of every additional dollar of home equity extraction has financed consumer outlays. Empirical studies, however, suggest that a $1 decline in real housing wealth would trim spending by at most 11 cents, and some suggest that the effect would be half that magnitude (see “Housing Wealth and Consumer Spending” and “Housing, Mortgages and Consumption: Comparing Australia, the UK and the US,” Global Economic Forum, October 7, 2005 and March 2, 2006, respectively). Of course, that’s not negligible; we estimate that the flattening in real housing wealth in our outlook will pare roughly ½ percentage point from the growth in consumer outlays over the coming year.
I disagree with Berner on several points. I think real prices will fall nationwide, both in nominal and real terms. This is an important difference: first, I believe the psychological impact of falling prices will exacerbate the housing bust, and second, falling prices will have a larger impact on borrowers that have used nontraditional loans as affordability products (Berner didn't address the exotic loan issue). I will address Berner's comments on the impact of mortgage extraction in another post.
Philly Fed: No Growth
by Calculated Risk on 9/21/2006 12:27:00 PM
The Federal Reserve Bank of Philadelphia released September’s Business Outlook Survey today. Here are some excerpts: Click on graph for larger image.
Growth Stalls this MonthBut perhaps the most interesting result was the answer to the special question:
The survey’s broadest measure of manufacturing conditions, the diffusion index of current activity, dropped from 18.5 in August to -0.4 this month. This is the first negative reading in the index since April 2003, although the index registered a zero reading in June 2005. [see chart] ...
Six-Month Forecast Falls Significantly
Expectations for future manufacturing growth fell sharply this month. Indicators for future activity, new orders, shipments, and employment all declined from their August readings. The future general activity index fell from 7.4 to -0.2, its first negative reading since January 2001
"Do you expect the following capital expenditure categories in 2007 to be higher than, lower than, or the same as in the current year?"Overall manufacturers currently have lower expectations for investment in all categories as compared to December 2005, especially investment in structures. This is important because many analysts have pinned their hopes for an economic soft landing on future business investment. And the steep drop in anticipated structure investment is especially critical since it was hoped that jobs lost in residential construction would move to nonresidential construction. Of course this is only for manufacturers, and the survey only covers the Third Federal Reserve District.
Thornberg on Bay Area Housing
by Calculated Risk on 9/21/2006 01:53:00 AM
Professor Thornberg is quoted in the San Mateo County Times: Home sales decline, prices stay flat
"We can say, with some certainty, price appreciation is zero and may even be slightly retracting. The market is flat and the bubble has popped," said Chris Thornberg, an economist with Bay Area-based Beacon Economics.Thornberg's forecast appears to be for 4 to 5 years of flat nominal prices, or about a 15% real price decline.
...
Thornberg of Beacon Economics doesn't expect the Bay Area to see substantial price appreciation — which he defines as being in annual range of 2 to 4 percent — until 2010 or 2011.
The reason for the sluggish forecast is that the soaring rise in home prices in the last few years far exceed the size of mortgages that can be paid by average household incomes, said Thornberg.
Until household income and rents rise significantly, housing appreciation will remain flat, he said.
"This thing hasn't shaken out. Price appreciation has pushed home prices to never-seen before levels. It's going to take some time," said Thornberg.
Wednesday, September 20, 2006
DataQuick: California August Home Sales
by Calculated Risk on 9/20/2006 11:14:00 PM
DataQuick reports California August Home Sales 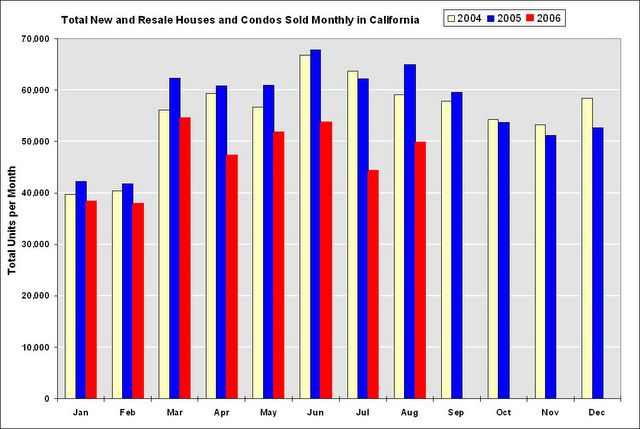 Click on graph for larger image.
A total of 49,800 new and resale houses and condos were sold statewide last month. That's up 12.5 percent from 44,250 for July and down 25.1 percent from a revised 66,500 for August 2005.The data I have only goes back to September 2003, but it appears sales are also running below the 2003 rate.
The median price paid for a home last month was $472,000. That was down 0.6 percent from July's $475,000, and up 3.5 percent from $456,000 for August a year ago.
...
The numbers cover all sales, new and resale, houses and condos.
FOMC Meeting
by Calculated Risk on 9/20/2006 08:11:00 PM
For some excellent analysis, I suggest:
Tim Duy's Fed Watch: Unsatisfying
"Like almost everyone, I was expecting policy to remain essentially unchanged at the conclusion of today’s FOMC meeting. Still, I was left unsatisfied by the accompanying statement, posted by Mark Thoma. At best, its brevity makes it look straightforward. At worst, it looks like something cobbled together because FOMC members were unable to reach a uniform opinion on the state of the economy."William Polley: Fed leaves rates unchanged
"The 30 second summary of which is that the housing slowdown is no longer regarded as "gradual" and that energy prices are not as much of a concern as they were previously.And Brad Delong writes succinctly:
...
Steady as she goes for a few more weeks, watching the housing market as well as the inflation numbers, trying to steer a course between the--hoping that no exogenous winds of change blow them off course."
"Good luck, Ben and company..."
Bay Area: How far will prices fall?
by Calculated Risk on 9/20/2006 06:58:00 PM
In the comments to the previous post I suggested that Bay Area prices might fall 40%+ in real terms over 5 to 7 years. ac asked how I came up with that estimate, and Lester suggested somewhat impolitely that the estimate did not match my "moderate, professorial tone".
First, it's important to distinguish between nominal and real price declines. If the U.S. averages 3% inflation over the next 5 years - and nominal prices stay flat - real prices would decline 16%. Many homeowners would think they "broke even", when in fact the real value of their homes declined 16%. Click on graph for larger image.
Lets look at the previous bust in California in the early '90s in real terms.
For the Bay Area and San Diego, median real prices declined about 25% over a six year period. In Los Angeles median real prices declined about 35%.
NOTE: Prices are from the OFHEO house price index adjusted by CPI less Shelter from the BLS.
If this bust is similar to the early '90s bust in California, we would expect real price declines of 25% to 35% over a 5 to 7 year period. I think this bust will be worse because I believe the current bubble was larger.
In real terms, prices in San Diego are already about 10% below the peak of last year. For the Bay Area, real prices are already about 4.5% below the peak. (based on DataQuick data).
DataQuick: Bay Area home sales decline, prices level off
by Calculated Risk on 9/20/2006 04:11:00 PM
DataQuick reports: Bay Area home sales decline, prices level off
Home sales in the Bay Area declined again last month as prices continued to level off, a real estate information service reported.
...
The median price paid for a Bay Area home was $620,000 last month. That was down 1.1 percent from $627,000 in July, and up 0.2 percent from $619,000 for August a year ago. Last month's year-over- year increase was the lowest since March 2002 when the $381,000 median fell 1.3 percent.
| Bay Area California Median Home Prices | ||||
| Area | Aug '04 | Aug '05 | Aug '06 | Pct Change |
| Alameda | $497K | $586K | $577K | -1.5% |
| Contra Costa | $468K | $567K | $567K | 0.0% |
| Marin | $717K | $822K | $803 | -2.3% |
| Napa | $511K | $603K | $616K | 2.2% |
| San Francisco | $668K | $745K | $750K | 0.7% |
| San Mateo | $649K | $773K | $721K | -6.7% |
| Santa Clara | $539K | $654K | $658K | 0.6% |
| Solano | $377K | $474K | $483K | 1.9% |
| Sonoma | $462K | $554K | $557K | 0.5% |
| Bay Area | $520K | $619K | $620K | 0.2% |
I added the August 2004 median prices to give a two year perspective on prices.
A total of 9,128 new and resale houses and condos were sold in the nine-county region last month. That was up 14.9 percent from 7,941 for July, and down 24.9 percent from 12,154 for August last year, according to DataQuick Information Systems.
Last month was the slowest August since 1997 when 9,080 homes were sold. DataQuick's statistics go back to 1988: the slowest August was in 1992 with 6,326 sales, the strongest was in 2003 with 12,488. The average August sales count since 1988 is 9,530.
| Bay Area California Homes Sold | ||||
| Area | Aug '04 | Aug '05 | Aug '06 | Pct Change |
| Alameda | 2,742 | 2,612 | 1,876 | -28.2% |
| Contra Costa | 2,560 | 2,497 | 1,910 | -23.5% |
| Marin | 478 | 438 | 380 | -13.2% |
| Napa | 226 | 226 | 119 | -47.3% |
| San Francisco | 735 | 662 | 613 | -7.4% |
| San Mateo | 986 | 969 | 792 | -18.3% |
| Santa Clara | 3,017 | 2,832 | 2,126 | -24.9% |
| Solano | 1,015 | 1,016 | 668 | -34.3% |
| Sonoma | 915 | 902 | 644 | -28.6% |
| Bay Area | 12,674 | 12,154 | 9,128 | -24.9% |

In Memoriam: Doris "Tanta" Dungey


| Privacy Policy |
| Copyright © 2007 - 2025 CR4RE LLC |
| Excerpts NOT allowed on x.com |