 RSS Feed
 by Calculated Risk on 9/20/2006 03:40:00 PM
Wednesday, September 20, 2006
Nontraditional Mortgage Guidance:"weeks, not months"
Q: When do you expect to issue the final guidance on nontraditional mortgage guidance?
A: Near term. Weeks, not months.
Q: We were hoping for something more specific.
Senate Hearing: Nontraditional Loans
by Calculated Risk on 9/20/2006 02:36:00 PM
Here is an audio of the Senate hearing (Real Media).
Witness Statements:
Panel 1
Ms. Orice Williams , Director, Government Accountability Office
Ms. Kathryn E. Dick , Deputy Comptroller for Credit and Market Risk, Office of the Comptroller of the Currency
Ms. Sandra F. Braunstein , Director of the Division of Consumer and Community Affairs, Federal Reserve
Ms. Sandra Thompson , Director of the Division of Supervision and Consumer Protection, Federal Deposit Insurance Corporation
Mr. Scott Albinson , Managing Director for Examinations, Supervision, and Enforcement, Office of Thrift Supervision
Ms. Felicia A. Rotellini , Superintendent, Arizona Department of Financial Institutions
Panel 2
Mr. Robert Broeksmit , Chairman of the Residential Board of Governors, Mortgage Bankers Association
Mr. George Hanzimanolis , NAMB President-Elect, Bankers First Mortgage, Inc. testifying on behalf of the National Association of Mortgage Brokers
Mr. William A. Simpson , Chairman, Republic Mortgage Insurance Company testifying on behalf of the Mortgage Insurance Companies of America
Mr. Michael D. Calhoun , President, Center For Responsible Lending
Mr. Allen Fishbein , Director of Housing and Credit Policy, Consumer Federation of America
MBA: Refinance Applications Rise
by Calculated Risk on 9/20/2006 02:03:00 AM
The Mortgage Bankers Association (MBA) reports: Refinance Applications Rise in Latest Survey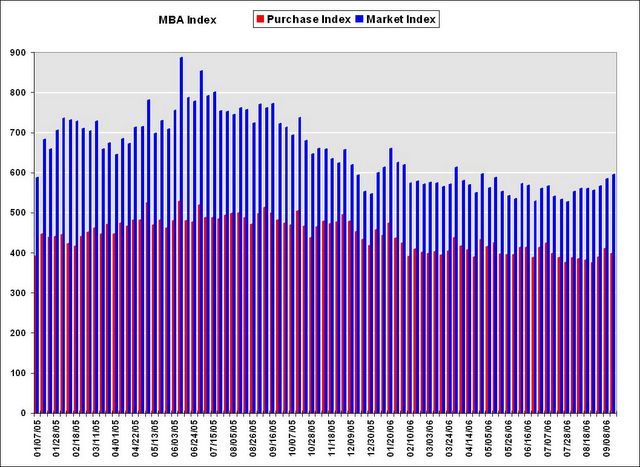 Click on graph for larger image.
The Market Composite Index, a measure of mortgage loan application volume, was 595.8, an increase of 2 percent on a seasonally adjusted basis from 584.2 one week earlier. On an unadjusted basis, the Index increased 12.3 percent compared with the previous week and was down 22.5 percent compared with the same week one year earlier. The previous week was shortened due to the Labor Day holiday.Mortgage rates were mixed:
The seasonally-adjusted Purchase Index decreased by 3 percent to 397.9 from 410.2 the previous week and the Refinance Index increased by 9.5 percent to 1748.7 from 1597 one week earlier.
The average contract interest rate for 30-year fixed-rate mortgages increased to 6.36 percent from 6.32 percent ...Change in mortgage applications from one year ago (from Dow Jones):
The average contract interest rate for one-year ARMs decreased to 5.95 percent from 5.96 percent ...
| Percent Change in Number of Applications | |||
| Applications | Change from one year ago | ||
| Total | -22.5% | ||
| Purchase | -19.8% | ||
| Refi | -25.7% | ||
| Fixed Rate | -19.4% | ||
| ARM | -29.8% | ||
 Purchase activity is off 19.8% from the comparable week last year.
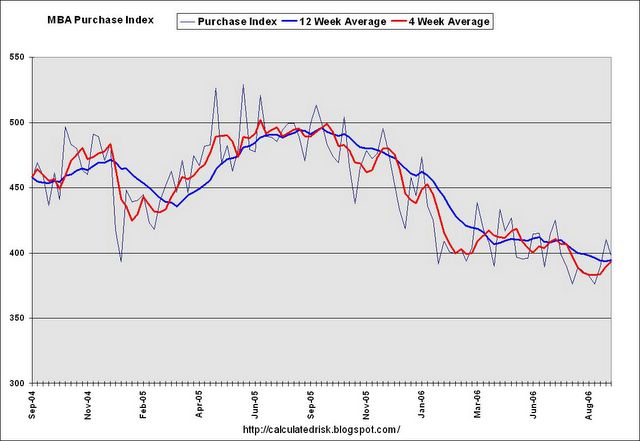
 This graph shows the Purchase Index and the 4 and 12 week moving averages.
Note: Scale does not start at zero to better show changes.
Average year-to-date purchase activity is 13.6% below 2005, and has been running more than 20% below 2005 for the last couple of months.
Tuesday, September 19, 2006
DataQuick: Continued slowdown for Southland home sales
by Calculated Risk on 9/19/2006 06:02:00 PM
DataQuick reports: Continued slowdown for Southland home sales
Home sales in Southern California continued at their slowest pace in nine years as price levels appeared to be nearing a plateau, a real estate information service reported.NOTE: San Diego median prices are below the level of two years ago.
...
The median price paid for a Southland home was $489,000 last month. That was down 0.6 percent from July's $492,000, and up 2.7 percent from $476,000 in August last year. Last month's increase was the smallest since July 1999, when the $193,000 median also rose 2.7 percent from $188,000 a year earlier.
| Southern California Median Home Prices | ||||
| Area | Aug '04 | Aug '05 | Aug '06 | Pct Change |
| Los Angeles | $407K | $494K | $517K | 4.7% |
| Orange County | $543K | $617K | $633K | 2.6% |
| San Diego | $483K | $493K | $482K | -2.2% |
| Riverside | $334K | $388K | $415K | 7.0% |
| San Bernardino | $261K | $344K | $365K | 6.1% |
| Ventura | $514K | $592K | $598K | 1.0% |
| Southern California | $407K | $476K | $489K | 2.7% |
I added the August
A total of 25,628 new and resale homes sold in Los Angeles, Riverside, San Diego, Ventura, San Bernardino and Orange counties last month. That was up 12.8% from 22,712 in July, and down 25.3 percent from 34,292 for August a year ago, according to DataQuick Information Systems.
Sales have declined on a year-over-year basis the last nine months. Last month's sales count was the lowest for any August since 22,308 homes were sold in August 1997. DataQuick's statistics go back to 1988, August sales have varied from 12,769 in 1992 to 35,339 in 1988. An average August has 25,845 sales.
| Southern California Homes Sold | ||||
| Area | Aug '04 | Aug '05 | Aug '06 | Pct Change |
| Los Angeles | 10,710 | 11,653 | 9,193 | -21.1% |
| Orange County | 3,745 | 4,708 | 3,203 | -32.0% |
| San Diego | 5,580 | 5,379 | 3,666 | -31.8% |
| Riverside | 5,579 | 6,542 | 4,879 | -24.4% |
| San Bernardino | 4,319 | 4,522 | 3,611 | -20.1% |
| Ventura | 1,198 | 1,578 | 1,076 | -31.8% |
| Southern California | 31,131 | 34,292 | 25,628 | -25.3% |
Notice that San Diego had declining sales in 2005 compared to 2004. As LA Times writer David Streitfeld noted about the San Diego housing market:
San Diego had the wildest run-up among major California cities, with prices tripling since the mid-1990s. ... The market also began to fade first in San Diego. ...It does appear that San Diego is leading the way, and I think that means declining prices soon in all of SoCal.
Whatever happens [in San Diego], optimists and pessimists agree, will happen later in the rest of the state.
Fed: Household Mortgage Debt Increased $220 Billion in Q2
by Calculated Risk on 9/19/2006 02:27:00 PM
The Federal Reserve released the Q2 2006 Flow of Funds report today.
From MarketWatch (hat tip Paul): Household net worth up 0.1% in second quarter
The net worth of U.S. households increased 0.1% in the second quarter to $53.3 trillion, the slowest gain in nearly four years, the Federal Reserve said Tuesday.
After adjusting for inflation, net worth fell in the quarter.
...
Household assets grew by $332 billion to $66 trillion in the second quarter, while liabilities increased by $278 billion to $12.7 trillion. The value of real estate holdings increased by $402 billion ...
...
Owners' equity in their real estate fell to a record low 54.1% of market value from 54.4% in the first quarter and nearly 58% in 2000.
...
Mortgage debt increased 9%, the slowest pace since the recession of 2001.
 Click on graph for larger image.
Household mortgage debt increased $220.3 Billion in Q2.
This increase in mortgage debt accounted for 80% of the increase in household liabilities for the quarter.
 Even though the rate of increase of mortgage debt has slowed, mortgage debt is still increasing faster than GDP growth. So the ratio of mortgage debt to GDP is still increasing.
Mortgage debt is now at a record 70.6% of GDP.
Look at these all time records:
1) Owner's equity, as a percent of market value, is at an all time low.
2) Mortgage debt, as a percent of GDP, is at an all time high.
3) Mortgage debt service, as a percent of disposable personal income, is at an all time high (from Q1 data, Q2 data will be released soon).
And, according to the Fed estimates, the value of household real estates was still rising in Q2, 2006. Imagine what happens when values start to decline.
Housing Starts and Construction Employment
by Calculated Risk on 9/19/2006 10:48:00 AM
The Census Bureau reports: New Residential Construction in August 2006
Privately-owned housing starts in August were at a seasonally adjusted annual rate of 1,665,000. This is 6.0 percent below the revised July estimate of 1,772,000 and is 19.8 percent below the August 2005 rate of 2,075,000.
Single-family housing starts in August were at a rate of 1,360,000; this is 5.9 percent below the July figure of 1,445,000.
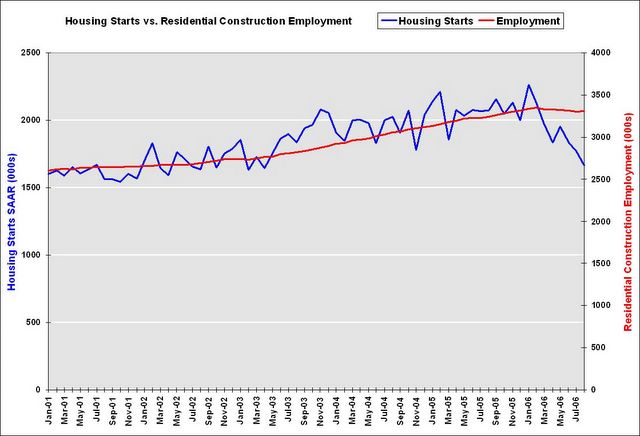 Click on graph for larger image.
Comparing housing starts to residential construction employment (SA), it appears the BLS numbers should indicate housing related job losses soon.
Even if housing stabilizes at this level, there are probably 600K residential construction jobs (BLS reported) that will be lost.
Retailers: NRF Sees Subdued Holiday Gains in 2006
by Calculated Risk on 9/19/2006 12:36:00 AM
The National Retail Federation (NRF) Sees Subdued Holiday Gains in 2006
While consumers have shown a surprising amount of resilience in 2006, retailers can expect a more subdued holiday season. According to the National Retail Federation (NRF), total holiday retail sales are expected to increase 5.0 percent over last year... In comparison, holiday sales in 2005 rose 6.1 percent...Not too bad. And the AP reports: Target Increases Sales Forecast for September
"Consumers have faced a number of economic challenges this year and have taken them in stride," said NRF Chief Economist Rosalind Wells. "Although sales gains will not be as robust as last year, retailers can still expect above-average holiday sales growth."
Over the last ten years, the average percentage increase in sales for the holiday season is 4.6 percent. One-fifth of retail industry sales (19.9%) occur during the holiday season, making it the most important time period of the year for the industry.
Target Corp., the nation's second-largest discounter behind Wal-Mart Stores Inc., increased its sales forecast for September late Monday, a sign that retreating gasoline prices may be providing some relief to shoppers.It looks like the U.S. consumer is still alive and spending.
The Minneapolis-based retailer said in a recorded message that it now projects same-store sales, or sales at stores open at least a year, will increase to 5 percent for September. It had originally expected same-store sales to be up from 3 percent to 5 percent.
So far the impact from the housing bust on the general economy has been limited. This makes sense. I expect the housing bust to impact the economy in three ways: first from the loss of housing related jobs, second from the loss of mortgage equity withdrawal (MEW), and third, from the impact of nontraditional mortgages.
Housing related job losses have been modest so far - although job losses should accelerate in the next few months. Cash-out refinance activity has still been strong and the impact from "toxic loans" has been minor.
So far, so good.
Monday, September 18, 2006
NAHB: Builder Confidence Falls to 15 Year Low
by Calculated Risk on 9/18/2006 12:50:00 PM
UPDATE: The National Association of Home Builders reports: Builder Confidence Slips Further in September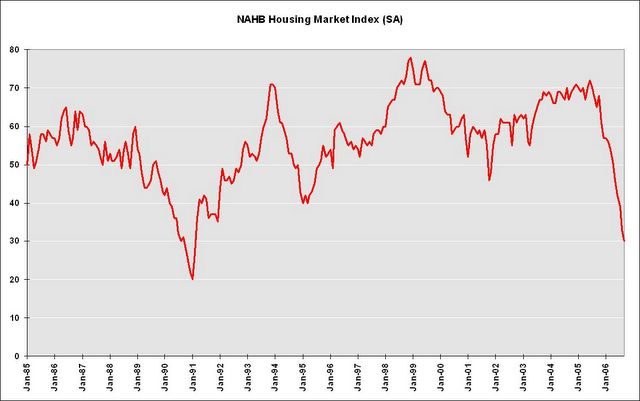
Click on graph for larger image.
Reflecting increasing builder concerns about conditions in the market for new single-family homes, the National Association of Home Builders/Wells Fargo Housing Market Index (HMI) declined for an eighth consecutive month to a level of 30 in September. This amounted to a three-point drop from an upwardly revised 33 reading in August, and is the lowest level the index has reached since February of 1991.Once again this shows that the housing bust is national and is getting worse.
"Builders are adopting an increasingly cautious attitude in their near-term outlook for new-home sales," said NAHB Chief Economist David Seiders. "They’re experiencing falling sales, rising sales cancellations, and increasing inventories of unsold units. And although many builders are offering substantial incentives to bolster sales and limit cancellations, many potential buyers now are waiting on the sidelines to see how the market shakes out before proceeding with a home purchase."
"We are in the midst of an anticipated adjustment period as the housing market subsides from the record-breaking and unsustainable highs of the past few years," Seiders noted. "Our forecast projects the numbers flattening out around the middle of next year and gradually moving back up towards trend in 2008."
...
Two of the three component indexes declined in August. The component that gauges current single-family home sales declined five points to 32, while the component gauging expected sales in the next six months fell four points to 37. The component gauging traffic of prospective buyers remained even from last month, at 22.
The HMI fell in three out of four regions in September. The largest decline was registered in the Northeast, where a six-point drop brought the HMI to 28. The HMI fell five points to 38 in the West and fell three points to 38 in the South. The HMI held steady at 16 in the Midwest, where fundamentally weak economic conditions continue to weigh on the market.
Sunday, September 17, 2006
NY Times: Who Bears the Risk?
by Calculated Risk on 9/17/2006 01:21:00 AM
The NY Times asks: Who Bears the Risk?
The housing boom would never have lasted as long as it did if mortgage lenders had to worry about being paid back in full. But instead of relying on borrowers to repay, most lenders quickly sell the loans ...Of those us that thought there was a housing bubble, Dr. Hamilton asked last year: If there is a housing bubble, "[W]hy are banks making loans to people who aren't going to be able to pay them back?"
As the boom thundered on, the pool of available credit grew larger than the pool of creditworthy borrowers, resulting in an explosion of risky mortgages with features like no money down, interest-only payments and super-low teaser rates. Investors ... currently hold $2 trillion in mortgage-backed securities from investment banks, triple the amount from three years ago. Investors also own $4 trillion in mortgage-backed securities from government-sponsored agencies.
... everyone knows that if mortgage defaults should rise, damage could reverberate throughout the financial system. So far, defaults have inched up. But many homeowners are at a dangerous juncture. Interest rates on adjustable mortgages are rising as home values are weakening, precluding for many the chance to refinance. Economists calculate that $750 billion of outstanding mortgage debt is now at measurable risk of default — about 7 percent of the total.
This is a great question, and the NY Times hints at a possible answer. "In a market so vast and dynamic" it is possible that numerous participants are underestimating the systemic risk.
UPDATE: Tanta understands this market far better than I can ever hope to - I'll post her comments in full. From Tanta (THANK YOU!):
Let me have some coffee and some time to ponder the wisdom of the NYT Editorial Board (*shakes head like Labrador Retriever exiting swimming pool*) and I shall try to have something worthwhile to say.To add to Tanta's comments, here is the story on H&R Block:
First thought of the day, meanwhile: selling loans in the secondary market is, of course, a way of dispersing default risk. But that isn't the only, or even the main reason banks sell loans. There is the matter of interest rate risk (prepayment, duration) for one big thing, plus capital needs and general balance sheet management, plus the desire to book gain on sale right now versus future accrual income. This is important to understand because in reality some banks end up selling/securitizing their best loans (from a pure credit risk standpoint) and keeping the weakest credit risk on their books, even in times like the present with record rates of sale/securitization. You miss this dynamic if you assume that the primary reason for loan sales is to pass off credit risk.
It's also harder to completely pass through credit risk than the NYT probably thinks. There are reps and warranties in every loan sale that can come back to bite the seller of loans even without explicit recourse agreements--H&R Block just recently got its ass bitten by that, as an example. If and when credit risk starts to rise, there's a huge push-back in the industry, as every current holder of toxicity tries to put it back through the chain to the originator. That means that if and when the originator has to take back an impaired loan, it is generally at the wrong time, the wrong price, and the wrong market for resale. So even if the loan comes current or otherwise cures, it still gets written down relative to its original market value. At a certain point, you can end up wishing the damn thing had gone into foreclosure, because you'd have lost less money on it. There is no such thing as "pure" credit risk, in other words.
If that made a limited amount of sense, blame it on caffeine imbalance in my cranial portfolio. I'll be back when I have hedged my coherence gap.
... early defaults have forced lenders such as NetBank Inc., Fremont General Corp. and H&R Block Inc. to buy back loans already sold to whole-loan acquirers, particularly Wall Street investment banks that pool and package those loans into asset-backed securities and then sell them to large investors such as insurance companies and hedge funds. The buybacks, in turn, have led lenders to incur losses and set aside more money in their reserve funds for potential loan repurchases in the future. ... H&R Block told investors ... "an increase in early payment delinquencies" and the resulting "higher level of repurchase requests from loan buyers" led it to increase its loan reserves. ...Original Post: I am reminded of this quote:
"A sound banker, alas, is not one who foresees danger and avoids it, but one who, when he is ruined, is ruined in a conventional way along with his fellows, so that no one can really blame him."John Maynard Keynes, "Consequences to the Banks of a Collapse in Money Values", 1931
Friday, September 15, 2006
Witness List Released for Senate Hearing: Nontraditional Mortgages
by Calculated Risk on 9/15/2006 02:11:00 PM
The witness list was released this morning for the Senate hearing on Assessing Non-Traditional Mortgage Products. The hearing is Wednesday, September 20, at 10 AM ET.
The first panel will be mostly representatives from the regulatory agencies responsible for the new guidance. One insider suggested the OCC is pushing hard to release the new guidance, and some of the other agencies may be dragging their feet. So this might be interesting.
Panel 1
Ms. Orice Williams , Director, Government Accountability Office
Ms. Kathryn E. Dick , Deputy Comptroller for Credit and Market Risk, Office of the Comptroller of the Currency
Ms. Sandra F. Braunstein , Director of the Division of Consumer and Community Affairs, Federal Reserve
Ms. Sandra Thompson , Director of the Division of Supervision and Consumer Protection, Federal Deposit Insurance Corporation
Mr. Scott Albinson , Managing Director for Examinations, Supervision, and Enforcement, Office of Thrift Supervision
The MBA and the Mortgage Brokers Association oppose the new guidance, or at least want it neutered. The last three panel members will be arguing the guidance is necessary and should have some teeth.
Panel 2
Mr. Robert Broeksmit , Chairman of the Residential Board of Governors, Mortgage Bankers Association
Mr. George Hanzimanolis , NAMB President-Elect, Bankers First Mortgage, Inc. testifying on behalf of the National Association of Mortgage Brokers
Mr. William A. Simpson , Chairman, Republic Mortgage Insurance Company testifying on behalf of the Mortgage Insurance Companies of America
Mr. Michael D. Calhoun , President, Center For Responsible Lending
Mr. Allen Fishbein , Director of Housing and Credit Policy, Consumer Federation of America
The UberNerds will be having fun on Wednesday (a hat tip to Tanta!).

In Memoriam: Doris "Tanta" Dungey


| Privacy Policy |
| Copyright © 2007 - 2023 CR4RE LLC |