 RSS Feed
 by Calculated Risk on 8/19/2022 08:31:00 AM
Friday, August 19, 2022
LA Port Traffic: Mostly Steady in July
Notes: The expansion to the Panama Canal was completed in 2016 (As I noted a few years ago), and some of the traffic that used the ports of Los Angeles and Long Beach is probably going through the canal. This might be impacting TEUs on the West Coast.
Container traffic gives us an idea about the volume of goods being exported and imported - and usually some hints about the trade report since LA area ports handle about 40% of the nation's container port traffic.
The following graphs are for inbound and outbound traffic at the ports of Los Angeles and Long Beach in TEUs (TEUs: 20-foot equivalent units or 20-foot-long cargo container).
To remove the strong seasonal component for inbound traffic, the first graph shows the rolling 12-month average.
 Click on graph for larger image.
On a rolling 12-month basis, inbound traffic increased 0.5% in July compared to the rolling 12 months ending in June. Outbound traffic was increased 0.1% compared to the rolling 12 months ending the previous month.
The 2nd graph is the monthly data (with a strong seasonal pattern for imports).
 Usually imports peak in the July to October period as retailers import goods for the Christmas holiday, and then decline sharply and bottom in February or March depending on the timing of the Chinese New Year.
Imports were up 1% YoY in July, and exports were up 6% YoY.
It is possible that exports have bottomed after declining for several years (even prior to pandemic).
Thursday, August 18, 2022
Hotels: Occupancy Rate Down 4.6% Compared to Same Week in 2019
by Calculated Risk on 8/18/2022 02:50:00 PM
Showing continued alignment with seasonal patterns, U.S. hotel performance fell slightly from the previous week, but showed improved comparisons with 2019, according to STR‘s latest data through Aug. 13.The following graph shows the seasonal pattern for the hotel occupancy rate using the four-week average.
Aug. 7-13, 2022 (percentage change from comparable week in 2019*):
• Occupancy: 68.5% (-4.6%)
• Average daily rate (ADR): $152.34 (+15.8%)
• Revenue per available room (RevPAR): $104.30 (+10.5%)
*Due to the pandemic impact, STR is measuring recovery against comparable time periods from 2019.
emphasis added
 Click on graph for larger image.
The red line is for 2022, black is 2020, blue is the median, and dashed light blue is for 2021. Dashed purple is 2019 (STR is comparing to a strong year for hotels).
The 4-week average of the occupancy rate is just below the median rate for the previous 20 years (Blue).
Note: Y-axis doesn't start at zero to better show the seasonal change.
The 4-week average of the occupancy rate has peaked seasonally and will now decline into the Fall.
More Analysis on July Existing Home Sales
by Calculated Risk on 8/18/2022 10:46:00 AM
Today, in the CalculatedRisk Real Estate Newsletter: NAR: Existing-Home Sales Decreased to 4.81 million SAAR in July
Excerpt:
ales in July (4.81 million SAAR) were down 5.9% from the previous month and were 20.2% below the July 2021 sales rate. Sales are now below pre-pandemic levels and, excluding the pandemic decline, sales are the lowest level since 2014.There is much more in the article. You can subscribe at https://calculatedrisk.substack.com/ (Most content is available for free, so please subscribe).
...
The third graph shows existing home sales for each month, Not Seasonally Adjusted (NSA), for a few selected periods. Black and light Purple are the maximum sales per month during the bubble (2005) and the minimum sales during the bust (2008 - 2011). The most recent four years are shown (2019 through 2022).
Sales NSA in July (453,000) were 22.4% below sales in July 2021 (584,000). Sales NSA year-to-date are down 10.3% compared to the same period in 2021.
This decrease, NSA, was similar to change in the markets I track each month.
...
Key point on Timing of Sales
Existing home sales are reported when the transaction closes. Sales in July were mostly for contracts signed in June and July. Recent data shows a significant slowdown in activity starting in May and decelerating further in June.
My sense is contracts for sales really declined in June, and that will show up as closed sales in July and August - so we should expect a further decline in existing home sales next month.

NAR: Existing-Home Sales Decreased to 4.81 million SAAR in July
by Calculated Risk on 8/18/2022 10:12:00 AM
From the NAR: Existing-Home Sales Retreated 5.9% in July
Existing-home sales sagged for the sixth straight month in July, according to the National Association of REALTORS®. All four major U.S. regions recorded month-over-month and year-over-year sales declines.
Total existing-home sales, completed transactions that include single-family homes, townhomes, condominiums and co-ops, slipped 5.9% from June to a seasonally adjusted annual rate of 4.81 million in July. Year-over-year, sales fell 20.2% (6.03 million in July 2021).
...
Total housing inventory registered at the end of July was 1,310,000 units, an increase of 4.8% from June and unchanged from the previous year. Unsold inventory sits at a 3.3-month supply at the current sales pace, up from 2.9 months in June and 2.6 months in July 2021.
emphasis added
 Click on graph for larger image.
This graph shows existing home sales, on a Seasonally Adjusted Annual Rate (SAAR) basis since 1993.
Sales in July (4.81 million SAAR) were down 5.9% from the previous month and were 20.2% below the July 2021 sales rate.
The second graph shows nationwide inventory for existing homes.
 According to the NAR, inventory increased to 1.31 million in July from 1.25 million in June.
Headline inventory is not seasonally adjusted, and inventory usually decreases to the seasonal lows in December and January, and peaks in mid-to-late summer.
The last graph shows the year-over-year (YoY) change in reported existing home inventory and months-of-supply. Since inventory is not seasonally adjusted, it really helps to look at the YoY change. Note: Months-of-supply is based on the seasonally adjusted sales and not seasonally adjusted inventory.
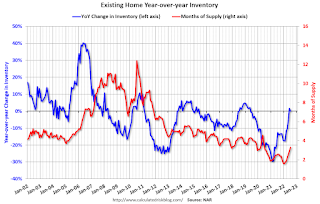 Inventory was unchanged year-over-year (blue) in July compared to July 2021.
Months of supply (red) increased to 3.3 months in July from 2.9 months in June.
This was below the consensus forecast. I'll have more later.
The last graph shows the year-over-year (YoY) change in reported existing home inventory and months-of-supply. Since inventory is not seasonally adjusted, it really helps to look at the YoY change. Note: Months-of-supply is based on the seasonally adjusted sales and not seasonally adjusted inventory.
 Inventory was unchanged year-over-year (blue) in July compared to July 2021.
 Months of supply (red) increased to 3.3 months in July from 2.9 months in June.
This was below the consensus forecast. I'll have more later.
Weekly Initial Unemployment Claims decrease to 250,000
by Calculated Risk on 8/18/2022 08:34:00 AM
The DOL reported:
In the week ending August 13, the advance figure for seasonally adjusted initial claims was 250,000, a decrease of 2,000 from the previous week's revised level. The previous week's level was revised down by 10,000 from 262,000 to 252,000. The 4-week moving average was 246,750, a decrease of 2,750 from the previous week's revised average. The previous week's average was revised down by 2,500 from 252,000 to 249,500.The following graph shows the 4-week moving average of weekly claims since 1971.
emphasis added
 Click on graph for larger image.
The dashed line on the graph is the current 4-week average. The four-week average of weekly unemployment claims decreased to 246,750.
The previous week was revised down.
Weekly claims were below the consensus forecast.
Wednesday, August 17, 2022
Thursday: Unemployment Claims, Philly Fed Mfg, Existing Home Sales
by Calculated Risk on 8/17/2022 09:02:00 PM
Thursday:
• At 8:30 AM ET, The initial weekly unemployment claims report will be released. The consensus is for 265 thousand up from 262 thousand last week.
• Also at 8:30 AM, the Philly Fed manufacturing survey for August. The consensus is for a reading of -5.0, up from -12.3.
• At 10:00 AM, Existing Home Sales for July from the National Association of Realtors (NAR). The consensus is for 4.88 million SAAR, down from 5.12 million last month.
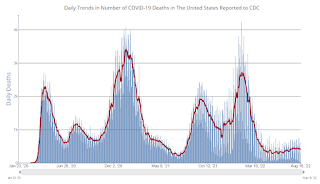
On COVID (focus on hospitalizations and deaths):
Hospitalizations have almost quadrupled from the lows in April 2022.
 Click on graph for larger image.
This graph shows the daily (columns) and 7-day average (line) of deaths reported.
| COVID Metrics | ||||
|---|---|---|---|---|
| Now | Week Ago | Goal | ||
| New Cases per Day2 | 98,940 | 107,899 | ≤5,0001 | |
| Hospitalized2 | 35,139 | 37,092 | ≤3,0001 | |
| Deaths per Day2 | 398 | 426 | ≤501 | |
| 1my goals to stop daily posts, 27-day average for Cases, Currently Hospitalized, and Deaths 🚩 Increasing 7-day average week-over-week for Cases, Hospitalized, and Deaths ✅ Goal met. | ||||
 Click on graph for larger image.
This graph shows the daily (columns) and 7-day average (line) of deaths reported.
Average daily deaths bottomed in July 2021 at 214 per day.
FOMC Minutes "Participants anticipated that this slowdown in housing activity would continue"
by Calculated Risk on 8/17/2022 02:10:00 PM
From the Fed: Minutes of the Federal Open Market Committee, July 26-27, 2022. Excerpt on housing and policy:
Participants also observed that housing activity had weakened notably, reflecting the impact of higher mortgage interest rates and house prices on home affordability. Participants anticipated that this slowdown in housing activity would continue and also expected higher borrowing costs to lead to a slowing in other interest-sensitive household expenditures, such as purchases of durable goods.
...
In their assessment of the policy outlook, market participants expected significant policy tightening in coming meetings as the Committee continued to respond to the current elevated level of inflation. Nearly all respondents to the Desk survey anticipated a 75 basis point increase in the target range at the current meeting, and most expected a 50 basis point increase in September to follow.
emphasis added
4th Look at Local Housing Markets in July, California Sales off 31%, July Forecast
by Calculated Risk on 8/17/2022 12:45:00 PM
Today, in the Calculated Risk Real Estate Newsletter: 4th Look at Local Housing Markets in July, California Sales off 31%, July Forecast
A brief excerpt:
California Home Sales Down 31% in July, Prices DeclineThere is much more in the article. You can subscribe at https://calculatedrisk.substack.com/Closed escrow sales of existing, single-family detached homes in California totaled a seasonally adjusted annualized rate of 295,460 in July, according to information collected by C.A.R. from more than 90 local REALTOR® associations and MLSs statewide. … July’s sales pace was down 14.4 percent on a monthly basis from 344,970 in June and down 31.1 percent from a year ago, when 428,980 homes were sold on an annualized basis. July marked the fourth consecutive monthly decline and the 13th straight annual decline....
...
California’s median home price declined 3.5 percent in July to $833,910 from the $863,790 recorded in June. The July price was 2.8 percent higher than the $811,170 recorded last July and was the smallest year-over-year price gain in more than two years.
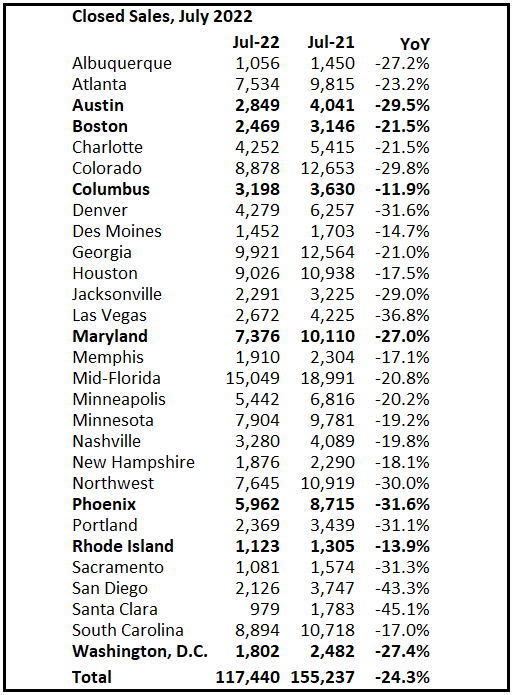
And a table of July sales. Sales in these areas were down 24.3% YoY, Not Seasonally Adjusted (NSA). Contracts for sales in July were mostly signed in May and June, and we are seeing the impact of higher mortgage rates on July closings.
Last month, all local markets I track were down 15.9% YoY, NSA. This appears to be another step down in sales, although there was one less selling day in July this year than in July 2021.
...
More local markets to come!
Retail Sales "Unchanged" in July
by Calculated Risk on 8/17/2022 08:39:00 AM
On a monthly basis, retail sales were unchanged from June to July (seasonally adjusted), and sales were up 10.3 percent from July 2021.
From the Census Bureau report:
Advance estimates of U.S. retail and food services sales for July 2022, adjusted for seasonal variation and holiday and trading-day differences, but not for price changes, were $682.8 billion, virtually unchanged from the previous month, but 10.3 percent above July 2021. ... The May 2022 to June 2022 percent change was revised from up 1.0 percent to up 0.8 percent.
emphasis added
 Click on graph for larger image.
This graph shows retail sales since 1992. This is monthly retail sales and food service, seasonally adjusted (total and ex-gasoline).
Retail sales ex-gasoline were up 0.2% in July.
The second graph shows the year-over-year change in retail sales and food service (ex-gasoline) since 1993.
Retail and Food service sales, ex-gasoline, increased by 7.1% on a YoY basis.
 Sales in July were slightly below expectations, and sales in May and June were revised down, combined.
MBA: Mortgage Applications Decrease in Latest Weekly Survey
by Calculated Risk on 8/17/2022 07:00:00 AM
From the MBA: Mortgage Applications Decrease in Latest MBA Weekly Survey
Mortgage applications decreased 2.3 percent from one week earlier, according to data from the Mortgage Bankers Association’s (MBA) Weekly Mortgage Applications Survey for the week ending August 12, 2022.
... The Refinance Index decreased 5 percent from the previous week and was 82 percent lower than the same week one year ago. The seasonally adjusted Purchase Index decreased 1 percent from one week earlier. The unadjusted Purchase Index decreased 2 percent compared with the previous week and was 18 percent lower than the same week one year ago.
“Mortgage application activity was lower last week, with overall applications declining over two percent to their lowest level since 2000. Home purchase applications continued to be held down by rapidly drying up demand, as high mortgage rates, challenging affordability, and a gloomier outlook of the economy kept buyers on the sidelines,” said Joel Kan, MBA’s Associate Vice President of Economic and Industry Forecasting. “However, if home price growth slows more significantly and mortgage rates move lower, we might see some purchase activity return later in the year. The 30-year fixed rate stayed more than two percentage points higher than a year ago at 5.45 percent but was down over 50 basis points from the June 2020 high of 5.98 percent, providing some relief for buyers in the market. The refinance index, however, fell five percent to its lowest level since November 2000, driven by a six percent drop in conventional refinance applications.”
Added Kan, “Refinance applications increased over three percent but remained more than 80 percent lower than a year ago in this higher rate environment.”
...
The average contract interest rate for 30-year fixed-rate mortgages with conforming loan balances ($647,200 or less) decreased to 5.45 percent from 5.47 percent, with points decreasing to 0.57 from 0.80 (including the origination fee) for 80 percent loan-to-value ratio (LTV) loans.
emphasis added
 Click on graph for larger image.
The first graph shows the refinance index since 1990.
With higher mortgage rates, the refinance index has declined sharply over the last several months.
The refinance index is at the lowest level since the year 2000.
The second graph shows the MBA mortgage purchase index
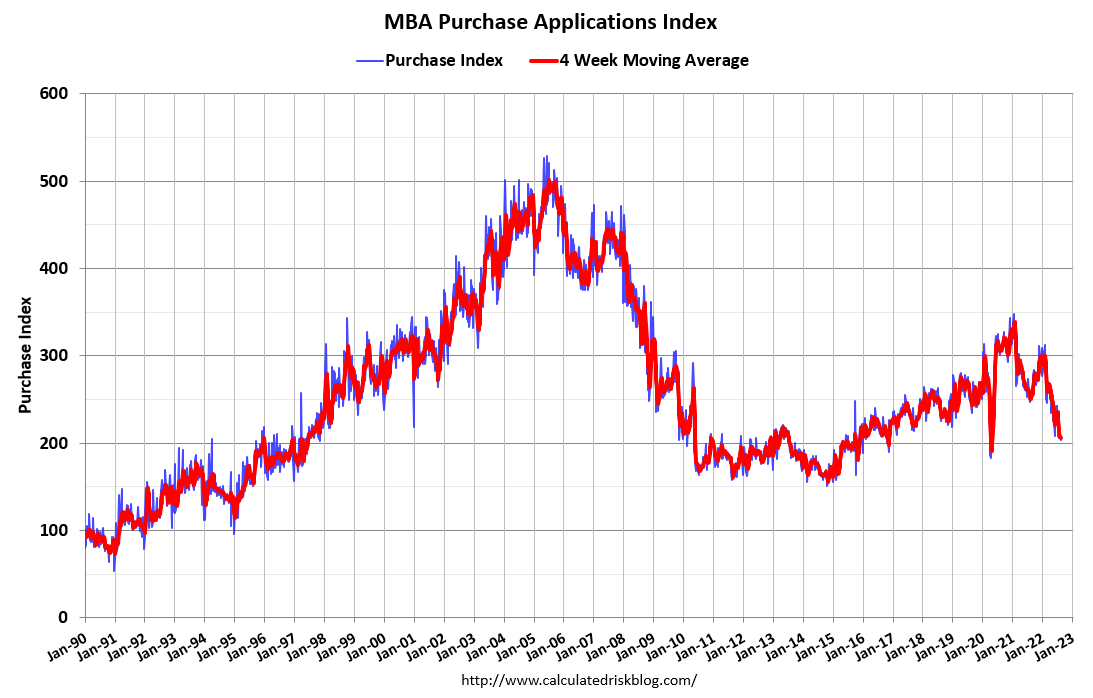 According to the MBA, purchase activity is down 18% year-over-year unadjusted.
The purchase index is now only 12% above the pandemic low.
Note: Red is a four-week average (blue is weekly).
Note: Red is a four-week average (blue is weekly).


