 RSS Feed
 by Calculated Risk on 8/05/2022 09:09:00 PM
Friday, August 05, 2022
COVID August 5, 2022, Update on Cases, Hospitalizations and Deaths
On COVID (focus on hospitalizations and deaths):
Hospitalizations have almost quadrupled from the lows in April 2022.
 Click on graph for larger image.
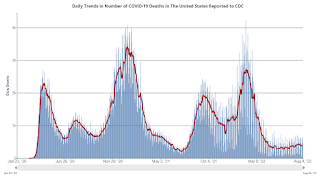
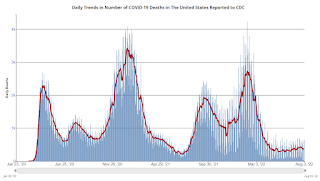
This graph shows the daily (columns) and 7-day average (line) of deaths reported.
| COVID Metrics | ||||
|---|---|---|---|---|
| Now | Week Ago | Goal | ||
| New Cases per Day2 | 114,830 | 125,797 | ≤5,0001 | |
| Hospitalized2 | 37,112 | 37,573 | ≤3,0001 | |
| Deaths per Day2 | 393 | 405 | ≤501 | |
| 1my goals to stop daily posts, 27-day average for Cases, Currently Hospitalized, and Deaths 🚩 Increasing 7-day average week-over-week for Cases, Hospitalized, and Deaths ✅ Goal met. | ||||
 Click on graph for larger image.
This graph shows the daily (columns) and 7-day average (line) of deaths reported.
Average daily deaths bottomed in July 2021 at 214 per day.
New Home Cancellations increased Sharply in Q2
by Calculated Risk on 8/05/2022 02:06:00 PM
Today, in the Calculated Risk Real Estate Newsletter: New Home Cancellations increased Sharply in Q2
A brief excerpt:
First, a few quotes from some Q2 SEC filings:There is much more in the article. You can subscribe at https://calculatedrisk.substack.com/"We believe the recent increases in interest rates during 2022 have caused buyer apprehension, affordability concerns, and an increase in cancellations.", Taylor Morrison Q2 SEC Filing
"The magnitude and speed of these recent rate increases has caused many buyers to pause and reconsider a home purchase, resulting in lower gross demand and higher cancellations during the second quarter.”, MDC Holdings Q2 SEC Filing
"New orders weakened during the second quarter of 2022 in many of our markets and we experienced a higher than normal cancellation rate during the second quarter of 2022", LGI Homes Q2 SEC Filing
emphasis addedHere is a table of selected public builders and the currently reported cancellation rate (I’m still gathering data). There is some seasonality to cancellation rates.
Disclaimer: the cancellation rates are from SEC filings only, and while deemed to be reliable is not guaranteed.
Cancellation rates clearly increased in Q2.

Used Vehicle Wholesale Prices Decreased 0.1% in July
by Calculated Risk on 8/05/2022 01:45:00 PM
From Manheim Consulting today: Wholesale Used-Vehicle Prices Decrease Minimally in July From Seasonal Adjustment
Wholesale used-vehicle prices (on a mix, mileage, and seasonally adjusted basis) decreased 0.1% in July from June. The Manheim Used Vehicle Value Index declined to 219.6, up 12.5% from a year ago. The non-adjusted price change in July decreased 3.2% compared to June, leaving the unadjusted average price up 10.2% year over year.
emphasis added
 Click on graph for larger image.
This index from Manheim Consulting is based on all completed sales transactions at Manheim’s U.S. auctions.
The Manheim index suggests used car prices decreased slightly in July and are up 12.5% year-over-year (YoY).
The YoY change is mostly getting smaller. This index was up 45% YoY in January.
Comments on July Employment Report
by Calculated Risk on 8/05/2022 10:38:00 AM
Today we celebrate the recovery of all the jobs lost in 2020, and the unemployment rate matching the lowest level since 1969.
The headline jobs number in the July employment report was well above expectations, and employment for the previous two months was revised up by 28,000, combined. The participation rate decreased slightly, and the employment-population ratio increased slightly. The unemployment rate declined to 3.5%.
Leisure and hospitality gained 96 thousand jobs in July. At the beginning of the pandemic, in March and April of 2020, leisure and hospitality lost 8.20 million jobs, and are now down 1.21 million jobs since February 2020. So, leisure and hospitality has now added back about 85% all of the jobs lost in March and April 2020.
Construction employment increased 32 thousand and is now 82 thousand above the pre-pandemic level.
Manufacturing added 30 thousand jobs and is now 41 thousand above the pre-pandemic level.
Earlier: July Employment Report: 528 thousand Jobs, 3.5% Unemployment Rate
In July, the year-over-year employment change was 6.15 million jobs.
Prime (25 to 54 Years Old) Participation
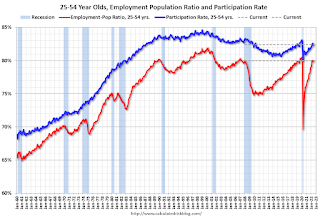 Since the overall participation rate has declined due to cyclical (recession) and demographic (aging population, younger people staying in school) reasons, here is the employment-population ratio for the key working age group: 25 to 54 years old.
The 25 to 54 participation rate increased in July to 82.4% from 82.3% in June, and the 25 to 54 employment population ratio increased to 80.0% from 79.8% the previous month.
Both are slightly below the pre-pandemic levels and indicate almost all of the prime age workers have returned to the labor force.
Part Time for Economic Reasons
 From the BLS report:
These workers are included in the alternate measure of labor underutilization (U-6) that was unchanged at 6.7% from 6.7% in the previous month. This is down from the record high in April 22.9% for this measure since 1994. This measure is lower than the 7.0% in February 2020 (pre-pandemic).
Unemployed over 26 Weeks
 This graph shows the number of workers unemployed for 27 weeks or more.
According to the BLS, there are 1.067 million workers who have been unemployed for more than 26 weeks and still want a job, down from 1.336 million the previous month.
This is back to pre-pandemic lows.
Summary:
The headline monthly jobs number was well above expectations and employment for the previous two months was revised up by 28,000, combined.
Part Time for Economic Reasons
 From the BLS report:
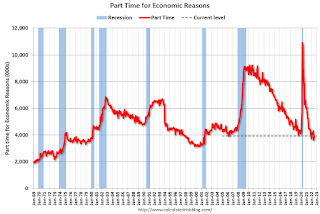
"The number of persons employed part time for economic reasons increased by 303,000 to 3.9 million in July. This rise reflected an increase in the number of persons whose hours were cut due to slack work or business conditions. The number of persons employed part time for economic reasons is below its February 2020 level of 4.4 million. These individuals, who would have preferred full-time employment, were working part time because their hours had been reduced or they were unable to find full-time jobs."The number of persons working part time for economic reasons increased in July to 3.924 million from 3.621 million in June. This is below pre-recession levels.
These workers are included in the alternate measure of labor underutilization (U-6) that was unchanged at 6.7% from 6.7% in the previous month. This is down from the record high in April 22.9% for this measure since 1994. This measure is lower than the 7.0% in February 2020 (pre-pandemic).
Unemployed over 26 Weeks
 This graph shows the number of workers unemployed for 27 weeks or more.
 According to the BLS, there are 1.067 million workers who have been unemployed for more than 26 weeks and still want a job, down from 1.336 million the previous month.
This is back to pre-pandemic lows.
Summary:
The headline monthly jobs number was well above expectations and employment for the previous two months was revised up by 28,000, combined.
The headline unemployment rate declined to 3.5%, matching the lowest level in over 50 years.
Overall, this was another very strong employment report.
July Employment Report: 528 thousand Jobs, 3.5% Unemployment Rate
by Calculated Risk on 8/05/2022 08:43:00 AM
From the BLS:
Total nonfarm payroll employment rose by 528,000 in July, and the unemployment rate edged down to 3.5 percent, the U.S. Bureau of Labor Statistics reported today. Job growth was widespread, led by gains in leisure and hospitality, professional and business services, and health care. Both total nonfarm employment and the unemployment rate have returned to their February 2020 pre-pandemic levels.
...
The change in total nonfarm payroll employment for May was revised up by 2,000, from +384,000 to +386,000, and the change for June was revised up by 26,000, from +372,000 to +398,000. With these revisions, employment in May and June combined is 28,000 higher than previously reported.
emphasis added
 Click on graph for larger image.
The first graph shows the job losses from the start of the employment recession, in percentage terms.
The current employment recession was by far the worst recession since WWII in percentage terms.
However, 29 months after the onset of the current employment recession, all of the jobs have returned.
 The second graph shows the year-over-year change in total non-farm employment since 1968.
In July, the year-over-year change was 6.15 million jobs. This was up significantly year-over-year.
Total payrolls increased by 528 thousand in July. Private payrolls increased by 471 thousand, and public payrolls increased 57 thousand.
Payrolls for May and June were revised up 28 thousand, combined.
The third graph shows the employment population ratio and the participation rate.
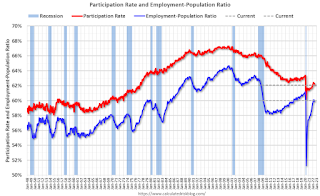 The Labor Force Participation Rate decreased to 62.1% in July, from 62.2% in June. This is the percentage of the working age population in the labor force.
The Employment-Population ratio increased to 60.0% from 59.9% (blue line).
I'll post the 25 to 54 age group employment-population ratio graph later.
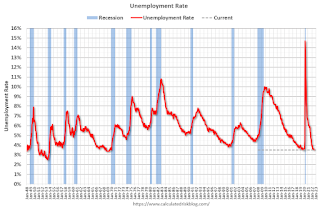 The fourth graph shows the unemployment rate.
The unemployment rate was decreased in July to 3.5% from 3.6% in June.
This was well above consensus expectations; and May and June payrolls were revised up by 28,000 combined.
 The second graph shows the year-over-year change in total non-farm employment since 1968.
In July, the year-over-year change was 6.15 million jobs. This was up significantly year-over-year.
Total payrolls increased by 528 thousand in July. Private payrolls increased by 471 thousand, and public payrolls increased 57 thousand.
Payrolls for May and June were revised up 28 thousand, combined.
The third graph shows the employment population ratio and the participation rate.
 The Labor Force Participation Rate decreased to 62.1% in July, from 62.2% in June. This is the percentage of the working age population in the labor force.
 The Employment-Population ratio increased to 60.0% from 59.9% (blue line).
I'll post the 25 to 54 age group employment-population ratio graph later.
 The fourth graph shows the unemployment rate.
 The unemployment rate was decreased in July to 3.5% from 3.6% in June.
This was well above consensus expectations; and May and June payrolls were revised up by 28,000 combined.
I'll have more later ...
Thursday, August 04, 2022
Friday: Employment Report
by Calculated Risk on 8/04/2022 08:48:00 PM
 My July Employment Preview
Goldman July Payrolls Preview
Friday:
• At 8:30 AM ET, Employment Report for July. The consensus is for 250,000 jobs added, and for the unemployment rate to be unchanged at 3.6%.
On COVID (focus on hospitalizations and deaths):
Hospitalizations have almost quadrupled from the lows in April 2022.
 Click on graph for larger image.
This graph shows the daily (columns) and 7-day average (line) of deaths reported.
| COVID Metrics | ||||
|---|---|---|---|---|
| Now | Week Ago | Goal | ||
| New Cases per Day2 | 117,350 | 126,536 | ≤5,0001 | |
| Hospitalized2 | 37,220 | 37,451 | ≤3,0001 | |
| Deaths per Day2 | 377 | 397 | ≤501 | |
| 1my goals to stop daily posts, 27-day average for Cases, Currently Hospitalized, and Deaths 🚩 Increasing 7-day average week-over-week for Cases, Hospitalized, and Deaths ✅ Goal met. | ||||
 Click on graph for larger image.
This graph shows the daily (columns) and 7-day average (line) of deaths reported.
Average daily deaths bottomed in July 2021 at 214 per day.
Goldman July Payrolls Preview
by Calculated Risk on 8/04/2022 04:44:00 PM
A few brief excerpts from a note by Goldman Sachs economist Spencer Hill:
We estimate nonfarm payrolls rose by 225k in July (mom sa) ... The July seasonal factors have become significantly more restrictive—even more so than in June—and the seasonal adjustment algorithm may be overfitting to the reopening-related job strength in the summers of 2020 and 2021. ... We estimate that the unemployment rate was unchanged at 3.6% in July ...CR Note: The consensus is for 250 thousand jobs added, and for the unemployment rate to be unchanged at 3.6%.
emphasis added
Hotels: Occupancy Rate Down 3.8% Compared to Same Week in 2019
by Calculated Risk on 8/04/2022 03:37:00 PM
U.S. hotel performance dipped slightly from the previous week, which was the traditional summer travel peak, according to STR‘s latest data through July 30.The following graph shows the seasonal pattern for the hotel occupancy rate using the four-week average.
July 24-30, 2022 (percentage change from comparable week in 2019*):
• Occupancy: 71.9% (-3.8%)
• Average daily rate (ADR): $158.32 (+18.3%)
• Revenue per available room (RevPAR): $113.90 (+13.9%)
*Due to the pandemic impact, STR is measuring recovery against comparable time periods from 2019.
emphasis added
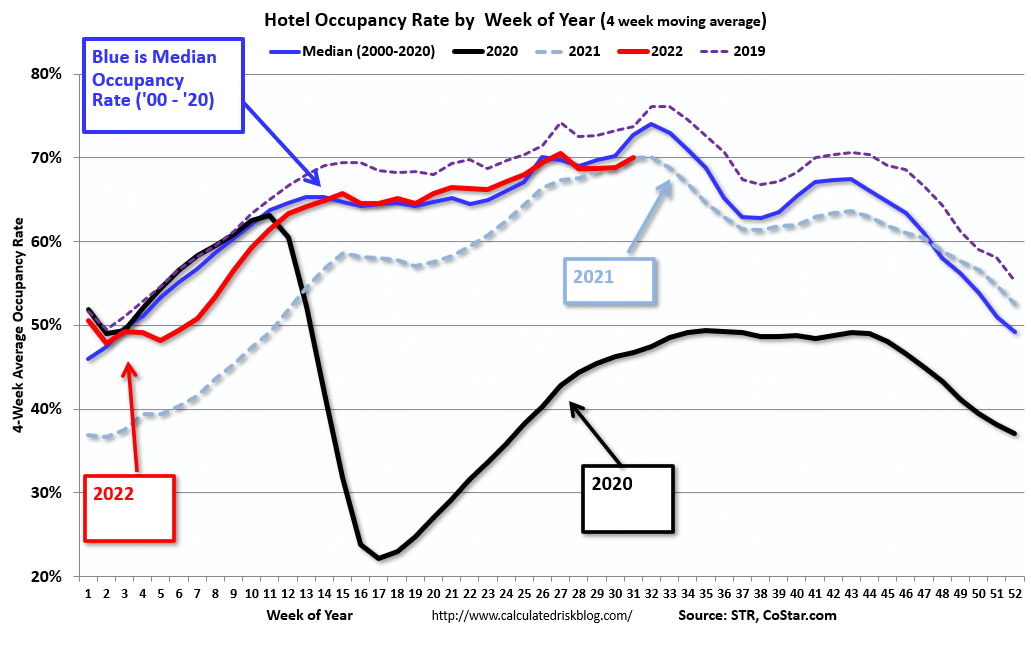 Click on graph for larger image.
The red line is for 2022, black is 2020, blue is the median, and dashed light blue is for 2021. Dashed purple is 2019 (STR is comparing to a strong year for hotels).
The 4-week average of the occupancy rate is just below the median rate for the previous 20 years (Blue).
Note: Y-axis doesn't start at zero to better show the seasonal change.
The 4-week average of the occupancy rate will peak in seasonally in a few weeks.
Denver Real Estate in July: Sales Off 31.6% YoY, Inventory Up 81.5%
by Calculated Risk on 8/04/2022 01:13:00 PM
Today, in the Calculated Risk Real Estate Newsletter: Denver Real Estate in July: Sales Off 31.6% YoY, Inventory Up 81.5%
A brief excerpt:
Every month I track about 35 local housing markets in the US, and I usually post several markets at a time. But this is worth noting. Sales in Denver were off almost 32% year-over-year in July, compared to down 23.6% in June. This early reporting market suggests existing home sales will be even weaker in July than in June.There is much more in the article. You can subscribe at https://calculatedrisk.substack.com/
...
From the DMAR: DMAR Real Estate Market Trends ReportThe data confirms that the Denver Metro area is no longer in a shifting market. Instead, it has shifted, and the real estate market is more balanced. …DMAR reports total residential active inventory (detached and attached) was 7,361 at the end of July, up 21.5% from 6,057 at the end of June, and up 81.5% year-over-year from 4,056 in July 2021.
Every indicator points to the market shifting closer to a buyer’s market ....
July Employment Preview
by Calculated Risk on 8/04/2022 11:01:00 AM
On Friday at 8:30 AM ET, the BLS will release the employment report for July. The consensus is for 250,000 jobs added, and for the unemployment rate to be unchanged at 3.6%.
 Click on graph for larger image.
• First, currently there are still about 500 thousand fewer jobs than in February 2020 (the month before the pandemic).
This graph shows the job losses from the start of the employment recession, in percentage terms.
The current employment recession was by far the worst recession since WWII in percentage terms. However, the current employment recession, 28 months after the onset, has recovered quicker than the previous two recessions.
• ADP Report: The ADP employment report has been "paused" and is being retooled.
• ISM Surveys: Note that the ISM services are diffusion indexes based on the number of firms hiring (not the number of hires). The ISM® manufacturing employment index decreased in July to 49.9%, up from 47.3% last month. This would suggest about 20,000 jobs lost in manufacturing.
The ISM® services employment index increased in July to 49.1%, up from 47.4% last month. This would suggest service employment was increased about 50,000 in July.
Combined, the ISM surveys suggest only 30,000 jobs added in July.
• Unemployment Claims: The weekly claims report showed an increase in the number of initial unemployment claims during the reference week (includes the 12th of the month) from 233,000 in June to 261,000 in July. This would usually suggest a few more layoffs in June than in May. In general, weekly claims were above expectations in July.
• COVID: As far as the pandemic, the number of daily cases during the reference week in June was around 125,000, up from 105,000 in June.
• Conclusion: The consensus is for job growth to slow to 250,000 jobs added in July. Overall, the ISM surveys improved, but still suggested few jobs added in July. Unemployment claims increased during the reference week. This suggests a weaker than expected employment report for July.


