 RSS Feed
 by Calculated Risk on 8/09/2022 03:14:00 PM
Tuesday, August 09, 2022
Vehicle Sales: Fleet Turnover Ratio and the Inflation Impact
Back in early 2009, I wrote a couple of posts arguing there would be an increase in auto sales - Vehicle Sales (Jan 2009) and Looking for the Sun (Feb 2009). This was an out-of-the-consensus call and helped me call the bottom for the US economy in mid-2009.
I wrote an update in 2014, and argued vehicle sales would "mostly move sideways" for the next few years.
Here is another update to the U.S. fleet turnover graph.
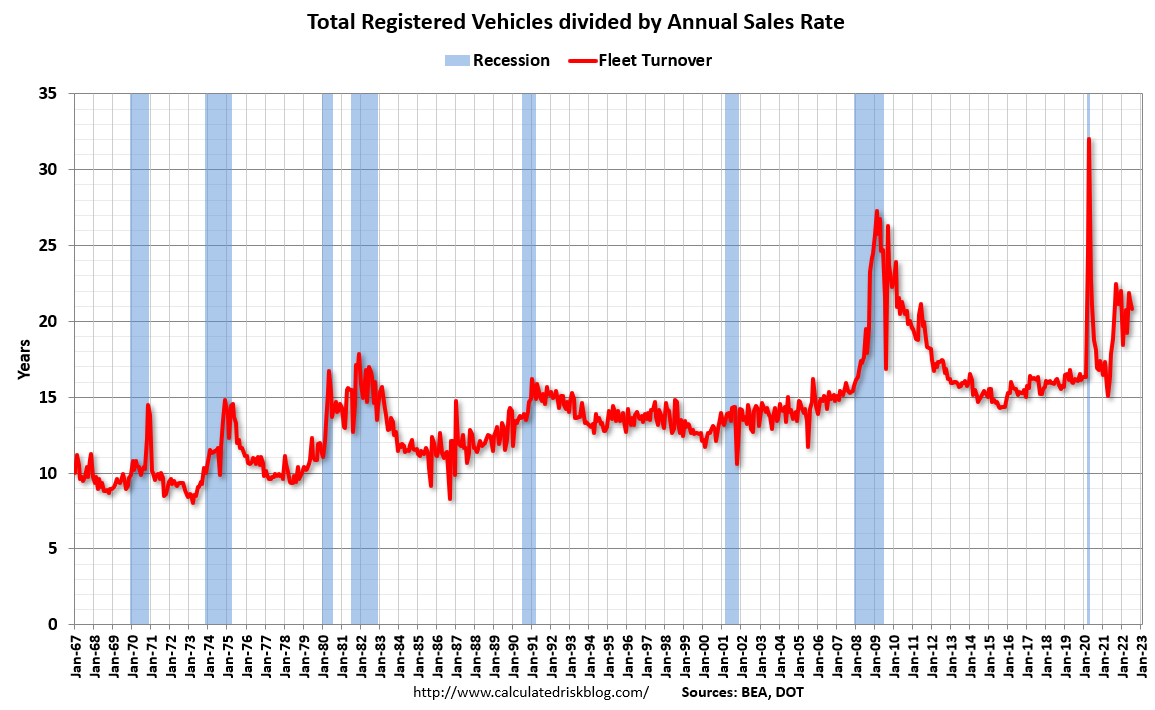
This graph shows the total number of registered vehicles in the U.S. divided by the sales rate through July 2022 - and gives a turnover ratio for the U.S. fleet (this doesn't tell you the age or the composition of the fleet). Note: the number of registered vehicles is estimated for 2021 and 2022.
The wild swings in 2009 were due to the "cash for clunkers" program.
And in April 2020, sales collapsed due to the onset of the pandemic.
 Click on graph for larger image in graph gallery.
The estimated ratio for July is close to 21 years - well above the normal level.
Note: in 2009, I argued the turnover ratio would "probably decline to 15 or so eventually" and that happened - and will likely happen again.
The second graph shows light vehicle sales since the BEA started keeping data in 1967. The dashed line is current estimated sales rate.
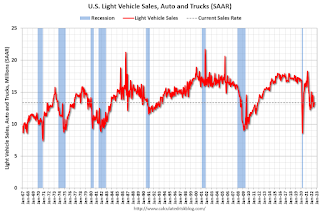 The current sales rate is still low mostly due to pandemic related supply constraints.
Light vehicle sales were at a 13.35 million seasonally adjusted annual rate (SAAR) in July.
I expect vehicle sales to increase over the next couple of years.
When the Fed fights inflation, housing is the primary transmission mechanism for Fed policy, since housing is interest rate sensitive.
Usually, vehicle sales are impacted too by Fed policy, but probably not this time since sales are so low due to the supply constraints.
Leading Index for Commercial Real Estate increases in July
by Calculated Risk on 8/09/2022 11:32:00 AM
From Dodge Data Analytics: Dodge Momentum Index Moves Higher In July
The Dodge Momentum Index (DMI) increased 2.9% in July to 178.7 from the revised June figure of 173.6.
The Momentum Index, issued by Dodge Construction Network, is a monthly measure of the initial report for nonresidential building projects in planning. The index is shown to lead construction spending for nonresidential buildings by a full year. In July, the commercial component of the Momentum Index rose 5.5%, while the institutional component fell 2.0%.
Commercial planning in July was led by an increase in data center, office and warehouse projects, while fewer education and healthcare projects drove the institutional component lower. Compared to July 2021, the Momentum Index was 8%. The commercial component was 15% higher, while the institutional component was 3% lower than a year ago.July 2021.
emphasis added
 Click on graph for larger image.
This graph shows the Dodge Momentum Index since 2002. The index was at 178.7 in July, up from 173.6 in June.
According to Dodge, this index leads "construction spending for nonresidential buildings by a full year". This index suggested a decline in Commercial Real Estate construction through most of 2021, but a solid pickup this year and into 2023.
1st Look at Local Housing Markets in July
by Calculated Risk on 8/09/2022 08:22:00 AM
Today, in the Calculated Risk Real Estate Newsletter: 1st Look at Local Housing Markets in July
A brief excerpt:
This is the first look at local markets in July. I’m tracking about 35 local housing markets in the US. Some of the 35 markets are states, and some are metropolitan areas. I’ll update these tables throughout the month as additional data is released.There is much more in the article. You can subscribe at https://calculatedrisk.substack.com/
We are seeing a significant change in inventory, but no pickup in new listings. Most of the increase in inventory so far has been due to softer demand - likely because of higher mortgage rates.
...
And a table of July sales. Sales in these areas were down 32.4% YoY, Not Seasonally Adjusted (NSA). Contracts for sales in July were mostly signed in May and June, and we are seeing the impact of higher mortgage rates on July closings.
Last month, these six markets were down 21.3% YoY NSA, so there appears to have been a significant further sales decline in July (this is just a few early markets).
Much more to come!

Monday, August 08, 2022
Housing Inventory Growth Has Slowed in Recent Weeks
by Calculated Risk on 8/08/2022 12:34:00 PM
Today, in the Calculated Risk Real Estate Newsletter: Housing Inventory Growth Has Slowed in Recent Weeks
A brief excerpt:
The third graph uses the Altos inventory data and shows the trend comparing to the same week in 2020 and 2019. The dotted red line is the recent trend compared to 2020 - and at the current pace, inventory will be up compared to 2020 in September. The dashed grey line is comparing to 2019, and based on the current trend, it is possible inventory will be back to 2019 levels in the first half of 2023. However, if inventory growth stalls, then it might take much longer to reach normal inventory levels.There is much more in the article. You can subscribe at https://calculatedrisk.substack.com/
...
The current situation is very different from the post-bubble period. Following the housing bubble, many homeowners were forced to sell because they had little or no equity in their homes, and loans that they could no longer afford when teaser rates expired. This led to a huge surge in inventory starting in late 2005.
Now most homeowners have substantial equity, and fixed rate loans with low interest rates. This suggests there will be little forced selling, even if prices decline in some areas.
Some people will always need to sell due to death, divorce, moving for work, etc., and some speculators might be forced to sell, but it is unlikely we will see a huge surge in inventory like in late-2005.
I’ve been expecting inventory to return to 2019 levels in early 2023 with low demand and some normal levels of new listings. However, it is possible that it might take much longer to return to more normal inventory levels - inventory will tell the tale!

August 8th Update: Housing Inventory Increases Slow
by Calculated Risk on 8/08/2022 08:49:00 AM
Inventory is still increasing, but the inventory build has slowed. Here are the same week inventory changes for the last four years:
2022: 5.0K
2021: 4.5K
2020: -14.0K
2019: -6.4K
Inventory bottomed seasonally at the beginning of March 2022 and is now up 126% since then. Altos reports inventory is up 32.1% year-over-year and is now 24.4% above the peak last year.
 Click on graph for larger image.
This inventory graph is courtesy of Altos Research.
 Click on graph for larger image.
This inventory graph is courtesy of Altos Research.
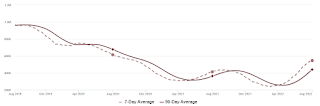
As of August 5th, inventory was at 544 thousand (7-day average), compared to 539 thousand the prior week. Inventory was up 0.9% from the previous week.
Inventory is still historically low. Compared to the same week in 2021, inventory is up 32.1% from 412 thousand, however compared to the same week in 2020 inventory is down 11.2% from 613 thousand. Compared to 3 years ago, inventory is down 43.7% from 966 thousand.
Here are the inventory milestones I’m watching for with the Altos data:
1. The seasonal bottom (happened on March 4th for Altos) ✅
2. Inventory up year-over-year (happened on May 13th for Altos) ✅
3. Inventory up compared to two years ago (currently down 11.2% according to Altos)
4. Inventory up compared to 2019 (currently down 43.7%).
1. The seasonal bottom (happened on March 4th for Altos) ✅
2. Inventory up year-over-year (happened on May 13th for Altos) ✅
3. Inventory up compared to two years ago (currently down 11.2% according to Altos)
4. Inventory up compared to 2019 (currently down 43.7%).

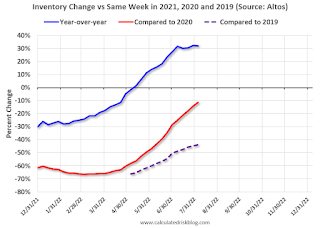
Here is a graph of the inventory change vs 2021, 2020 (milestone 3 above) and 2019 (milestone 4).
The blue line is the year-over-year data, the red line is compared to two years ago, and dashed purple is compared to 2019.
Two years ago (in 2020) inventory was declining all year, so the two-year comparison will get easier all year.
Based on the recent increases in inventory, my current estimate is inventory will be up compared to 2020 in September of this year.
Mike Simonsen discusses this data regularly on Youtube.
Four High Frequency Indicators for the Economy
by Calculated Risk on 8/08/2022 08:13:00 AM
These indicators are mostly for travel and entertainment. It is interesting to watch these sectors recover as the pandemic subsides. Notes: I've added back gasoline supplied to see if there is an impact from higher gasoline prices.
The TSA is providing daily travel numbers.
This data is as of August 7th.
 Click on graph for larger image.
This data shows the 7-day average of daily total traveler throughput from the TSA for 2019 (Light Blue), 2020 (Black), 2021 (Blue) and 2022 (Red).
The dashed line is the percent of 2019 for the seven-day average.
The 7-day average is down 11.0% from the same day in 2019 (89.0% of 2019). (Dashed line)
Air travel - as a percent of 2019 - has been moving sideways over the last several months, off about 10% from 2019 - with some ups and downs, usually related to the timing of holidays.
 This data shows domestic box office for each week and the median for the years 2016 through 2019 (dashed light blue).
 Black is 2020, Blue is 2021 and Red is 2022.
The data is from BoxOfficeMojo through August 4th.
Note that the data is usually noisy week-to-week and depends on when blockbusters are released.
Movie ticket sales were at $151 million last week, down about 40% from the median for the week.
Note that the data is usually noisy week-to-week and depends on when blockbusters are released.
Movie ticket sales were at $151 million last week, down about 40% from the median for the week.
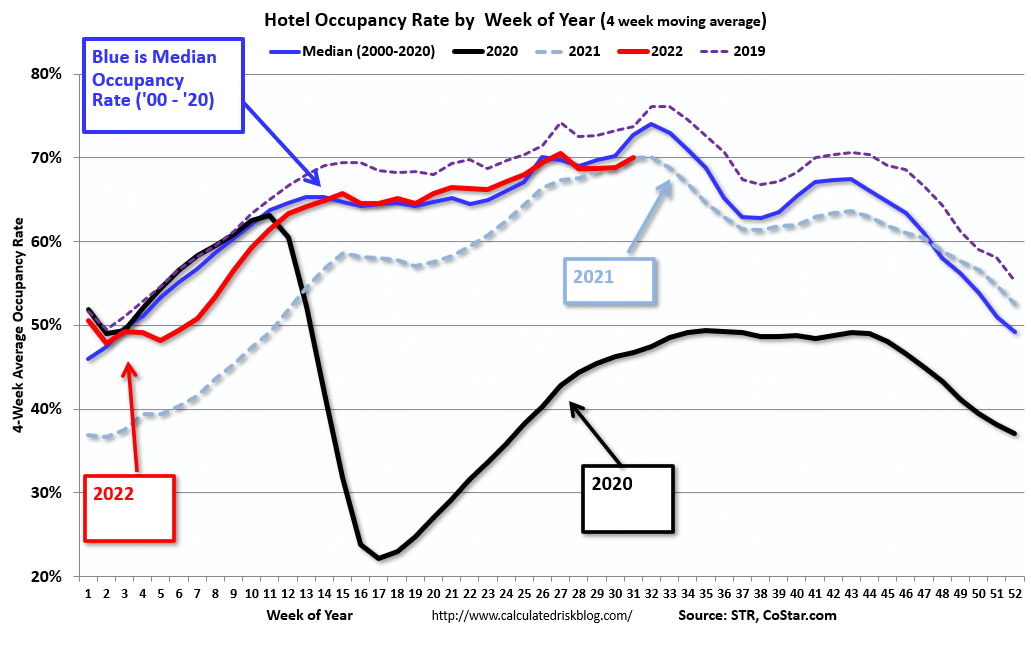 This graph shows the seasonal pattern for the hotel occupancy rate using the four-week average.
 The red line is for 2022, black is 2020, blue is the median, and dashed light blue is for 2021. Dashed purple is 2019 (STR is comparing to a strong year for hotels).
This data is through July 30th. The occupancy rate was down 3.8% compared to the same week in 2019.
The 4-week average of the occupancy rate is below the median rate for the previous 20 years (Blue).
Notes: Y-axis doesn't start at zero to better show the seasonal change.
Notes: Y-axis doesn't start at zero to better show the seasonal change.

This graph, based on weekly data from the U.S. Energy Information Administration (EIA), shows gasoline supplied compared to the same week of 2019.
Blue is for 2020. Purple is for 2021, and Red is for 2022.
As of July 29th, gasoline supplied was down 10.6% compared to the same week in 2019.
Recently gasoline supplied has been running somewhat below 2019 levels.
Sunday, August 07, 2022
Sunday Night Futures
by Calculated Risk on 8/07/2022 08:01:00 PM
Weekend:
• Schedule for Week of August 7, 2022
Monday:
• No major economic releases scheduled.
From CNBC: Pre-Market Data and Bloomberg futures S&P 500 are down 11 and DOW futures are down 70 (fair value).
Oil prices were down over the last week with WTI futures at $89.01 per barrel and Brent at $94.92 per barrel. A year ago, WTI was at $68, and Brent was at $71 - so WTI oil prices are up 30% year-over-year.
Here is a graph from Gasbuddy.com for nationwide gasoline prices. Nationally prices are at $4.03 per gallon. A year ago, prices were at $3.16 per gallon, so gasoline prices are up $0.87 per gallon year-over-year.
AAR: July Rail Carloads Up Slightly Year-over-year, Intermodal Down
by Calculated Risk on 8/07/2022 08:11:00 AM
From the Association of American Railroads (AAR) Rail Time Indicators. Graphs and excerpts reprinted with permission.
Rail traffic in July was evenly balanced between commodities with carload gains and those with declines. As such, it doesn’t provide definitive evidence regarding the state of the overall economy. Moreover, the traffic category historically most highly correlated with GDP is “industrial products,” a combination of seven other categories. Carloads of industrial products have fallen for four straight months, but the declines have all been extremely small.
emphasis added
 Click on graph for larger image.
This graph from the Rail Time Indicators report shows the six-week average of U.S. Carloads in 2020, 2021 and 2022:
In July 2022, U.S. railroads originated 906,903 total carloads — up 0.2% (2,213 carloads) over July 2021. The year-over-year gain was not large, but it was the first gain of any size in four months. Intermodal is not included in carload totals.
 The second graph shows the six-week average (not monthly) of U.S. intermodal in 2020, 2021 and 2022: (using intermodal or shipping containers):
U.S railroads also originated 1.03 million intermodal containers and trailers in July 2022, down 3.0% (32,094 units) from last year. July marked the 11th decline in the past 12 months, but it’s also the smallest percentage decline in those 11 months.
Saturday, August 06, 2022
Real Estate Newsletter Articles this Week
by Calculated Risk on 8/06/2022 02:11:00 PM
At the Calculated Risk Real Estate Newsletter this week:
• New Home Cancellations increased Sharply in Q2
• Denver Real Estate in July: Sales Off 31.6% YoY, Inventory Up 81.5%
• How Much will the Fannie & Freddie Conforming Loan Limit Increase for 2023?
• Will 5% Mortgage Rates Cushion the Housing Market?
• Black Knight Mortgage Monitor: "Record-Setting Slowdown in Home Price Growth
This is usually published 4 to 6 times a week and provides more in-depth analysis of the housing market.
You can subscribe at https://calculatedrisk.substack.com/
Most content is available for free (and no Ads), but please subscribe!
Schedule for Week of August 7, 2022
by Calculated Risk on 8/06/2022 08:11:00 AM
The key report this week is July CPI.
No major economic releases scheduled.
6:00 AM ET: NFIB Small Business Optimism Index for July.
12:00 PM: (expected) MBA Q2 National Delinquency Survey
7:00 AM ET: The Mortgage Bankers Association (MBA) will release the results for the mortgage purchase applications index.
8:30 AM: The Consumer Price Index for July from the BLS. The consensus is for a 0.2% increase in CPI, and a 0.5% increase in core CPI. The consensus is for CPI to be up 8.8% year-over-year and core CPI to be up 6.1% YoY.
8:30 AM: The initial weekly unemployment claims report will be released. The consensus is for 263 thousand up from 260 thousand last week.
8:30 AM: The Producer Price Index for July from the BLS. The consensus is for a 0.3% increase in PPI, and a 0.4% increase in core PPI.
10:00 AM: University of Michigan's Consumer sentiment index (Preliminary for August).


